- devika's home page
- Posts
- 2018
- May (1)
- 2017
- 2016
- December (1)
- November (1)
- October (1)
- September (4)
- June (2)
- May (2)
- April (5)
- March (4)
- January (3)
- 2015
- 2014
- November (4)
- September (3)
- August (4)
- July (1)
- June (7)
- May (1)
- April (2)
- March (1)
- February (4)
- January (7)
- 2013
- My blog
- Post new blog entry
- All blogs
Run 13 BEMC Calibration : Trigger bias discussion [during the STAR collaboration meeting January2016]
Updated on Fri, 2016-04-01 22:07. Originally created by devika on 2016-01-26 18:00.
Slides
Slides2
E /p distribution plots for mometum slices:
BHT1->didFire()==>tower
BHT3->didFire() ===> 2x2cluster , tower
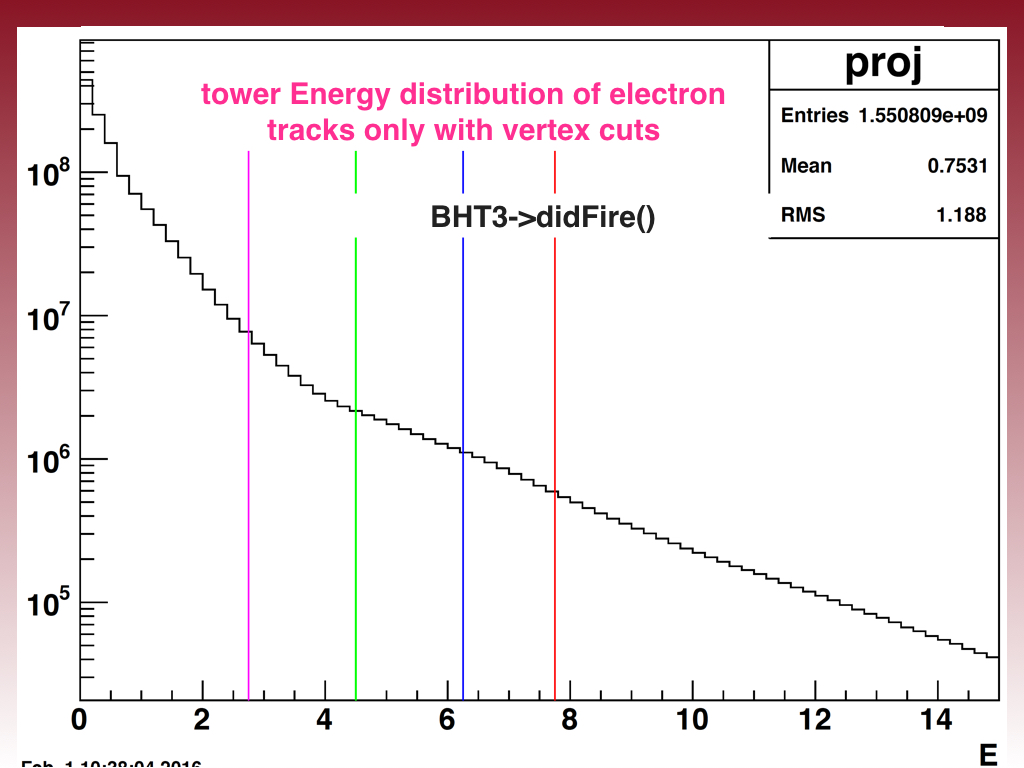
BHT3->didFire() && ! trackAboveTH(3) ===> tower
BHT3->didFire() && ! trackAboveTH(3) && !(BHT1->didFire() && trackAboveTH(1)) ===> tower
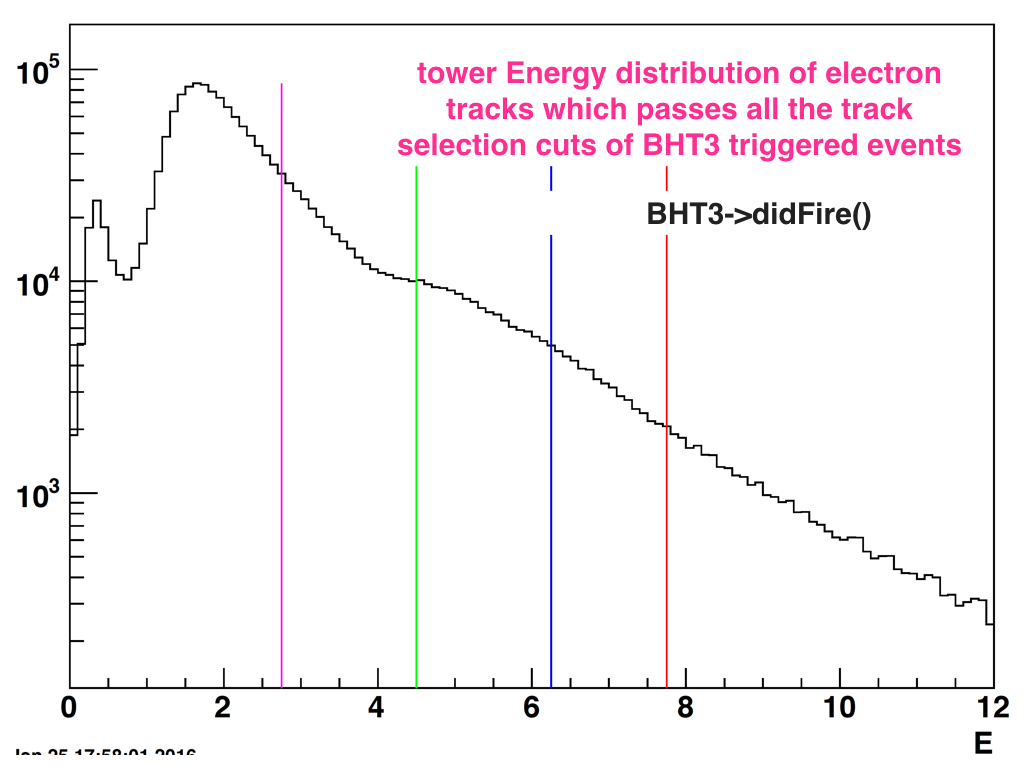
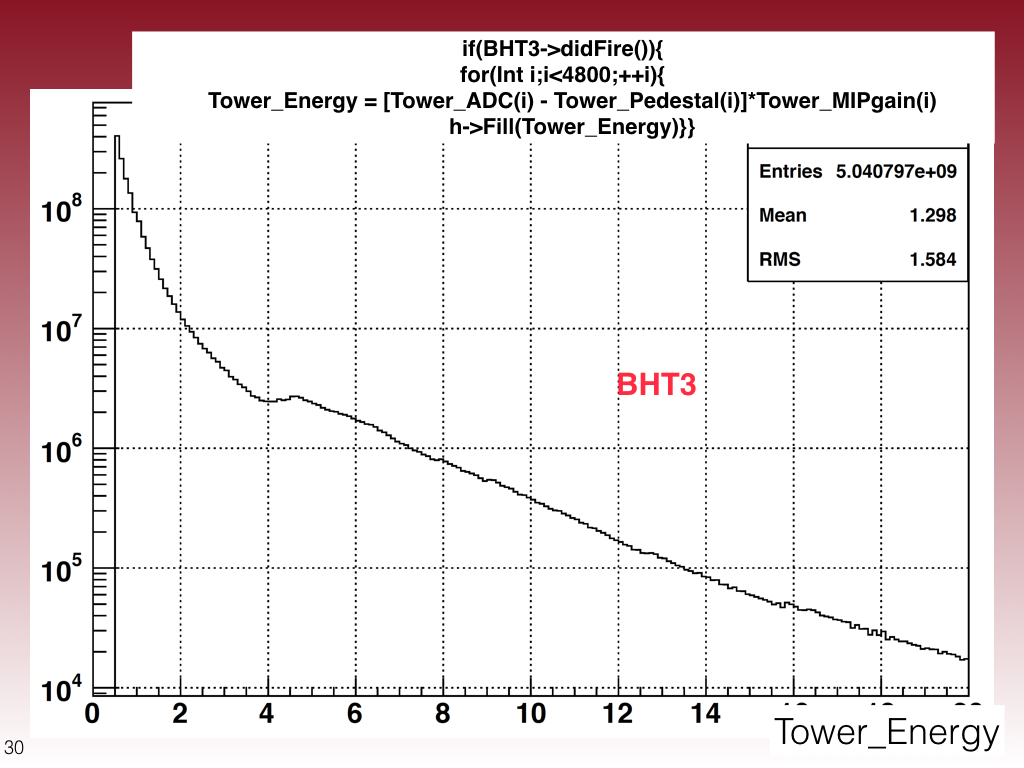
Up on the discussion, (Renee, scoutt, Jeff) everyone claim that the shape of the tower enrgy distribution for BHT3 trigger is not understananble. The bump around ~5 GeV is not acceptable for BHT3 triggerd events. So Jeff suggested to obtain the same distribution with out any track cuts:
****************************************************************************************************************************************************************
Jeff's response on slides2 :
The conclusion that you make about BHT1 events are unintentionally mixed in with BHT3 does not seem possible to me. BHT3 was unprescaled. Therefore, any event that has a high tower > BHT3 is by definition a BHT3 event, and can not be "incorrectly added to the sample". There are two possible effects that could lead to a true problem:
1. If you find BHT3 events that DO NOT have a tower > BHT3
2. If you have doubly counted events.
Point #1 has never been shown but would be easy to check. Point #2 could happen due to straight out bugs in the analysis code. It could also happen if you are including multiple data streams in your analysis but this is well known not to be allowed...
Beyond this, I have serious issues with many of the plots. For example, on page 4 the plots are labeled, "Energy distribution for a track matched to a tower above BHT3". By definition, the smallest energy in that distribution has to be BHT3. But there is actually a broad peak kicking in at BHT1. Either I am missing something very basic, or else there is something horribly and obviously wrong with the plot. The energy matching used in the cut of events is different from the energy calculation in the plot. If towers that have an energy > BHT3 show up on these plots having energy ~BTH1 on this plot, then I suspect the thing is happening on the other plots as well.
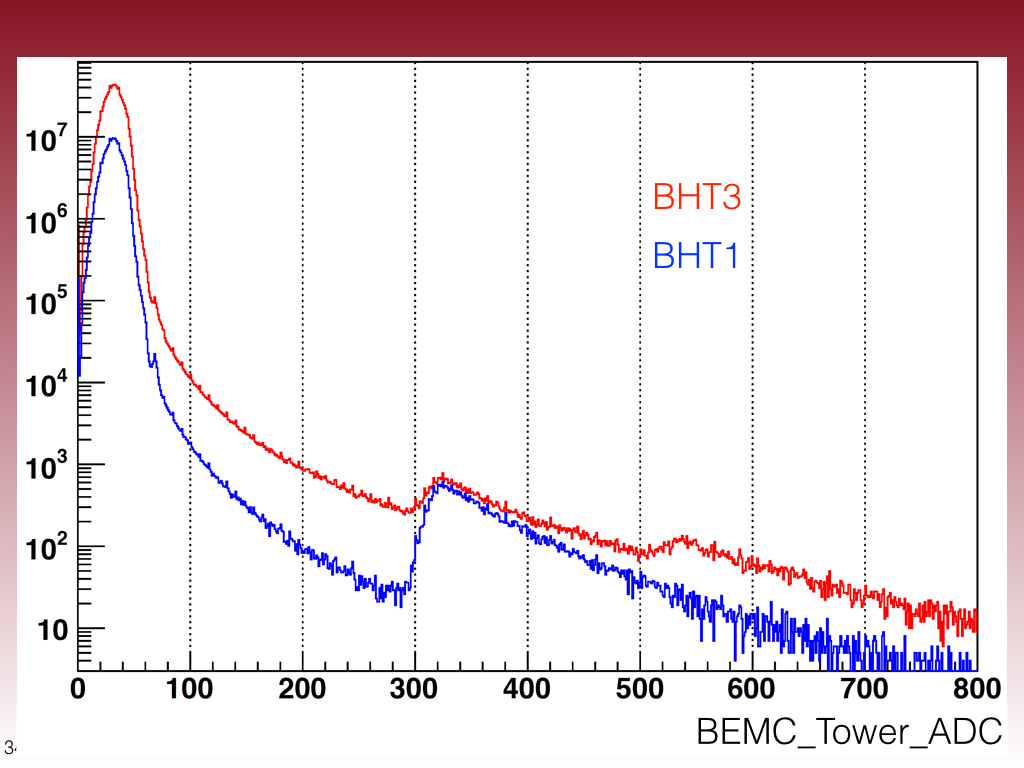
I don't know what to do about the calibration problems you are having, but if the question you are trying to address is whether or not the BHT1 is corrupting the BHT3 sample the simple thing to plot is the bare HT spectrum for these two triggers. No tracks, no cuts, nothing. The distributions for the two triggers should look nearly the same with the peaks at different energies. If you see a sharp peak at BHT1 distribution superimposed on the BHT3 spectrum them there is an obvious problem!
Scott's response on slides2 :
for each event, check if it satisfied the BHT3->didFire condition. If so, loop through all the barrel towers; whenever you find one with an energy above some threshold (maybe 0.5 GeV), increment the histogram in that energy bin. No tests or loops based on tracks, no requirement of tracks matching to towers (or not), and you can even give up the vertex cuts. This should yield a very smooth, min-bias-like spectrum, until you get close to the BHT3 threshold, where there should be a notable enhancement in the yield.
Based on suggestions, I read MuDsts again to get Tower_ADC values and Tower_pedestal valuse for each triggeroptions at the event elevel. No tracks , vertex info .
BHT3->
if(BHT3->didFire()){
for(Int_t i=0< i<4800;++i)
Tower_energy=[ mEvent->Tower_ADC(i)- mEvent->Tower_Ped(i)] * Tower_MIPgain(i)
h->Fill (Tower_energy)}}, distribution
BHT1->
if(BHT1->didFire()){
for(Int_t i=0< i<4800;++i)
Tower_energy=[ mEvent->Tower_ADC(i)- mEvent->Tower_Ped(i)] * Tower_MIPgain(i)
h->Fill (Tower_energy)}}, distribution
BHT1-vs-BHT3 , BHT1-vs-BHT3-zoomed
Jeff's Response:
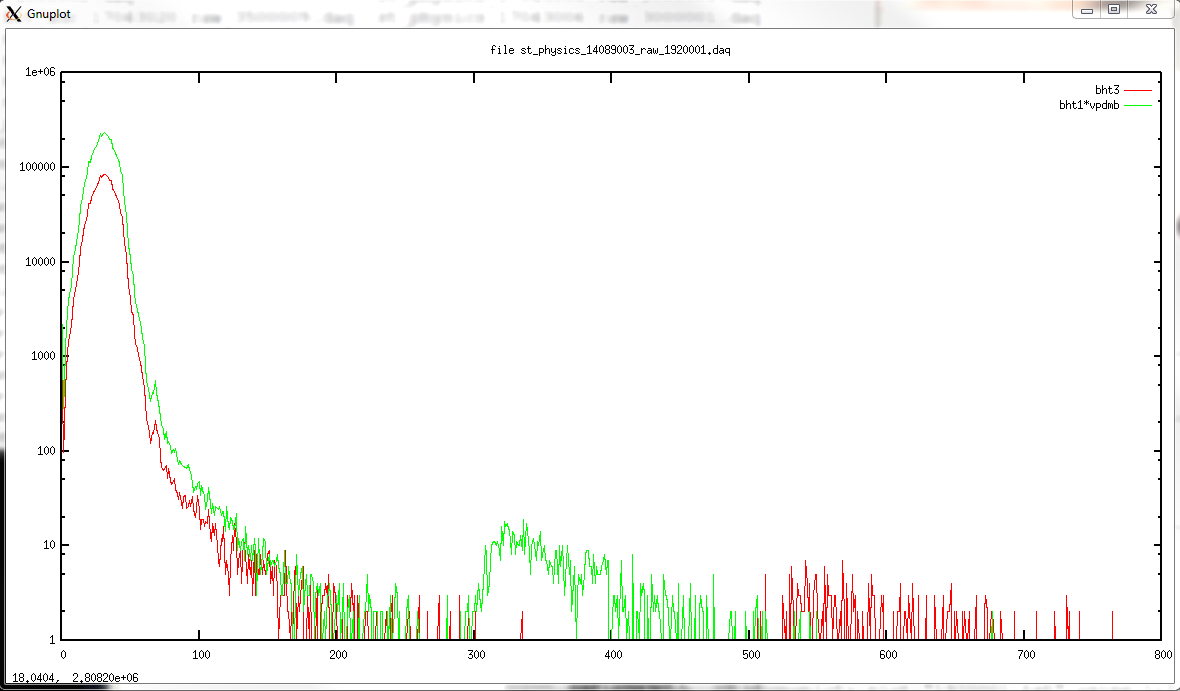
The results are attached. You see CLEARLY a BTH1 peak in the BHT1 trigger and a BHT3 peak in the BHT3 trigger as you MUST by the definitions, and though statistics are tiny, I don't see any evidence of BHT1 contaminating BHT3.
I don't know if your data sample is wrong, the trigger identification is wrong, the gain parameters are wrong, or something is calculated wrong in the DST, but something is clearly wrong... If it were me I'd find a way to do your analysis on this exact file (rerunning the full chain over one file can't take too long). If you get the same results as I do that gives us one thing. If you get different results, that shows us something else...
If you are interested my program is:
cvs/StRoot/RTS/src/RTS_
Jeff's example plot: bht3andbht1vpd
.png)
________________________________________________________________________________________________________________________________________
Renee's Response :
If that MuDst was produced then you could make the same plot from the MuDst by just plotting the adc instead of the Et.
If the MuDst for 14089003_1920001 isn't produced I wouldn't recommend running bfc.C - it is better to use official production. So if that MuDst wasn't produced just run over another MuDst of a daq file that Jeff has access to and then you can compare.
****************************************************************************************************************************************************************
choose,
BHT1, BHT3
4 files:
st_physics_adc_14089003_raw_8570002.MuDst.root
BHT1 , BHT3
****************************************************************************************************************************************************************
Jeff's response to the above plot:
I reran over the file you chose (st_physics_adc_14089003_raw_8
I'd point out that this is a particularly bad file to look at. It's a very small file, and also it is an adc file which means that the events are 10 times larger than normal. The file has only 45 events total: 5 are bht1*vpd, and 10 are bht3. These numbers match between the run log database and the file itself, so I believe them.
Your plots show 4420800 bht1 towers corresponding to 921 events. They show 4e7 bht3 towers corresponding to more than 4000 bht3 events. Obviously something is not right here, as you are plotting far more events than exist in the data file.
I also looked at (st_physics_14089003_raw_54600
******************************************************************************************************************
So it seems I am running large # of events than these files contain.
How come ?
I might be doing something wrong ,, I asked Jinlong to do the same to cross check. He also got the same results. He also pointed out I am proccessing more than one file.
So Found out I have proccessed more than one file. I mistook that I have proccessed only one file.
Replot distributions of the files and found the correct # of BHT1 events but not BHT3 events.
Something wrong with # of BHT3 events.
Here's the example file Jeff was refering to.
Ex: st_physics_14089003_raw_54600
According to the run log this file contains :
BHT1 events = 1063 BHT1_ADC , Events / 4800 == 5102400/4800 ==1063 correct
BHT3 = 345 BHT3_ADC , Events / 4800 = 23707200 / 4800 ~ 5000
Total Events = 5110
It seems the code taged the correct # of events for BHT1 but not for BHT3. For BHT3 all the evnts of the files were taged as BHT3. This lead us to suspect that there might be a "bug" in the code.
And Found the bug..
Its a simple "else if" statement of the pointer to BHT3 triggered events. Fixed it.
Here's the correct plots.
Thank you so much Jeff for all the help!
****************************************************************************************************************************************************************
Now here's correct BHT3->didFire() Energy distributions..jpeg)
Trigger-bias-discussion-during-the-STAR-colloboration-meeting-January-2016
Slides I presented during the discusion: Slides
Slides2
E /p distribution plots for mometum slices:
BHT1->didFire()==>tower
BHT3->didFire() ===> 2x2cluster , tower
BHT3->didFire() && ! trackAboveTH(3) ===> tower
BHT3->didFire() && ! trackAboveTH(3) && !(BHT1->didFire() && trackAboveTH(1)) ===> tower
Electron-Analysis-Cuts
- Vertex Rank > 1e6
- |vertex-Z| < 30 cm
- Track momentum > 1.5 GeV/c
- towerStatus = 1
- mipStatus = 1
- Track nHits > 25
- Track must enter and exit the same tower
- (ADC-ped) > 2.5 ped RMS
- 3.5e-6 < dE/dX < 5e-6
- nSigmaPion > 3
- -1 < nSigmaPion < 2
Comments from the discussion :
Up on the discussion, (Renee, scoutt, Jeff) everyone claim that the shape of the tower enrgy distribution for BHT3 trigger is not understananble. The bump around ~5 GeV is not acceptable for BHT3 triggerd events. So Jeff suggested to obtain the same distribution with out any track cuts:
****************************************************************************************************************************************************************
Jeff's response on slides2 :
The conclusion that you make about BHT1 events are unintentionally mixed in with BHT3 does not seem possible to me. BHT3 was unprescaled. Therefore, any event that has a high tower > BHT3 is by definition a BHT3 event, and can not be "incorrectly added to the sample". There are two possible effects that could lead to a true problem:
1. If you find BHT3 events that DO NOT have a tower > BHT3
2. If you have doubly counted events.
Point #1 has never been shown but would be easy to check. Point #2 could happen due to straight out bugs in the analysis code. It could also happen if you are including multiple data streams in your analysis but this is well known not to be allowed...
Beyond this, I have serious issues with many of the plots. For example, on page 4 the plots are labeled, "Energy distribution for a track matched to a tower above BHT3". By definition, the smallest energy in that distribution has to be BHT3. But there is actually a broad peak kicking in at BHT1. Either I am missing something very basic, or else there is something horribly and obviously wrong with the plot. The energy matching used in the cut of events is different from the energy calculation in the plot. If towers that have an energy > BHT3 show up on these plots having energy ~BTH1 on this plot, then I suspect the thing is happening on the other plots as well.
I don't know what to do about the calibration problems you are having, but if the question you are trying to address is whether or not the BHT1 is corrupting the BHT3 sample the simple thing to plot is the bare HT spectrum for these two triggers. No tracks, no cuts, nothing. The distributions for the two triggers should look nearly the same with the peaks at different energies. If you see a sharp peak at BHT1 distribution superimposed on the BHT3 spectrum them there is an obvious problem!
Scott's response on slides2 :
for each event, check if it satisfied the BHT3->didFire condition. If so, loop through all the barrel towers; whenever you find one with an energy above some threshold (maybe 0.5 GeV), increment the histogram in that energy bin. No tests or loops based on tracks, no requirement of tracks matching to towers (or not), and you can even give up the vertex cuts. This should yield a very smooth, min-bias-like spectrum, until you get close to the BHT3 threshold, where there should be a notable enhancement in the yield.
Based on suggestions, I read MuDsts again to get Tower_ADC values and Tower_pedestal valuse for each triggeroptions at the event elevel. No tracks , vertex info .
BHT3->
if(BHT3->didFire()){
for(Int_t i=0< i<4800;++i)
Tower_energy=[ mEvent->Tower_ADC(i)- mEvent->Tower_Ped(i)] * Tower_MIPgain(i)
h->Fill (Tower_energy)}}, distribution
BHT1->
if(BHT1->didFire()){
for(Int_t i=0< i<4800;++i)
Tower_energy=[ mEvent->Tower_ADC(i)- mEvent->Tower_Ped(i)] * Tower_MIPgain(i)
h->Fill (Tower_energy)}}, distribution
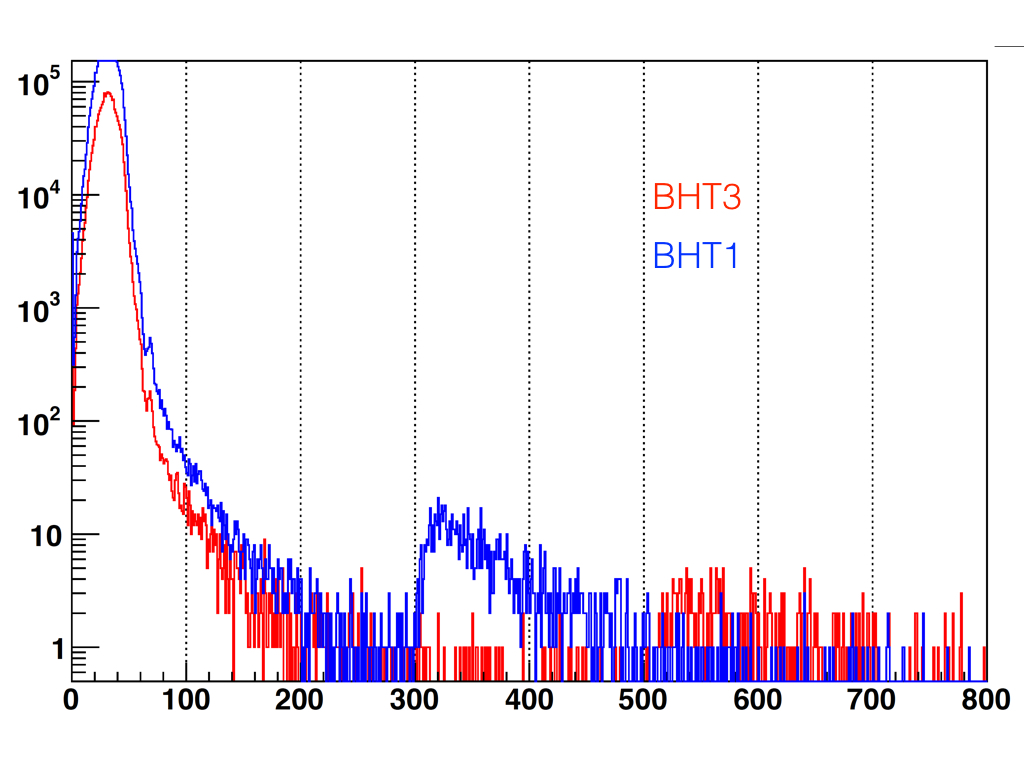
BHT1-vs-BHT3 , BHT1-vs-BHT3-zoomed
.jpeg)
.jpeg)
Jeff's Response:
The results are attached. You see CLEARLY a BTH1 peak in the BHT1 trigger and a BHT3 peak in the BHT3 trigger as you MUST by the definitions, and though statistics are tiny, I don't see any evidence of BHT1 contaminating BHT3.
I don't know if your data sample is wrong, the trigger identification is wrong, the gain parameters are wrong, or something is calculated wrong in the DST, but something is clearly wrong... If it were me I'd find a way to do your analysis on this exact file (rerunning the full chain over one file can't take too long). If you get the same results as I do that gives us one thing. If you get different results, that shows us something else...
If you are interested my program is:
cvs/StRoot/RTS/src/RTS_
Jeff's example plot: bht3andbht1vpd
________________________________________________________________________________________________________________________________________
Renee's Response :
If that MuDst was produced then you could make the same plot from the MuDst by just plotting the adc instead of the Et.
If the MuDst for 14089003_1920001 isn't produced I wouldn't recommend running bfc.C - it is better to use official production. So if that MuDst wasn't produced just run over another MuDst of a daq file that Jeff has access to and then you can compare.
****************************************************************************************************************************************************************
choose,
st_physics_adc_14089003_raw_8570002.MuDst.root
BHT1, BHT3
4 files:
st_physics_adc_14089003_raw_8570002.MuDst.root
st_physics_14089003_raw_8120004.MuDst.root
st_physics_14089003_raw_5460001.MuDst.root
st_physics_14089003_raw_2810001.MuDst.root
BHT1 , BHT3
****************************************************************************************************************************************************************
Jeff's response to the above plot:
I reran over the file you chose (st_physics_adc_14089003_raw_8
I'd point out that this is a particularly bad file to look at. It's a very small file, and also it is an adc file which means that the events are 10 times larger than normal. The file has only 45 events total: 5 are bht1*vpd, and 10 are bht3. These numbers match between the run log database and the file itself, so I believe them.
Your plots show 4420800 bht1 towers corresponding to 921 events. They show 4e7 bht3 towers corresponding to more than 4000 bht3 events. Obviously something is not right here, as you are plotting far more events than exist in the data file.
I also looked at (st_physics_14089003_raw_54600
******************************************************************************************************************
So it seems I am running large # of events than these files contain.
How come ?
I might be doing something wrong ,, I asked Jinlong to do the same to cross check. He also got the same results. He also pointed out I am proccessing more than one file.
So Found out I have proccessed more than one file. I mistook that I have proccessed only one file.
Replot distributions of the files and found the correct # of BHT1 events but not BHT3 events.
Something wrong with # of BHT3 events.
Here's the example file Jeff was refering to.
Ex: st_physics_14089003_raw_54600
According to the run log this file contains :
BHT1 events = 1063 BHT1_ADC , Events / 4800 == 5102400/4800 ==1063 correct
BHT3 = 345 BHT3_ADC , Events / 4800 = 23707200 / 4800 ~ 5000
Total Events = 5110
It seems the code taged the correct # of events for BHT1 but not for BHT3. For BHT3 all the evnts of the files were taged as BHT3. This lead us to suspect that there might be a "bug" in the code.
And Found the bug..
Its a simple "else if" statement of the pointer to BHT3 triggered events. Fixed it.
Here's the correct plots.
Thank you so much Jeff for all the help!
****************************************************************************************************************************************************************
Now here's correct BHT3->didFire() Energy distributions.
»
- devika's blog
- Login or register to post comments