- dilks's home page
- Posts
- 2019
- 2018
- December (1)
- November (1)
- October (1)
- August (2)
- July (4)
- June (3)
- May (1)
- April (2)
- March (2)
- February (1)
- January (5)
- 2017
- December (3)
- November (1)
- October (2)
- September (3)
- August (2)
- July (2)
- June (1)
- May (2)
- March (3)
- February (3)
- January (3)
- 2016
- November (2)
- September (4)
- August (2)
- July (6)
- June (2)
- May (3)
- April (1)
- March (2)
- February (3)
- January (2)
- 2015
- December (3)
- October (3)
- September (2)
- August (6)
- June (3)
- May (3)
- April (4)
- March (3)
- February (5)
- January (3)
- 2014
- December (1)
- November (1)
- October (3)
- September (4)
- August (3)
- July (3)
- June (2)
- May (2)
- April (2)
- March (1)
- 2013
- 2012
- 2011
- My blog
- Post new blog entry
- All blogs
A_LL Background Asymmetry
General idea: fit side-band regions to gain an idea of the shape of the background under the pion signal. This functional form which models the background is then used to determine the fraction of the signal region is pions, as opposed to backgrounds. Denoting the fraction of pions in the signal region by "F", the measured asymmetry in the signal region is the sum of the real asymmetry and the background asymmetry, weighted by this fraction:
![]()
One major concern is the statistics to compute the background asymmetry: it will have large error bars
We can also correct the mean pT for each pT bin by background-induced bias:
![]()
.
.
.
The fraction "F" can be determined by fitting the mass distribution: [ FIT METHOD DESCRIPTION ]
An example of how the asymmetries and errors change is given here [ FOR 26_AUG_2016 FMS MEETING ] [more details on uncertainty]
.
FMS Kinematics (run 12, same trigger mass used for analysis, run-dependent pT cut pions)
Eta rings and dependence of mass peak on eta
- inner red ring is at eta=3.28 (what we've been using to separate large and small cells for A_LL)
- outer ring is at 3.13, which better separates the two mass peaks in the mass vs. eta space (right figure, red line at 3.13)
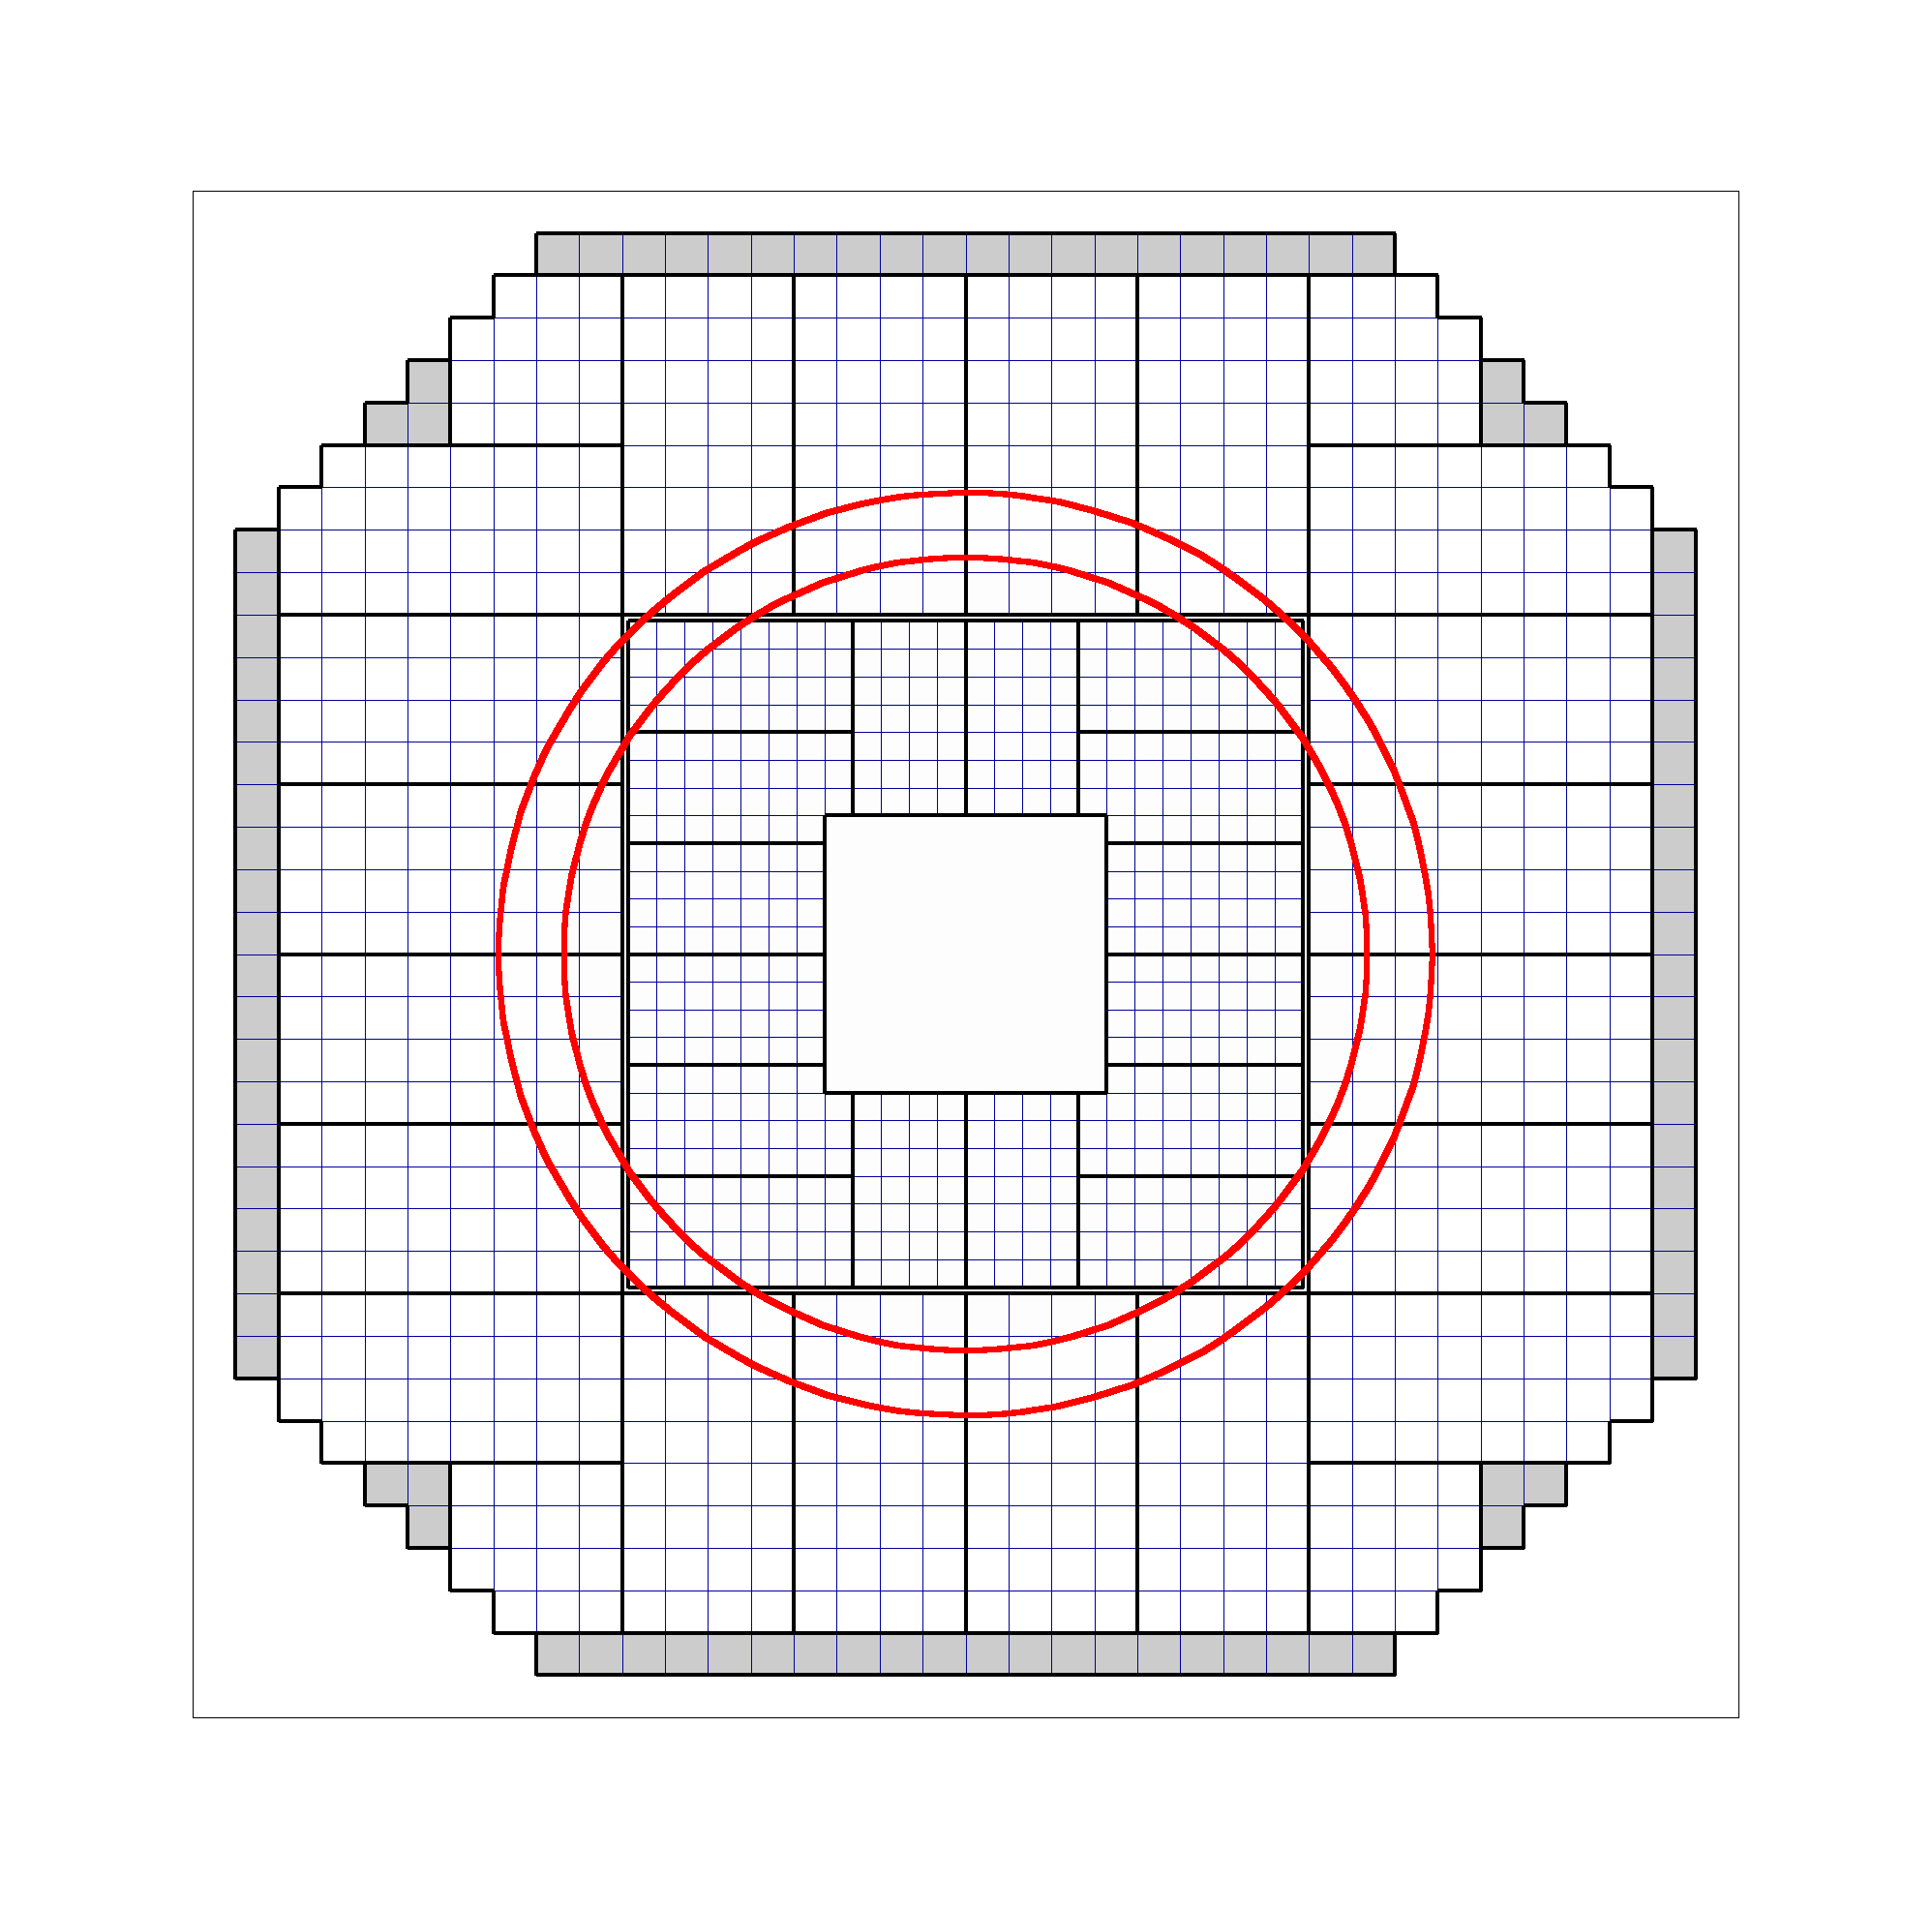

.
.
.
pT vs E for two eta regions; red lines are proposed background analysis bin boundaries
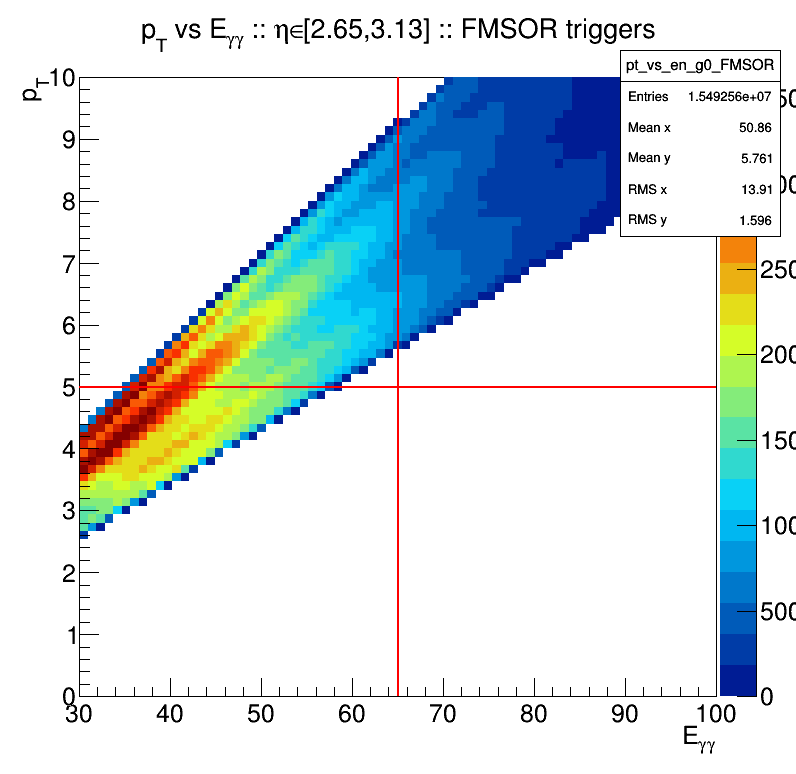
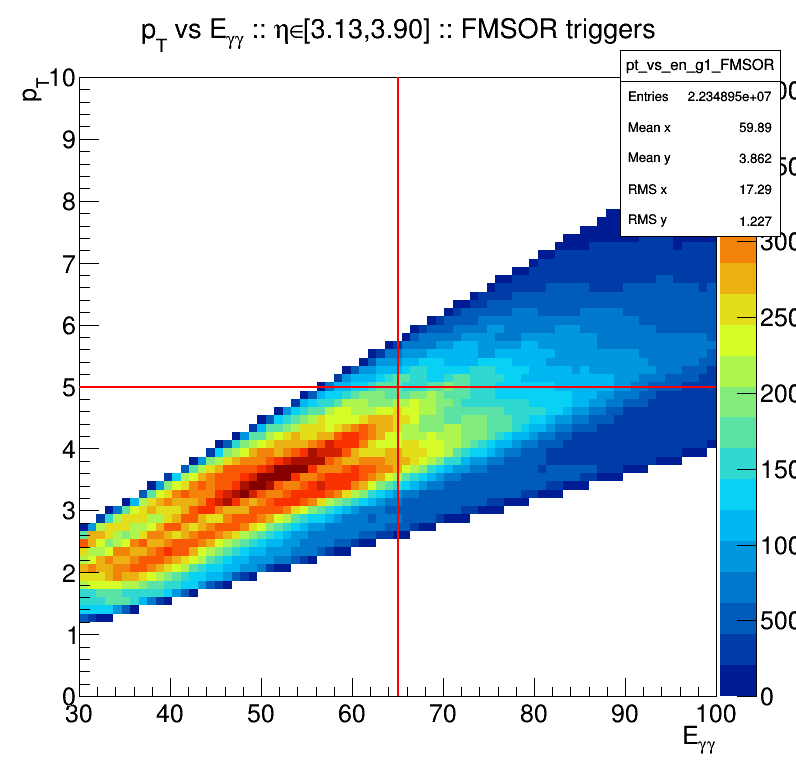
.
.
.
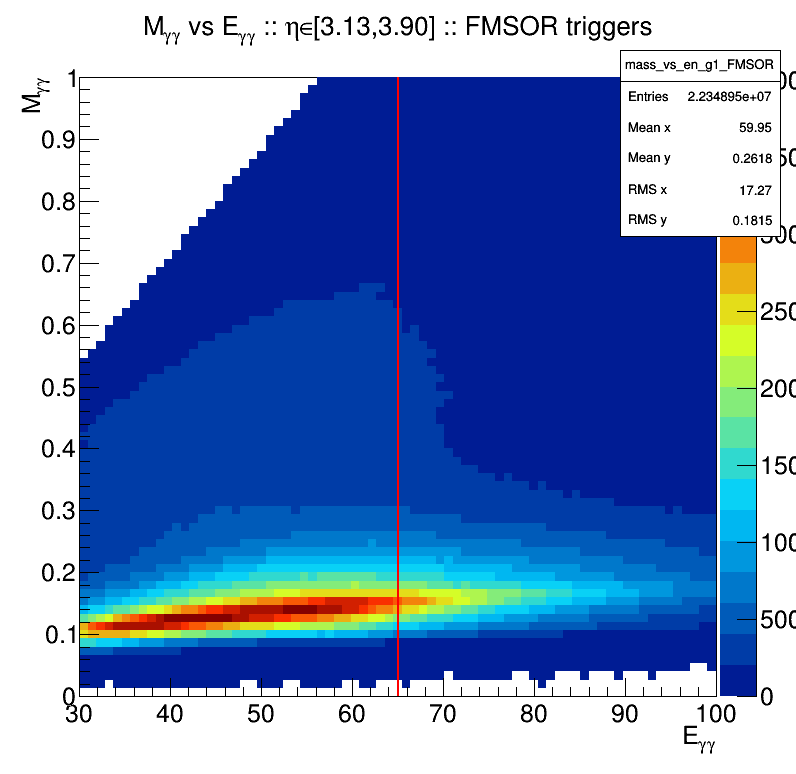
Mass vs E for two eta regions; red line is proposed background analysis bin boundary
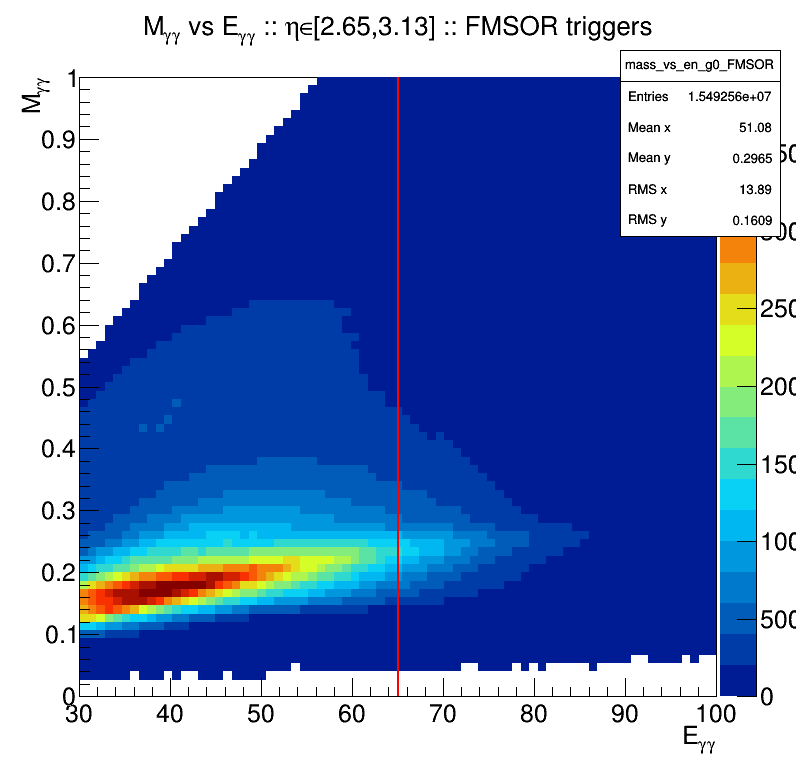
.
.
.
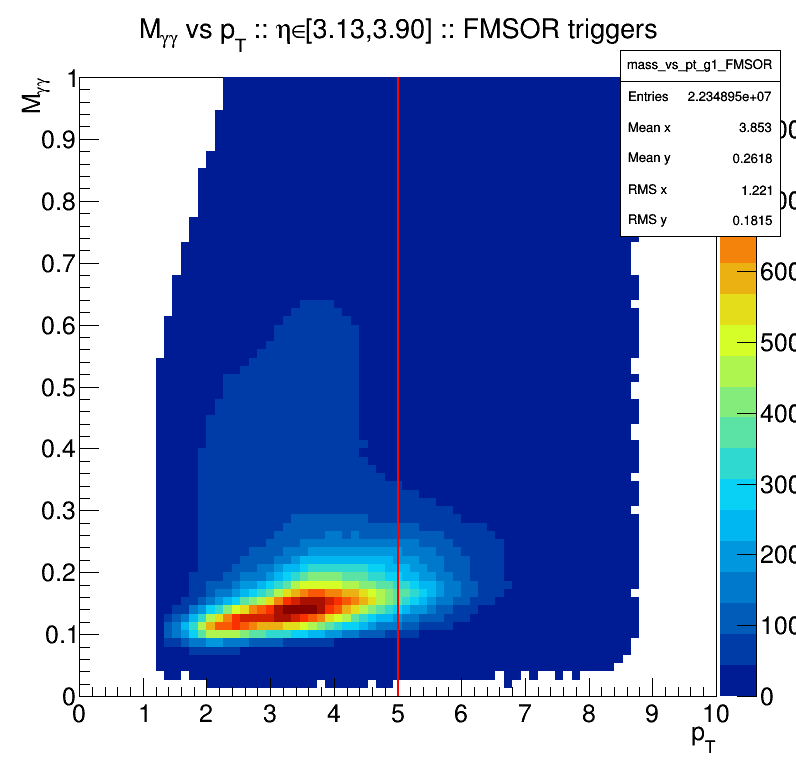
Mass vs pT for two eta regions; red line is proposed background analysis bin boundary

.
.
.
Looking at the large cells, low pT, low E bin, we have the following fit to the mass distribution:
- red points are data
- solid green line is signal
- dashed blue line is background
- black line is full model
- vertical magenta lines denote fit boundaries
- horizontal position of vertical green lines denotes "signal" region, over which F is computed
.png)
- dilks's blog
- Login or register to post comments
