- dilks's home page
- Posts
- 2019
- 2018
- December (1)
- November (1)
- October (1)
- August (2)
- July (4)
- June (3)
- May (1)
- April (2)
- March (2)
- February (1)
- January (5)
- 2017
- December (3)
- November (1)
- October (2)
- September (3)
- August (2)
- July (2)
- June (1)
- May (2)
- March (3)
- February (3)
- January (3)
- 2016
- November (2)
- September (4)
- August (2)
- July (6)
- June (2)
- May (3)
- April (1)
- March (2)
- February (3)
- January (2)
- 2015
- December (3)
- October (3)
- September (2)
- August (6)
- June (3)
- May (3)
- April (4)
- March (3)
- February (5)
- January (3)
- 2014
- December (1)
- November (1)
- October (3)
- September (4)
- August (3)
- July (3)
- June (2)
- May (2)
- April (2)
- March (1)
- 2013
- 2012
- 2011
- My blog
- Post new blog entry
- All blogs
A_LL Polarimetry LUT
PART TWO IS LINKED HERE -- Includes error propagation and luminosity-weighted averaging
-----------------------------------------------------------------------------------------------------------------------------------------------
I've made a run-by-run polarimetry look-up table based on the fill-by-fill results from here:
https://wiki.bnl.gov/rhicspin/Results
I use the RunLog database to obtain start and end times from each run. For each run, I then determine the "middle-of-run" time (halfway between start and end times). I then use the difference of this middle-of-run time and the fill start time from the above-linked polarimetry tables to determine how much time (in seconds) elapsed from the beginning of the fill, which had polarization values of P_0, to the time of the run, which is thought to have polarimetry value of P0+t*P_1, where "t" is this elapsed time (in hours) and "P_1" models the degredation of polarization as a function of time.
There also exist beam current-weighted fill-by-fill mean polarization values, which I had been using previously for A_LL analyses. It has been argued that the P(t) = P_0 + P_1 * t values are preferred. The plots attached below show polarimetry data vs. an internal run index.
Run 12 -- [ BLUE ] . [ YELLOW ]
Run 13 -- [ BLUE ] . [ YELLOW ]
- first plot compares beam current weighted average per-fill polarization in red to P0+t*P1 in blue
- second plot compares luminosity-weighted (FMSJP2) average per-fill polarization in magenta to P0+t*P1 in blue
- thrid plot compares P0 in green to P0+t*P1 in blue
- fourth plot is of P1 in cyan
- fifth plot is the per-run luminosity in blue and the per-fill luminosity in orange
The code which generates these plots as well as rootfiles which contain the LUT in a tree is found at https://github.com/c-dilks/polarLUT
Concerns---------------------------------------------
- RLB's RTS start time is sometimes off by up to a minute or so from the start time obtained from RunLog database via SQL
- are the timestamps between "fill start time" on polarization table and the run's start and stop times in RunLog synchronized?
- negative values of middle-of-run time minus fill start time --> indicates run taken before polarimetry measurement?
- positive values of dP/dT... but the errors are of the same level...
- "cleanup" cut: if P0<1 use average polarization instead (never really happens though)
Impact on A_LL----------------------------------------------------
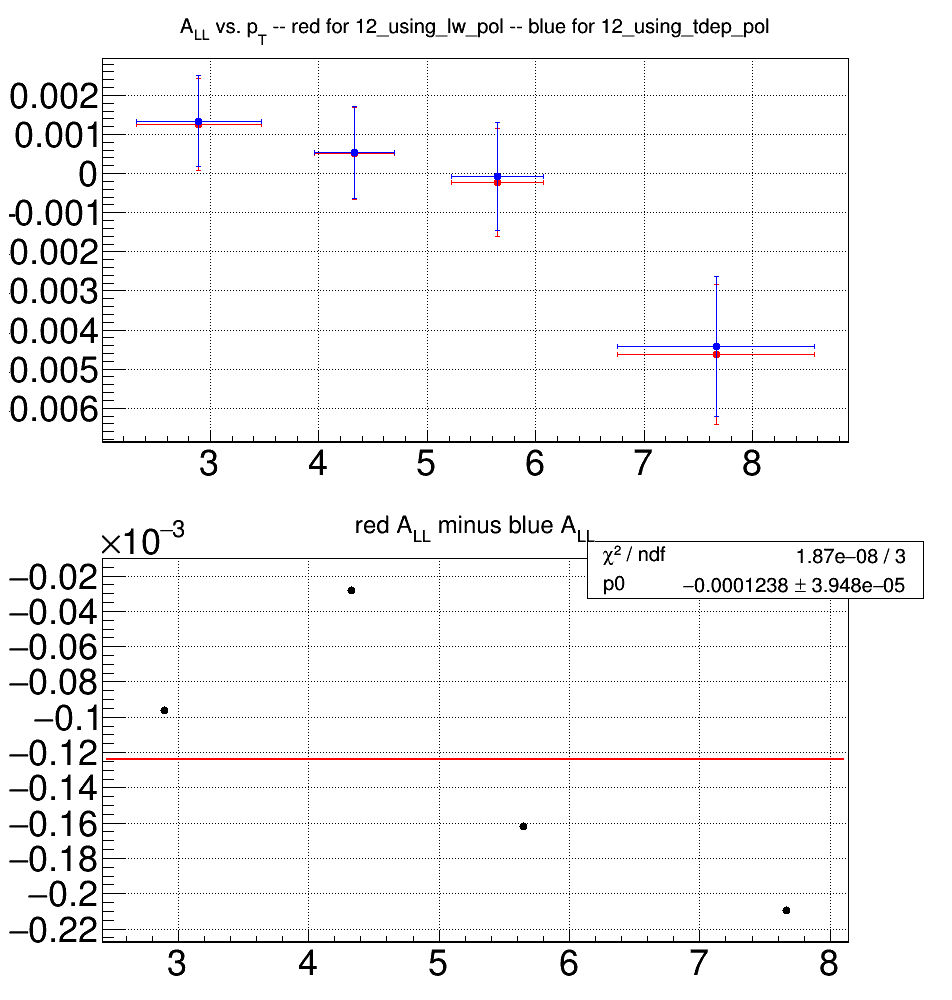
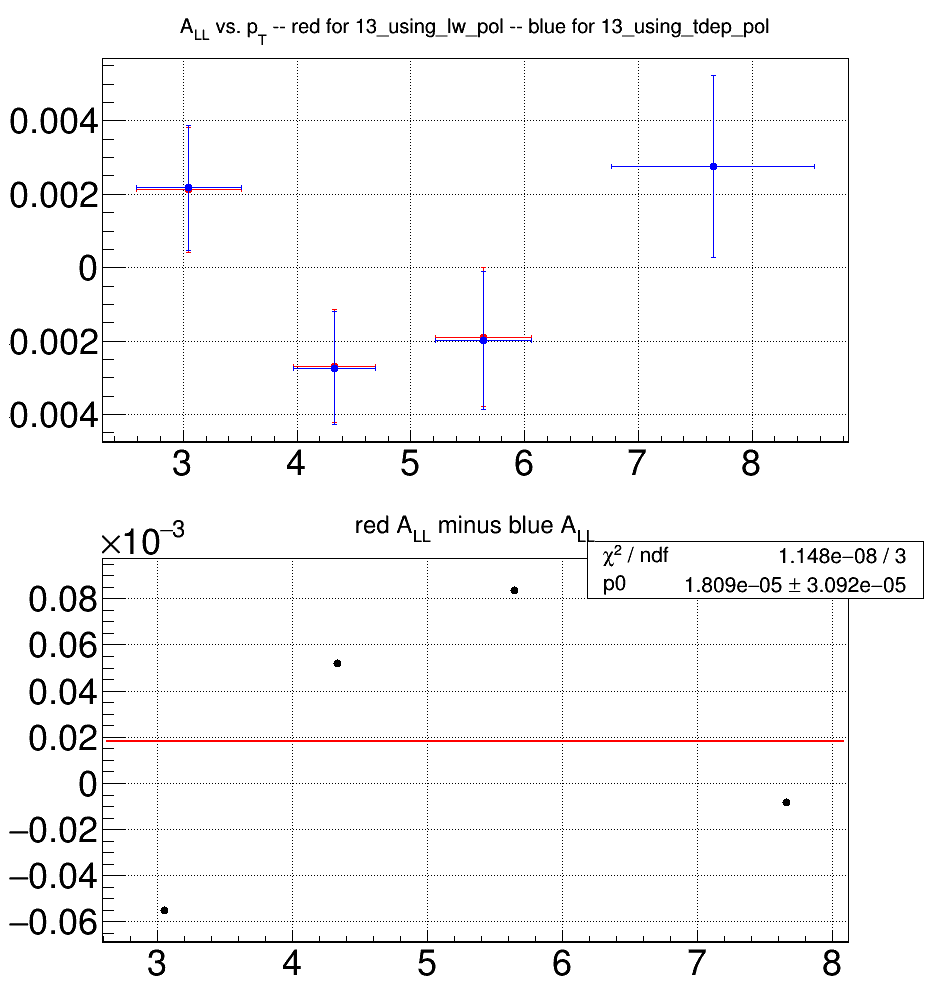
- left is run12, right is run13
- top plot is A_LL vs. pT, full eta range
- red A_LL points are via beam-current-weighted fill averages (previous method)
- blue A_LL points are via run-by-run polarizations (i.e., the blue curves in the aforementioned pol vs. run index plots)
- bottom plots show the difference between the A_LL values for each point along with a constant fit
- difference is at the level of 1.3-2.4e-4


Update: here's a comparison of the per-run polarization A_LL (blue) and the A_LL using the luminosity-weighted average (red)


- dilks's blog
- Login or register to post comments
