- dilks's home page
- Posts
- 2019
- 2018
- December (1)
- November (1)
- October (1)
- August (2)
- July (4)
- June (3)
- May (1)
- April (2)
- March (2)
- February (1)
- January (5)
- 2017
- December (3)
- November (1)
- October (2)
- September (3)
- August (2)
- July (2)
- June (1)
- May (2)
- March (3)
- February (3)
- January (3)
- 2016
- November (2)
- September (4)
- August (2)
- July (6)
- June (2)
- May (3)
- April (1)
- March (2)
- February (3)
- January (2)
- 2015
- December (3)
- October (3)
- September (2)
- August (6)
- June (3)
- May (3)
- April (4)
- March (3)
- February (5)
- January (3)
- 2014
- December (1)
- November (1)
- October (3)
- September (4)
- August (3)
- July (3)
- June (2)
- May (2)
- April (2)
- March (1)
- 2013
- 2012
- 2011
- My blog
- Post new blog entry
- All blogs
E_T Thresholds for Run 12 and 13
pT threshold during runs 12 and 13 was increasing as a function of time, because of radiation damage. For example, see
https://drupal.star.bnl.gov/STAR/system/files/pi0_Pt.pdf
which plots pT vertically vs. run index, for different triggers (n.b. these plots are a bit out of date (lacking "FMSOR" trigger), but the general idea holds)
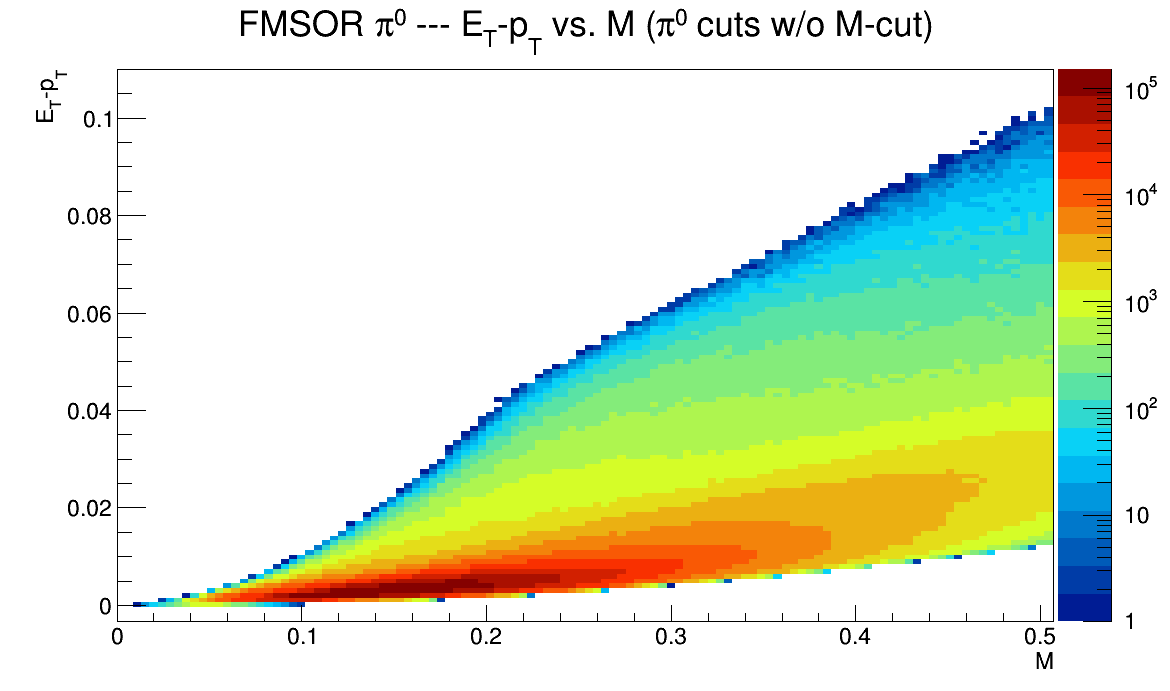
For the paper, we'd like to provide E_T trigger thresholds; but since E_T is a function of pT along with the invariant mass, how can we know what the E_T is at the threshold value?
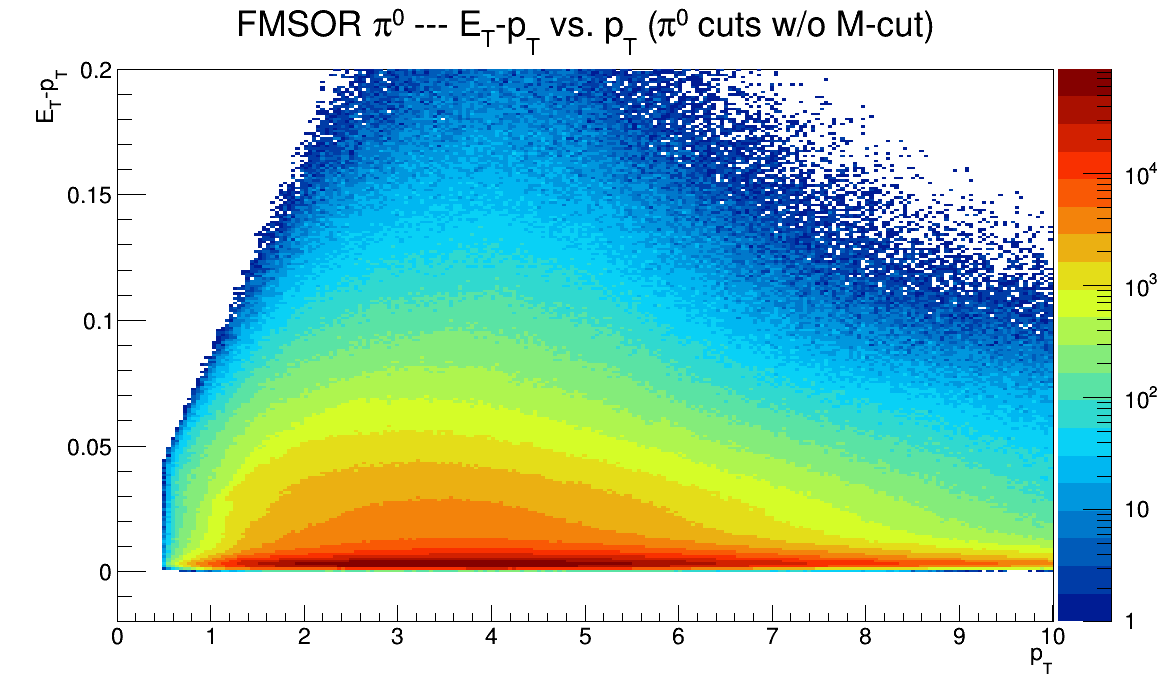
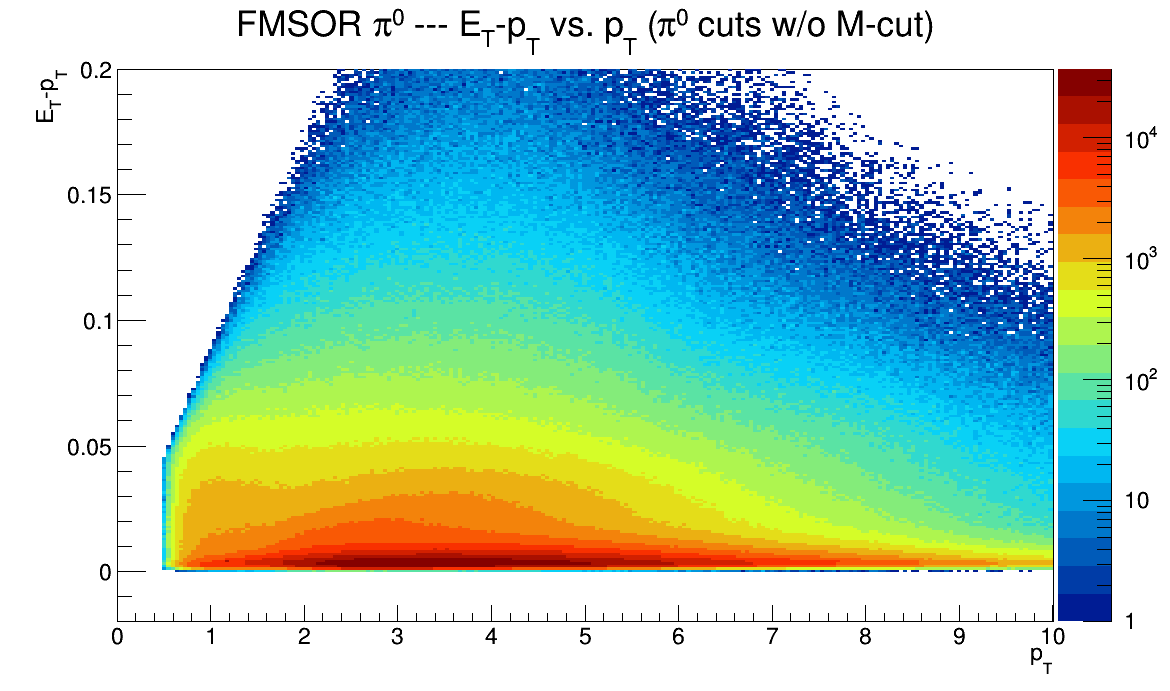
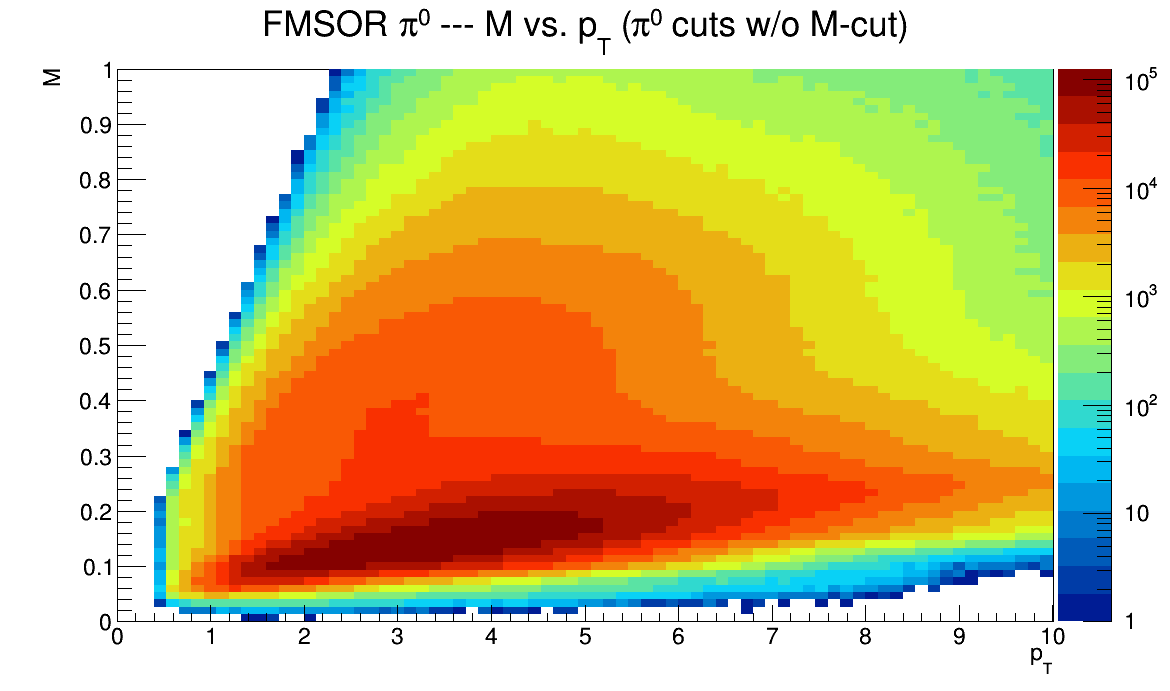
The following characterizes how close E_T is to pT, given the mass resolution
The conclusion is that, given the mass (energy & position) resolution, E_T is within ~20-30 MeV of the associated pT value within the mass and pT region we're interested in
LEFT IS RUN 12, RIGHT IS RUN 13


- dilks's blog
- Login or register to post comments
