- dilks's home page
- Posts
- 2019
- 2018
- December (1)
- November (1)
- October (1)
- August (2)
- July (4)
- June (3)
- May (1)
- April (2)
- March (2)
- February (1)
- January (5)
- 2017
- December (3)
- November (1)
- October (2)
- September (3)
- August (2)
- July (2)
- June (1)
- May (2)
- March (3)
- February (3)
- January (3)
- 2016
- November (2)
- September (4)
- August (2)
- July (6)
- June (2)
- May (3)
- April (1)
- March (2)
- February (3)
- January (2)
- 2015
- December (3)
- October (3)
- September (2)
- August (6)
- June (3)
- May (3)
- April (4)
- March (3)
- February (5)
- January (3)
- 2014
- December (1)
- November (1)
- October (3)
- September (4)
- August (3)
- July (3)
- June (2)
- May (2)
- April (2)
- March (1)
- 2013
- 2012
- 2011
- My blog
- Post new blog entry
- All blogs
SPIN 2014 -- Presentation, Preliminary Plots, Proceedings
[Abstract]
[PRESENTATION] -- most recent version
[PROCEEDINGS] -- most recent version (DOI: https://doi.org/10.1142/S2010194516600247)
[ANALYSIS NOTE] (old version, supplements preliminary results)
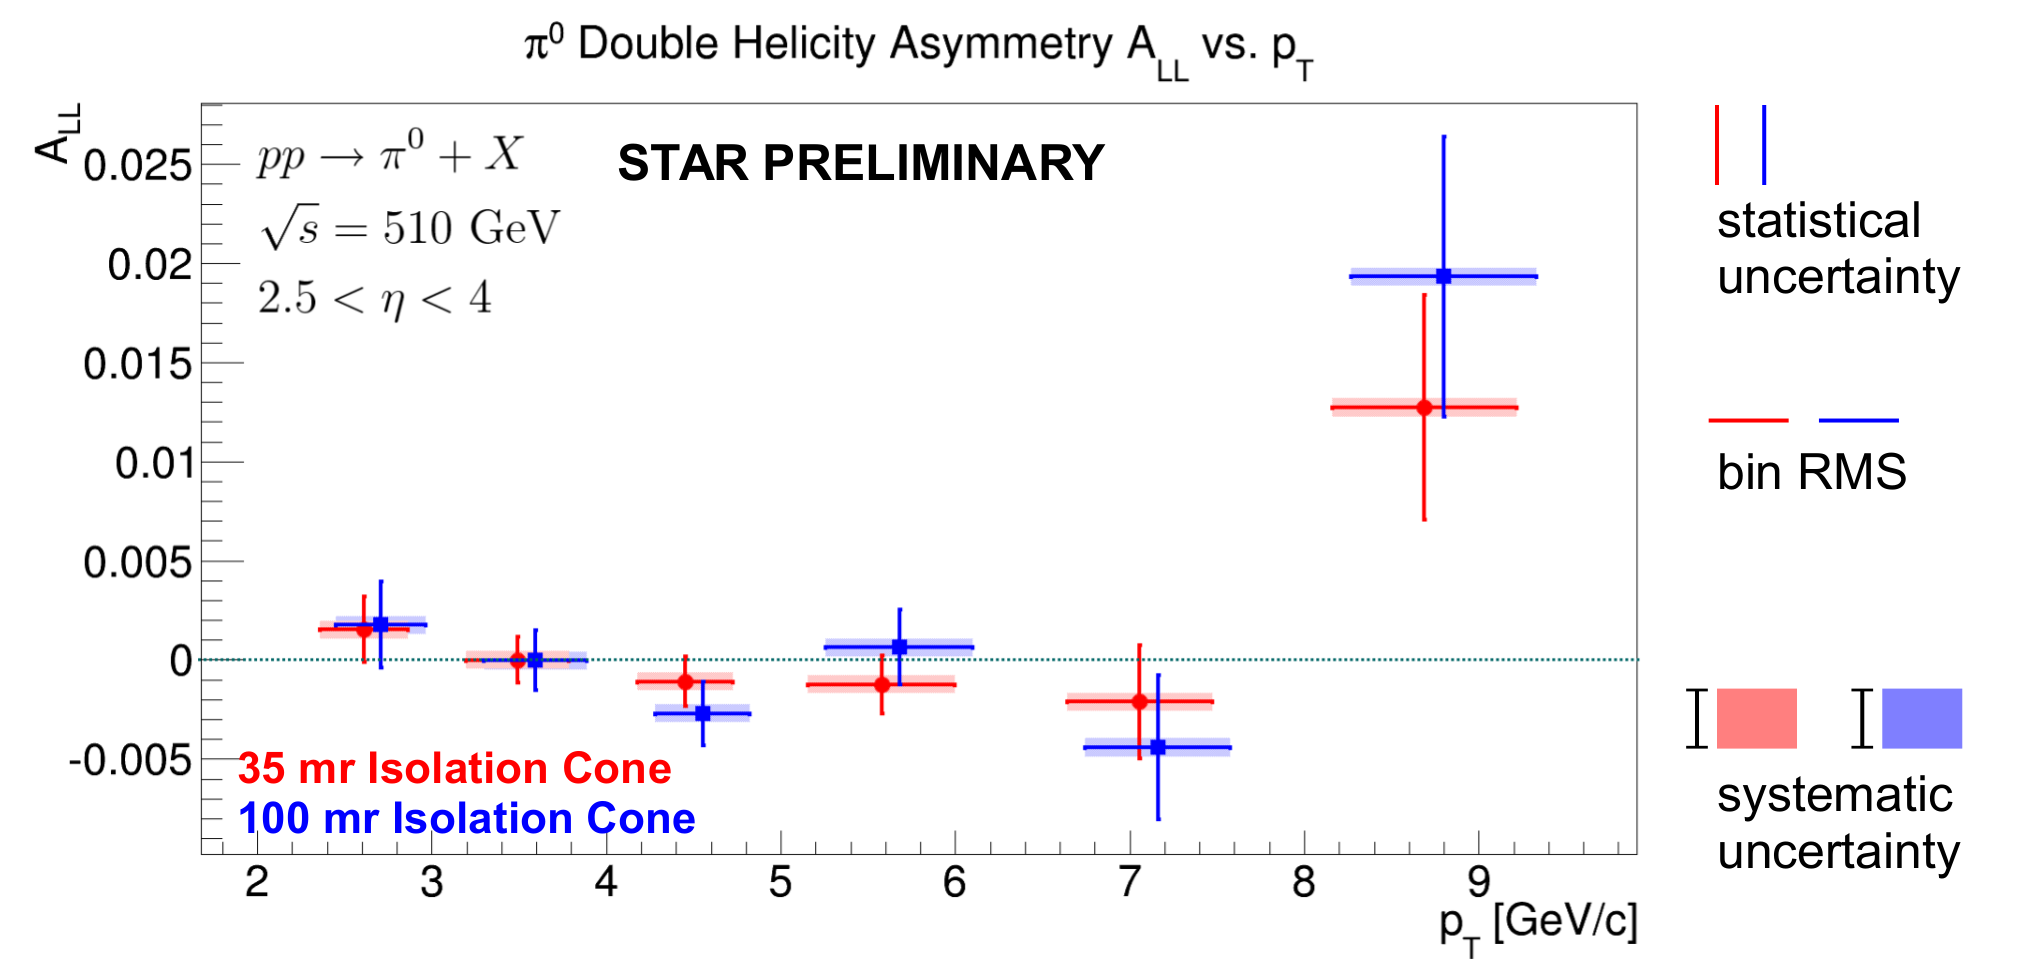
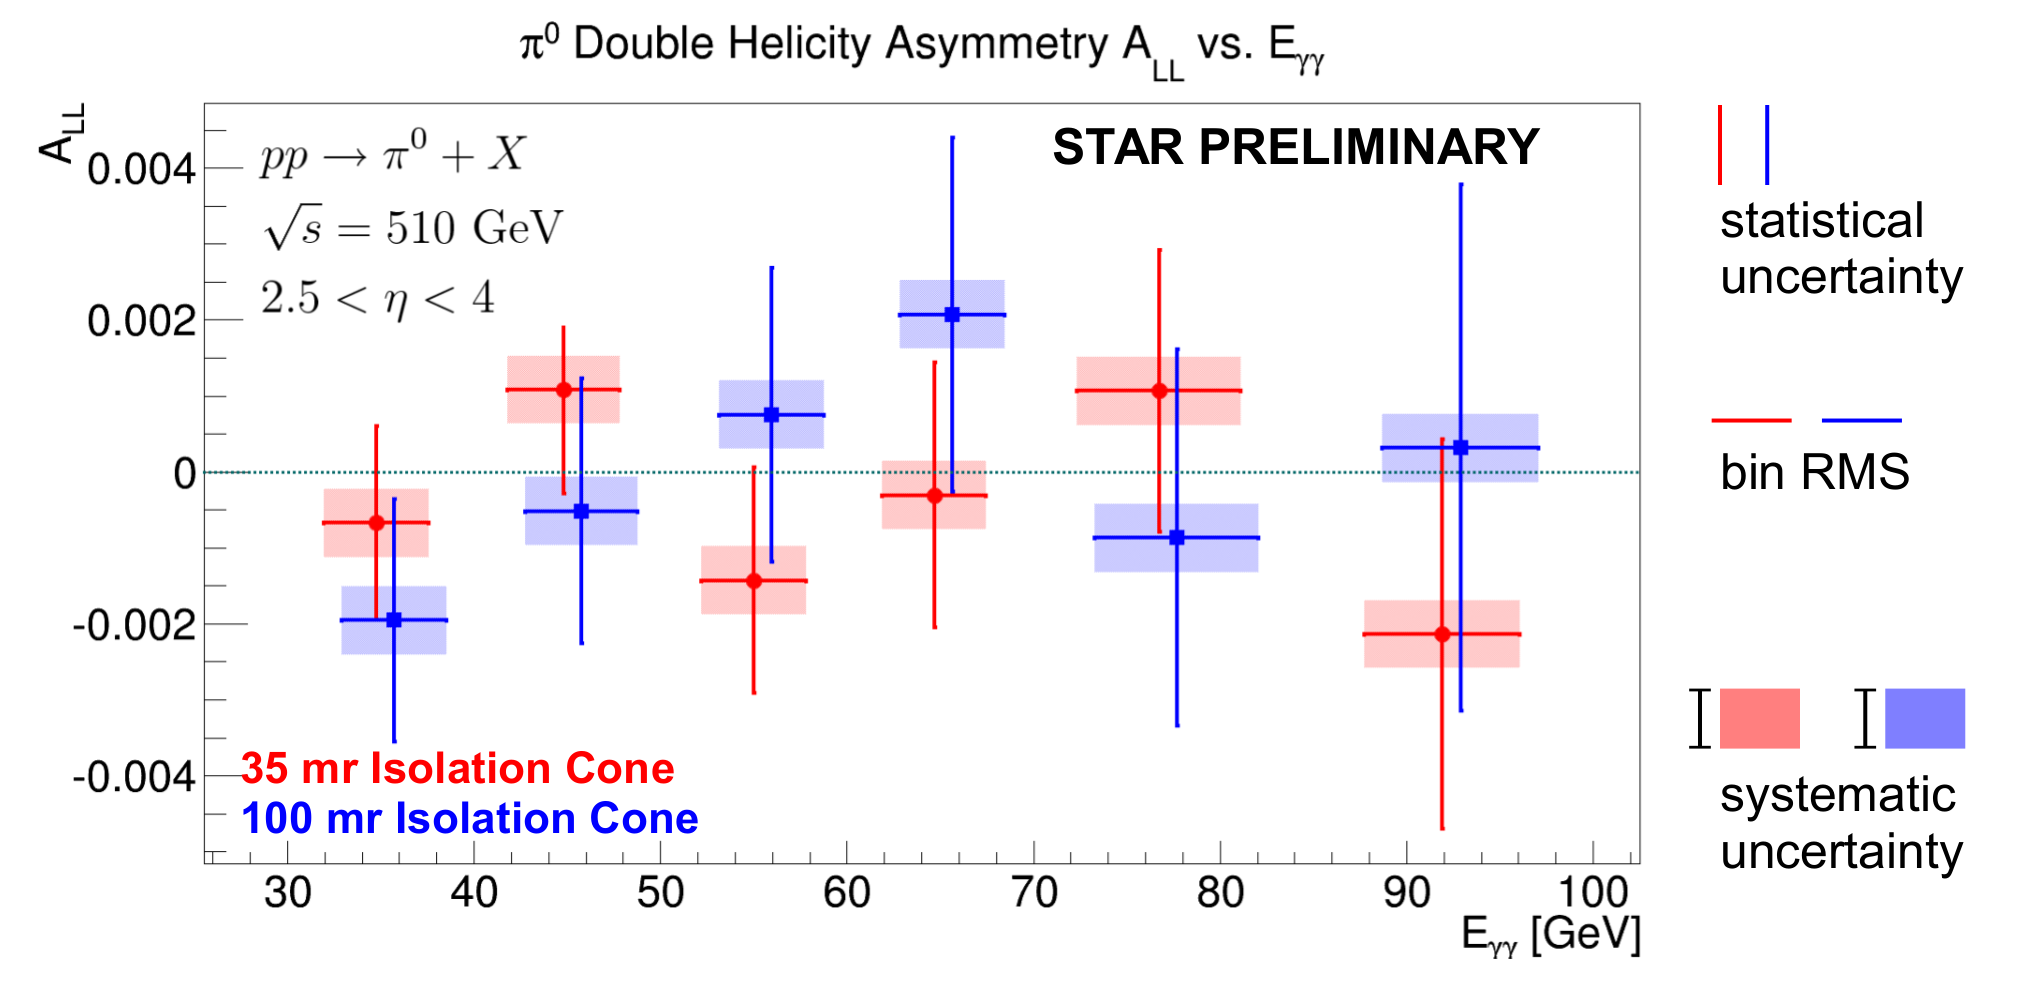
PRELIMINARY PLOTS (see slides for plots with additional labels)
-- red points are for 35 mr
-- blue points are for 100 mr (offset for visibility)
ALL vs. pT plot:

ALL vs. pT data table:
cone_radius pt pt_unc A_LL A_LL_stat_unc A_LL_sys_unc
35 2.613442 0.252807 0.001518 0.001651 0.000443
35 3.491145 0.296326 -0.000004 0.001167 0.000448
35 4.451802 0.272875 -0.001089 0.001238 0.000449
35 5.577280 0.419388 -0.001237 0.001459 0.000449
35 7.057314 0.415243 -0.002120 0.002872 0.000450
35 8.689525 0.527358 0.012728 0.005677 0.000450
100 2.605903 0.257243 0.001764 0.002180 0.000443
100 3.493650 0.295767 -0.000028 0.001520 0.000448
100 4.452603 0.272472 -0.002711 0.001594 0.000449
100 5.579679 0.420275 0.000634 0.001873 0.000449
100 7.060704 0.415983 -0.004417 0.003638 0.000450
100 8.697732 0.530637 0.019318 0.007061 0.000450
ALL vs. E plot:

ALL vs. E data table:
cone_radius en en_unc A_LL A_LL_stat_unc A_LL_sys_unc
35 34.765113 2.807429 -0.000674 0.001272 0.000448
35 44.817847 3.027333 0.001080 0.001366 0.000449
35 55.008706 2.805786 -0.001432 0.001487 0.000449
35 64.677530 2.809599 -0.000306 0.001750 0.000449
35 76.732060 4.397511 0.001063 0.001851 0.000448
35 91.909439 4.179770 -0.002136 0.002566 0.000449
100 34.726149 2.803547 -0.001957 0.001595 0.000448
100 44.773921 3.025419 -0.000517 0.001748 0.000449
100 54.981391 2.802981 0.000752 0.001936 0.000449
100 64.656398 2.808711 0.002071 0.002328 0.000449
100 76.702117 4.395550 -0.000869 0.002482 0.000448
100 91.895715 4.177485 0.000313 0.003466 0.000449
- dilks's blog
- Login or register to post comments
