- dilks's home page
- Posts
- 2019
- 2018
- December (1)
- November (1)
- October (1)
- August (2)
- July (4)
- June (3)
- May (1)
- April (2)
- March (2)
- February (1)
- January (5)
- 2017
- December (3)
- November (1)
- October (2)
- September (3)
- August (2)
- July (2)
- June (1)
- May (2)
- March (3)
- February (3)
- January (3)
- 2016
- November (2)
- September (4)
- August (2)
- July (6)
- June (2)
- May (3)
- April (1)
- March (2)
- February (3)
- January (2)
- 2015
- December (3)
- October (3)
- September (2)
- August (6)
- June (3)
- May (3)
- April (4)
- March (3)
- February (5)
- January (3)
- 2014
- December (1)
- November (1)
- October (3)
- September (4)
- August (3)
- July (3)
- June (2)
- May (2)
- April (2)
- March (1)
- 2013
- 2012
- 2011
- My blog
- Post new blog entry
- All blogs
Wall Current Monitor Data
During a meeting with Elke, we noticed that the problematic region characterized in the previous blog entry is seen in wall current monitor (WCM) data
from the polarimetry group. In short, the first bunch of both blue and yellow beams is low for the fills between 17512-17520
The data accumulated on this page may be found at http://www.phy.bnl.gov/cnipol/rundb/; specifically the number of protons as a function of bunch number.
Note that these data are plotted as a function of bunch number, not STAR bXing number, which is cogged by 40 bunches in the yellow beam.
Also note that for all these data, I'm only using the polarimetry reading at the BEGINNING of the fill, which is denoted 'reading 1' by the polarimetry group
PDF 1 -- No. Protons vs. Bunch No. for each fill
This shows the number of protons vs. bunch number for the four polarimeters
-- Top row is BLUE and bottom row is YELLOW
-- Each page is one fill
-- Problem region starts on page 114 (F17512) and extends to page 121 (F17520); first bunch of each of these is low
PDF 2 -- No. Protons vs. Fill Index for each Bunch Number
-- The colors represent the four polarimeters:
Purple = B2D
Yellow = Y2U
Red = Y1D
-- Each plot is for one bunch number; for bunch number 0 (first plot), a reduction in the number of protons can be seen
around fill index 114-121; this is exactly the aforementioned problem region. From these plots, it's clear that this
problem doesn't persist for any other fills (or bunches), except for a few around fill index 10 (F17345)
-- Yellow bunches 29 & 30 and Blue bunches 69 & 70 show as missing for the first ~1/3 of run time; these missing bunches
overlap at STAR and is well documented
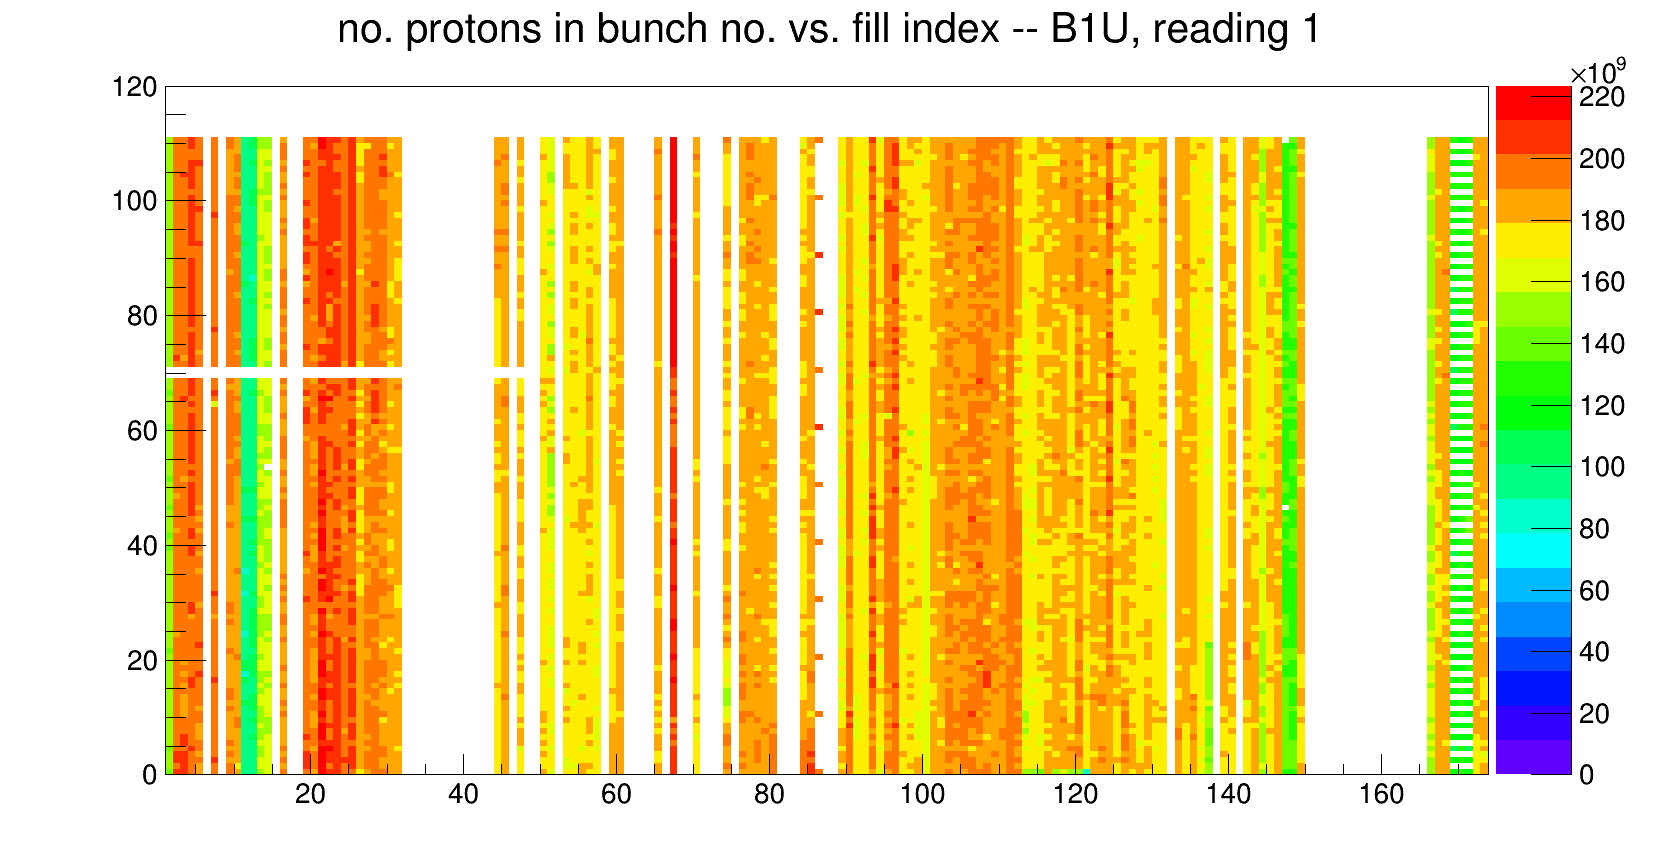
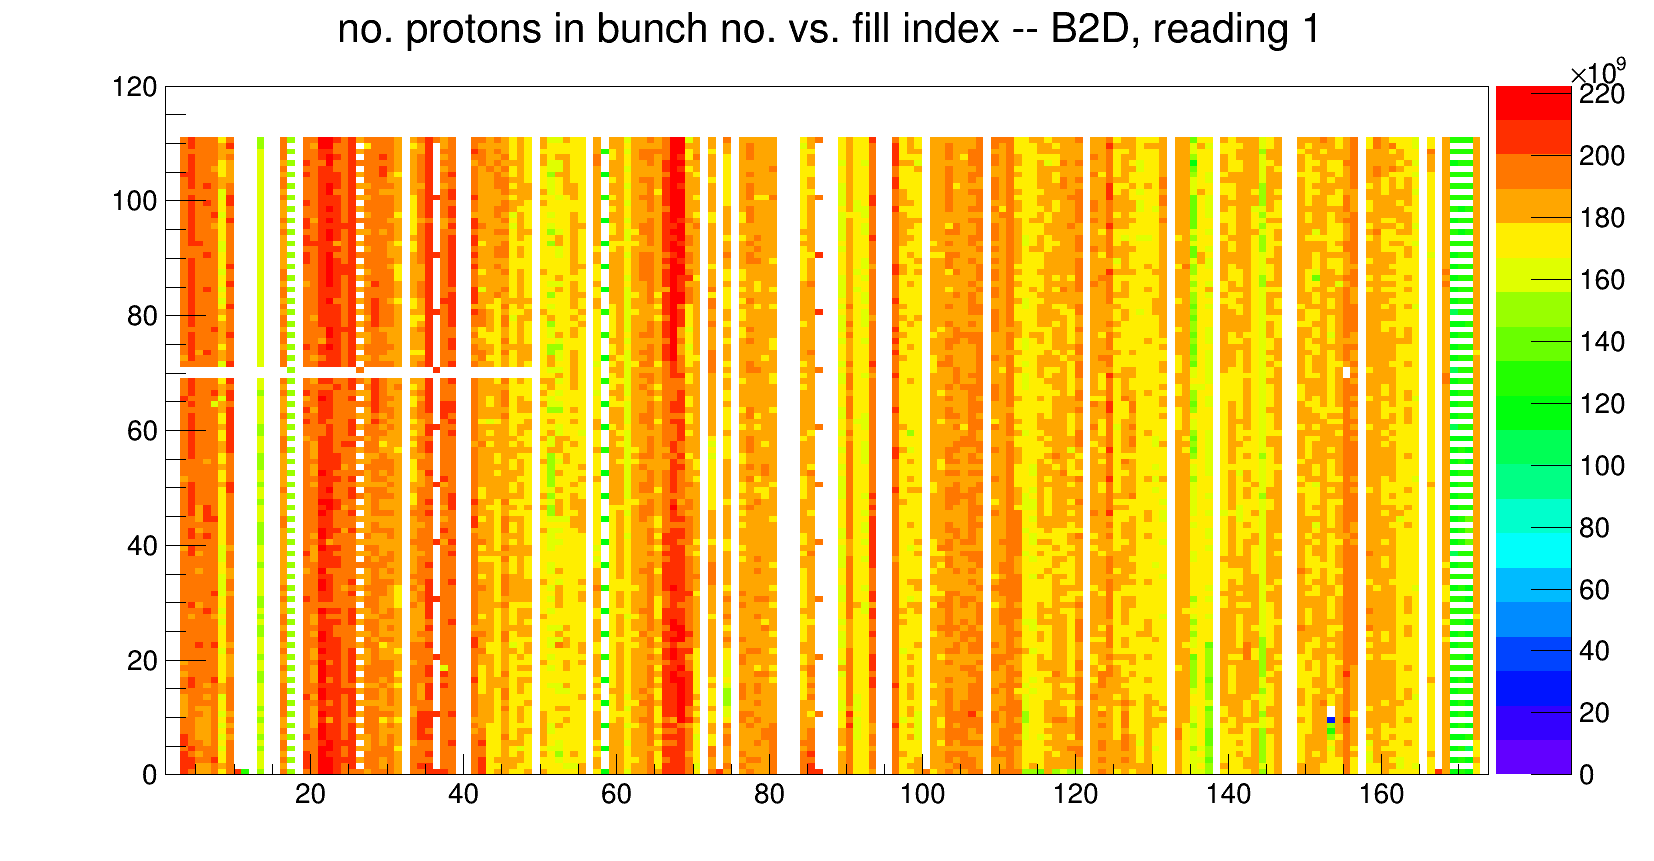
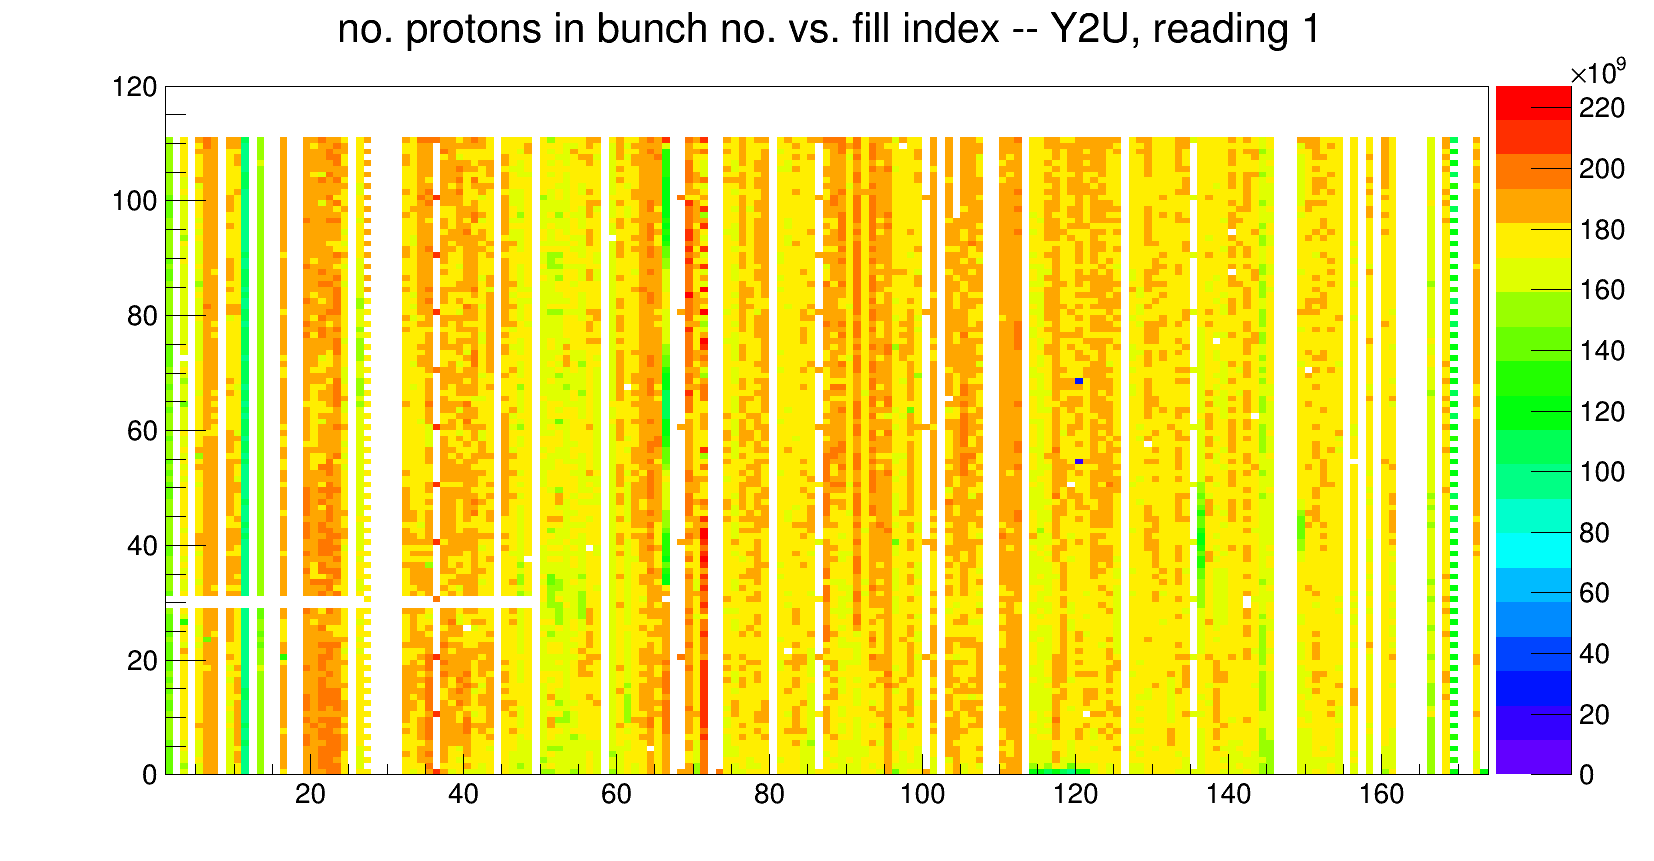
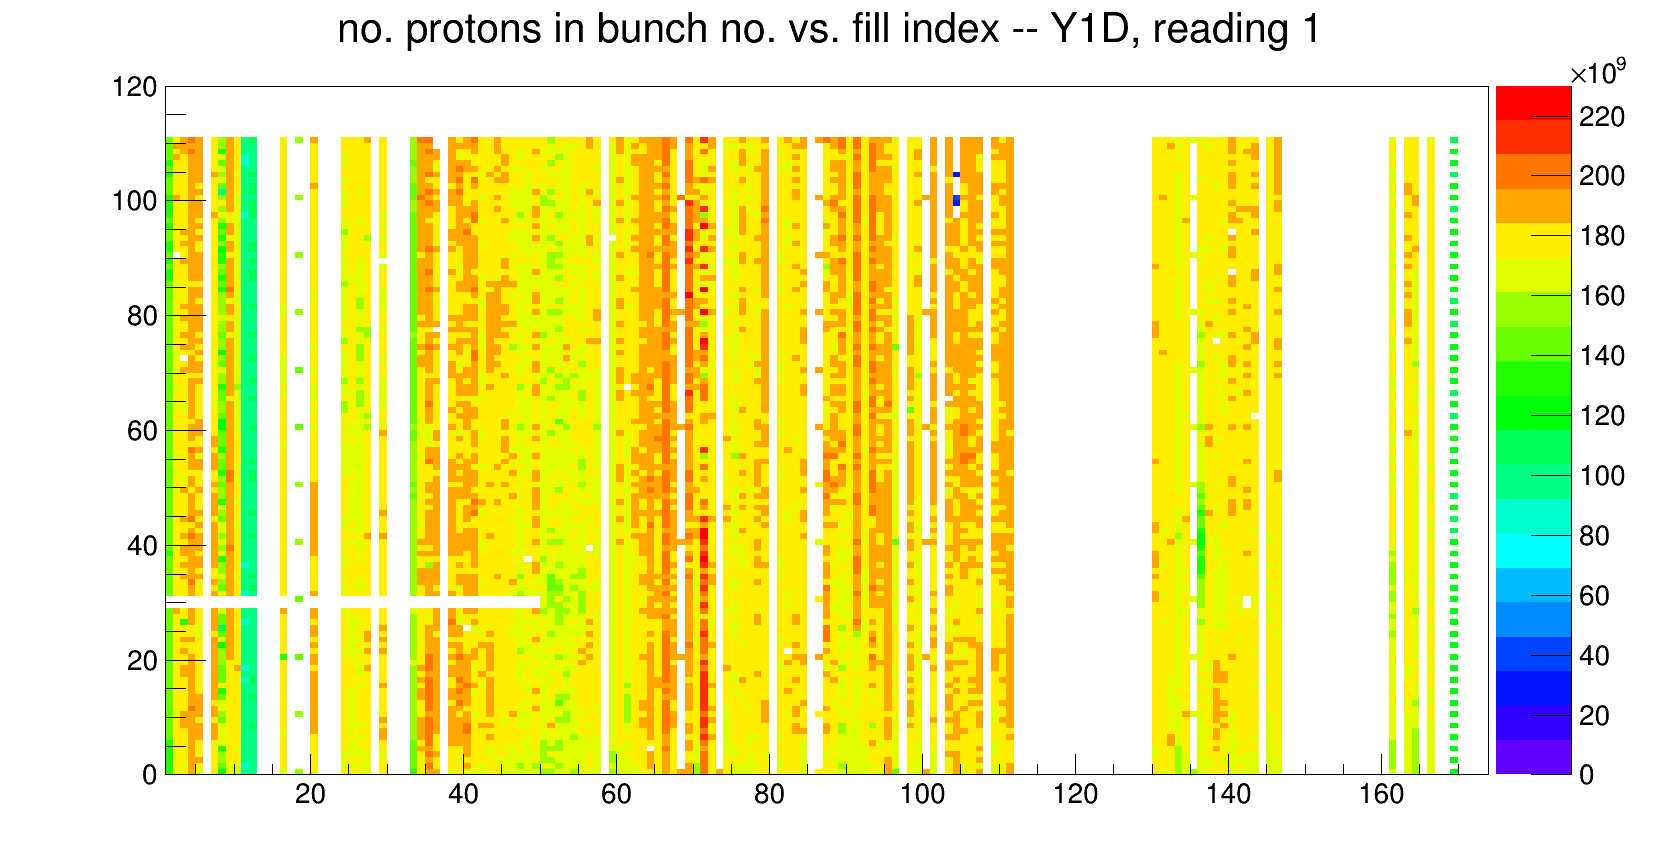
The following four images show the bunch number vs. fill index, with each bin weighted by the number of protons. It's
a 2-dimensional view of PDF 1 above. The first two are for blue beam and the second two are for yellow beam.
Right click --> Open image in new tab for enlarged version
This ROOT file contains these 2d plots and some other plots, for all polarimetry readings


- dilks's blog
- Login or register to post comments
