- dilks's home page
- Posts
- 2019
- 2018
- December (1)
- November (1)
- October (1)
- August (2)
- July (4)
- June (3)
- May (1)
- April (2)
- March (2)
- February (1)
- January (5)
- 2017
- December (3)
- November (1)
- October (2)
- September (3)
- August (2)
- July (2)
- June (1)
- May (2)
- March (3)
- February (3)
- January (3)
- 2016
- November (2)
- September (4)
- August (2)
- July (6)
- June (2)
- May (3)
- April (1)
- March (2)
- February (3)
- January (2)
- 2015
- December (3)
- October (3)
- September (2)
- August (6)
- June (3)
- May (3)
- April (4)
- March (3)
- February (5)
- January (3)
- 2014
- December (1)
- November (1)
- October (3)
- September (4)
- August (3)
- July (3)
- June (2)
- May (2)
- April (2)
- March (1)
- 2013
- 2012
- 2011
- My blog
- Post new blog entry
- All blogs
Problematic Run Region in Run13
The previous blog entry, https://drupal.star.bnl.gov/STAR/blog/dilks/all-binned-run-regions, has highlighted a region of runs during which the A_LL measurements are inconsistent with
A_LL measured from outside this region; moreover, single spin asymmetries are nonzero in this region. This blog entry aims to characterize features in this region that make it
unique when compared to all other runs considered for analysis.
This region is very easily noticeable if we consider a 2d distribution of bXing vs. run index with each bin weighted by the multiples+accidentals scaler rates.
I am using ZDC coincidence rates here (note that the z-axis scale runs from 600-2800 Hz since a digit was cropped; click the image to enlarge)
The black vertical lines separate temporally adjacent fills

Plots were also made for the BBCX and VPDX, linked below. The region is clearly visible for both of these, and the singles scaler bit combinations
also highlight this region
also highlight this region
The region of interest therefore is:
| Run Number | Run Index | Fill Number | Fill Index | |
| First Run | 14136002 | 549 | 17512 | 52 |
| Last Run | 14139001 | 649 | 17520 | 59 |
Some of the relative luminosities highlight this region as well, namely R1 and R2; others are listed here for reference
- these are rellum means over {E,W,X} for each of the three detecters BBC, ZDC, and VPD
- empty bunches were removed from rellum calculation as well as the first two bXings coming out of abort gaps for problem region
(R1) (R2) (R3) (R4) (R5) (R6) (R7) (R8) (R9) (rellum definitions) (link to scalers page)
The correction factor, which is defined as (multiples+accidentals corrected scalers) / (raw scalers) shows some disagreement between the four spin bits (colored, with legend in title)
for one fill in the problematic region and for another fill a few beyond it. This is true for the ZDC and VPD; the BBC shows poor agreement
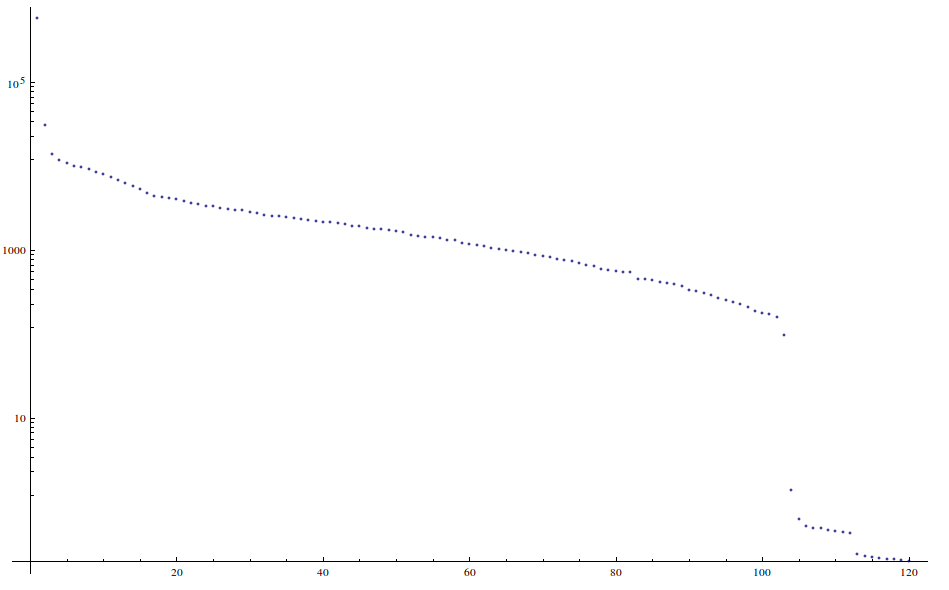
For the above matrix that plots the scaler rate vs. bXing and run index, I used Mathematica to evaluate a singular value decomposition. This can potentially be used to highlight any other interesting artifacts
in the run-by-run bXing distributions.
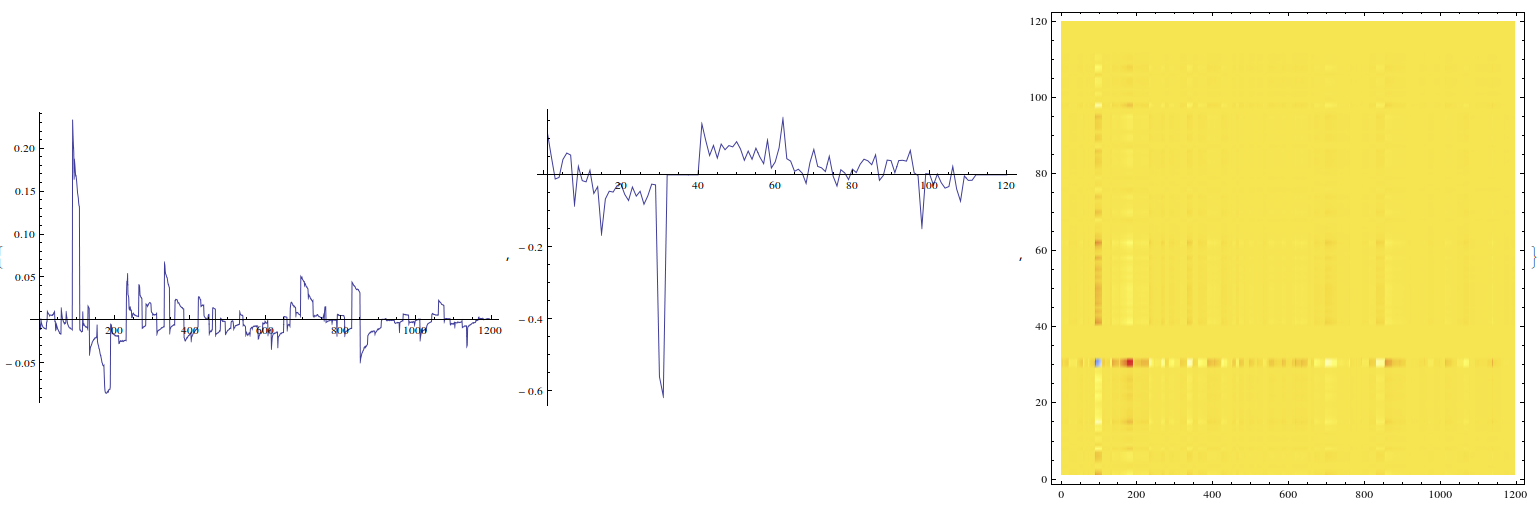
The singular value decomposition takes the original matrix and writes it as a weighted sum of outer products of "singular vectors". The weights are called "singular values," and for each singular value, there
is one run-space singular vector and one bXing-space singular vector. Features given by structure in the run singular vector can be correlated to features in the bXing singular vector. Thus one may use this
technique to search for additional structure in the run space of the problematic region, which may correlate to structure in the respective bXing distrbutions.
This image shows the singular values sorted highest-to-lowest on a logarithmic scale; there are 120 singular values since 120 is the lesser of the dimensions of the input matrix (120 x 1196)
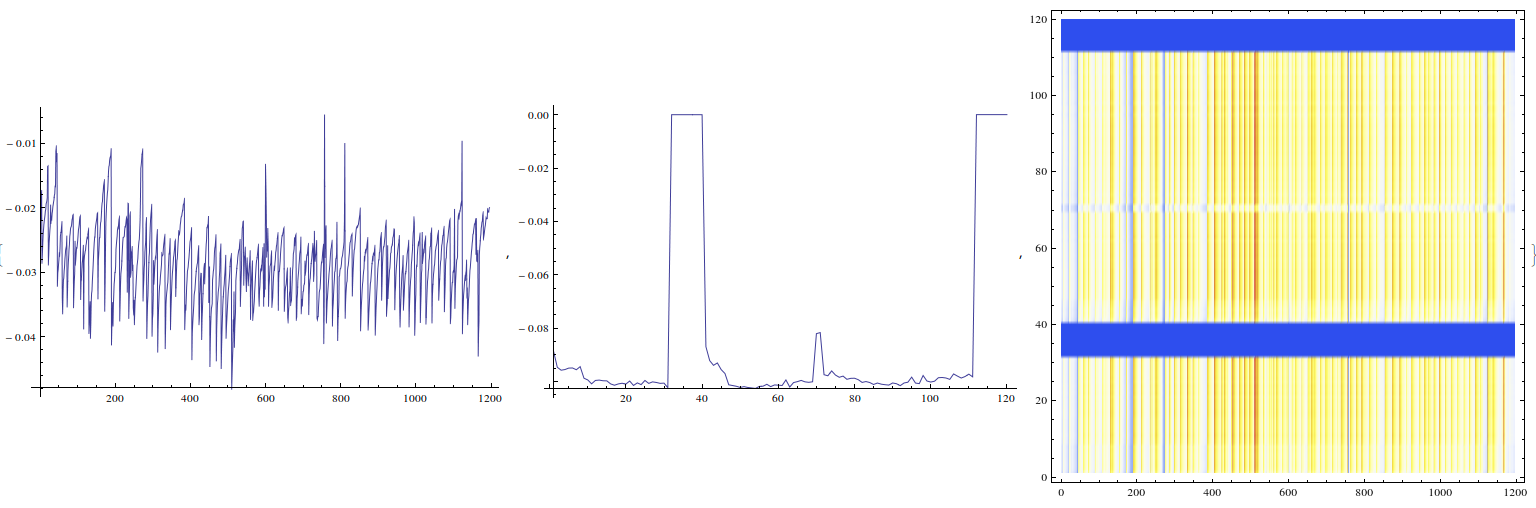
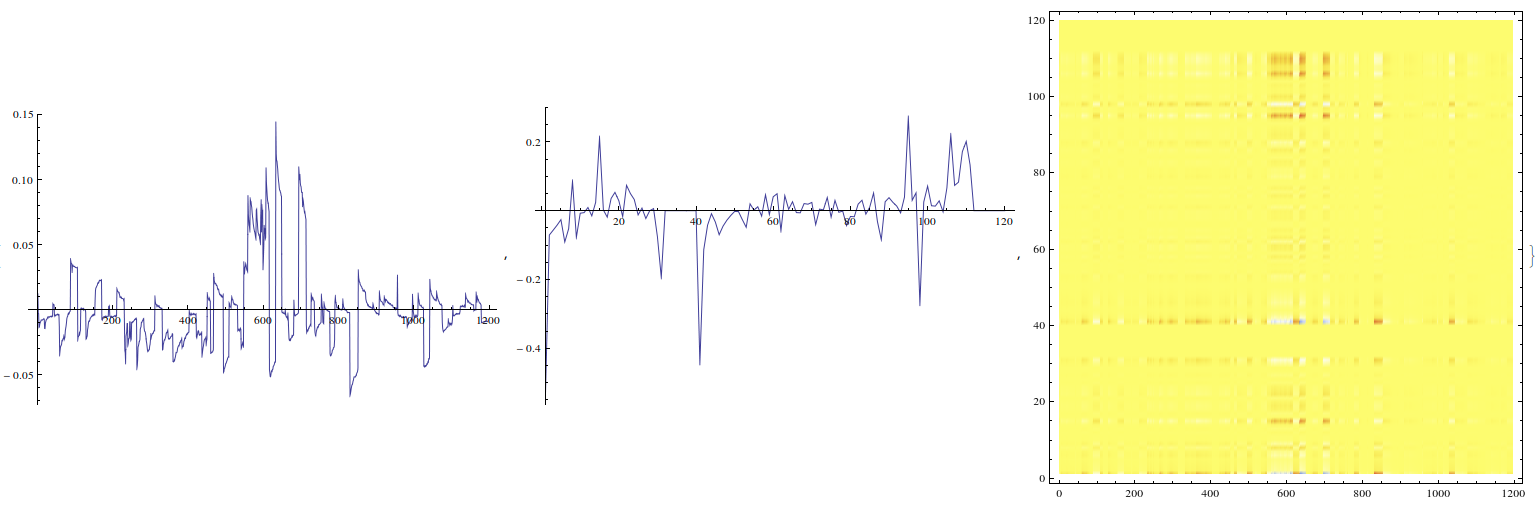
The next 5 rows of images show 3 images each; the first two are the row space and bXing space singular vectors and the third is their outer product.
These are for the first 5 singular values in decreasing order.
singular val 1 highlights abort gaps and the 2 missing bunches present in the first ~230 runs
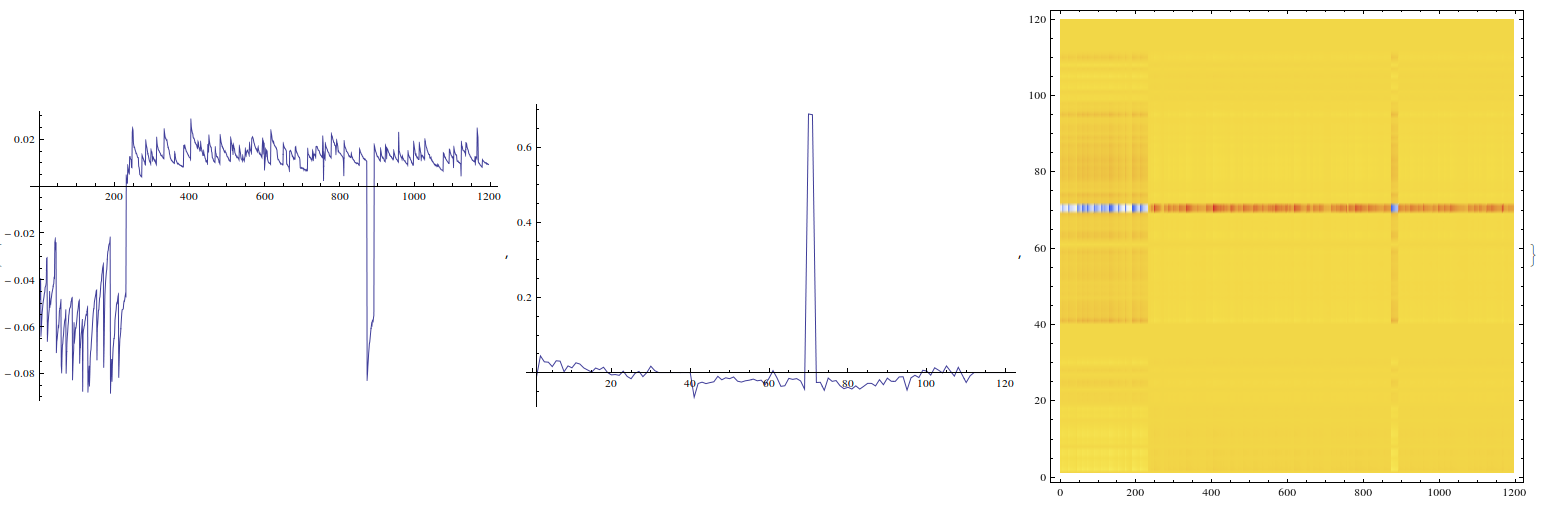
singular val 2 highlights those two missing bunches at bXing ~70
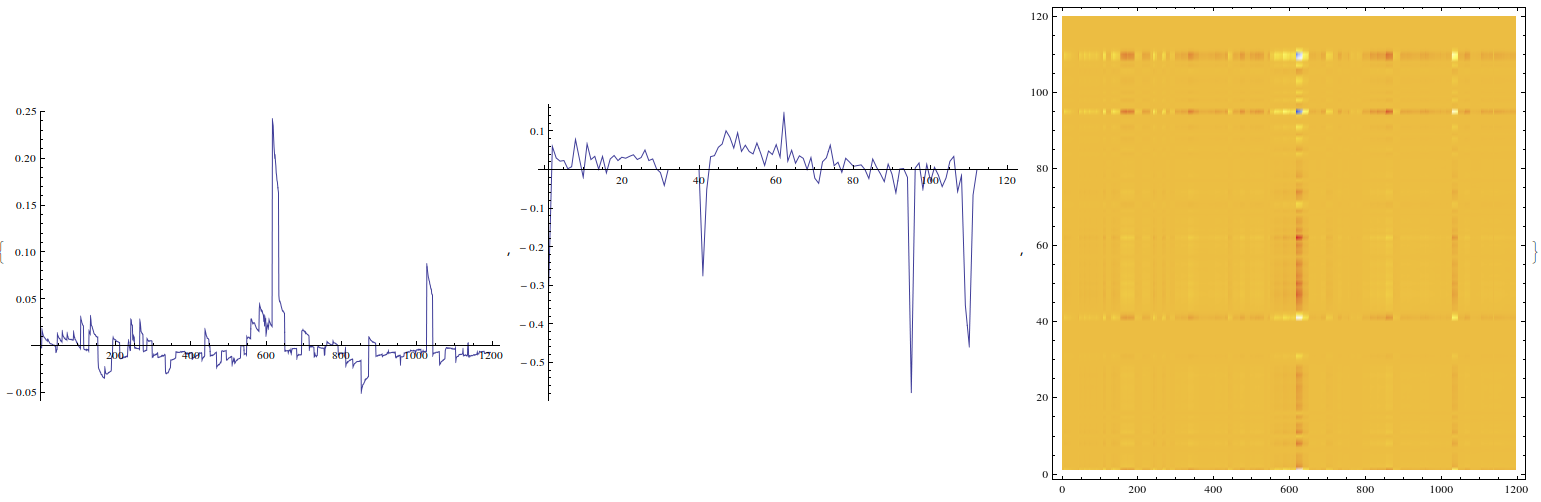
singular val 3 highlights a couple of empty bunches (many of the singular vectors do this...)
singular val 4 also highlights a couple of missing bunches before the abort gap
singular val 5 highlights the problem region, specifically for bXings coming out of the abort gap as well as some bXings above bXing 90
 .
.
After pulsing effects
If we look at the overall, summed bXing distributions, we see evidence of afterpulsing. This is seen in both the ZDC and VPD (BBC is not considered for analysis)
(ZDC afterpulsing) (VPD afterpulsing)
I am worried that this afterpulsing effect might be introducing a bias in the relative luminosity computation. For example, if a (++) bXing afterpulses and adds a count into a (+-) bXing, we may start to see a bias in R3.
I have been trying to write an algorithm to simulate the afterpulsing effect in order to understand it better, but it is still in the planning stage.
In order to study the effect, which is clearly correlated among the BBC, ZDC, and VPD, the algorithm will need to assume a pulse-height distribution as well as the shape of the after-pulsing (ringing? frequency?)
Groups:
- dilks's blog
- Login or register to post comments