Update [01.09.2020] -- Unfolding Run 9 pp Data Using Response Matrices Made With Different DCA Cuts
Following up on the previous post:
https://drupal.star.bnl.gov/STAR/blog/dmawxc/update-01022020-track-pt-run-9-pp-data-and-embedding
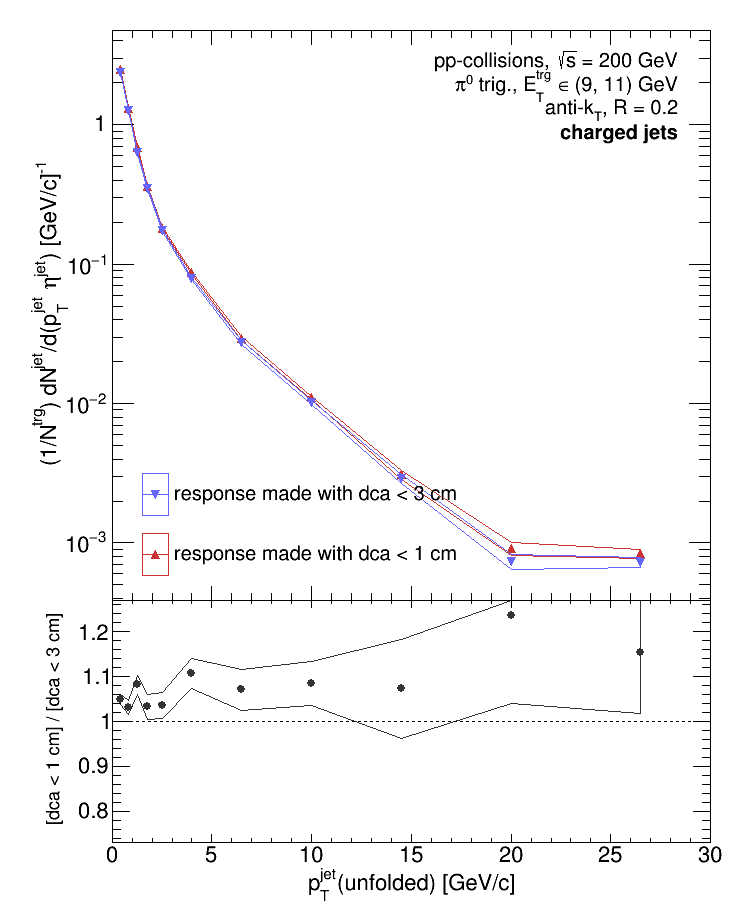
I tried to assess the systematic uncertainty due to secondary vertex feed-down by comparing the track pT distributions in the Run 9 dijet embedding sample using different DCA cuts (1 cm vs. 3 cm). So to further investigate, I created two response matrices and jet-matching efficiencies: one where the reconstructed (detector-level) jets were made from tracks with DCA < 1 cm, and another where the reconstructed (detector-level) jets were made from tracks with DCA < 3 cm. In both cases, the particle-level jets were the same. Then, I used each response matrix and jet-matching efficiency to unfold our 9 - 11 GeV pi0-triggered Run 9 pp data. The two unfolded distributions are compared below.

Reassuringly, the difference between the two is at most ~10% within our kinematic range (0 - 20 GeV/c). Is this a good assessment of this uncertainty? After some discussion with collaborators, I'll follow up on this shortly...
- dmawxc's blog
- Login or register to post comments
