Update 01.31.2018 -- Run 9 pp: Underlying Event Study
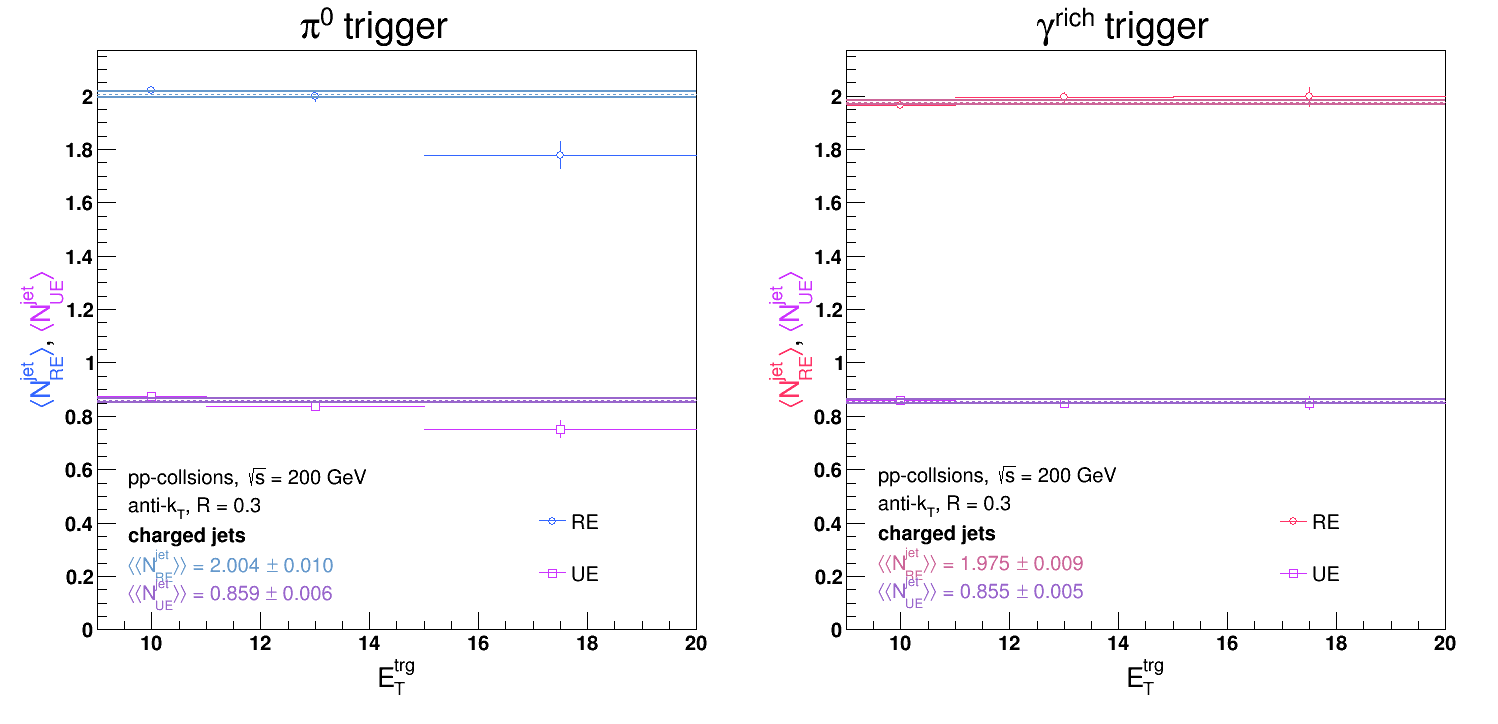
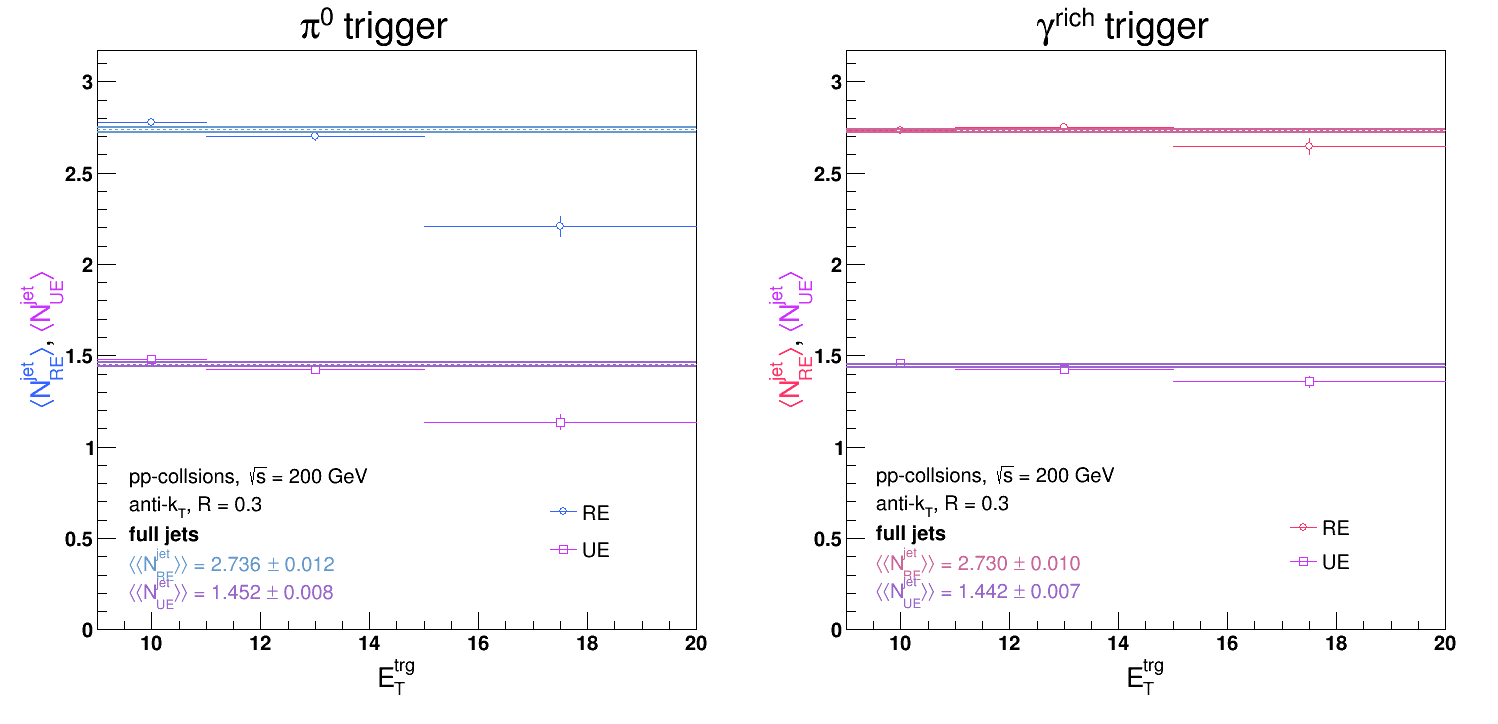
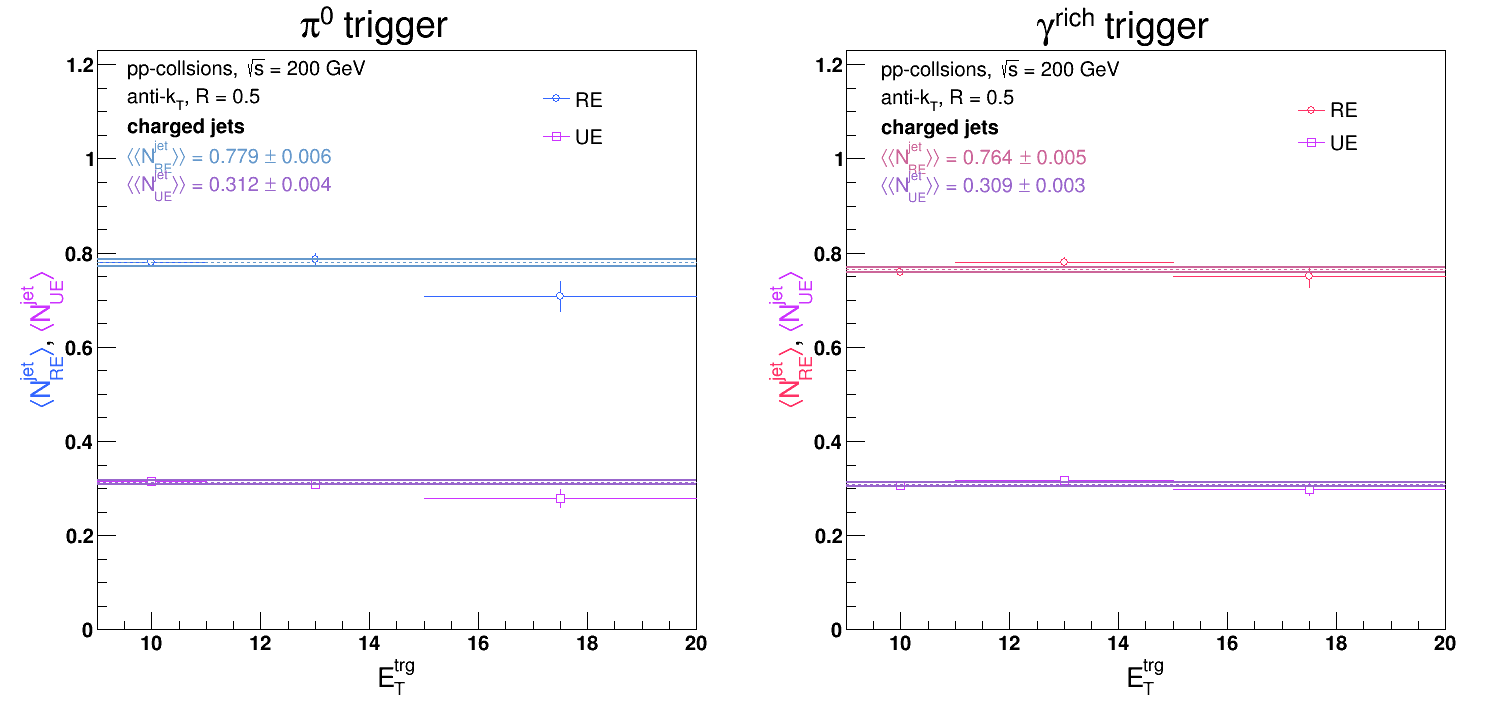
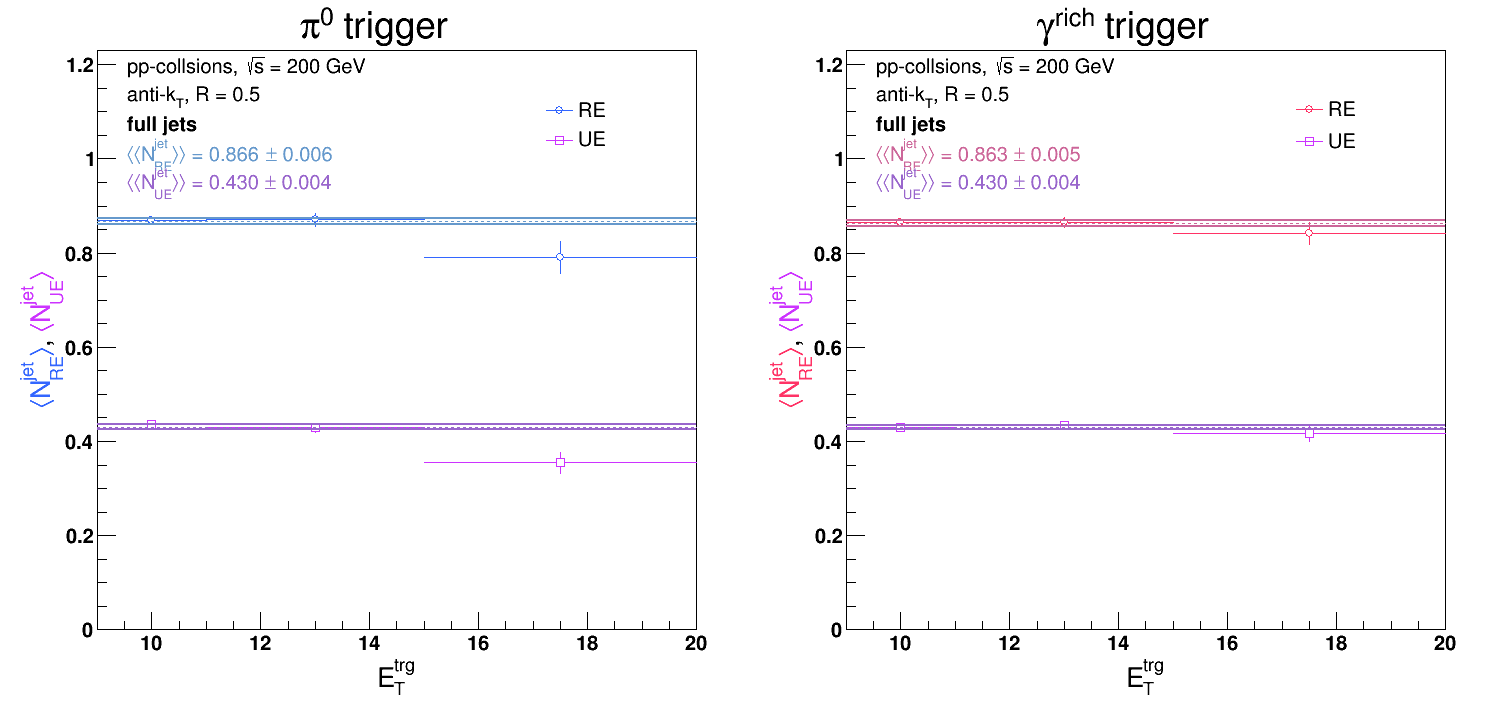
An open question with regards to the "Uncorrelated Jets" method of approximating the underlying event is how to normalize the uncorrelated jet distribution (if at all). To look further in this, I've put together some plots detailing the average number of recoil jets vs. the average number of uncorrelated jets in pp. The delta-phi regions UE[0], UE[1], and UE[2] are defined in the same way at this post:
https://drupal.star.bnl.gov/STAR/blog/dmawxc/update-01232018-run-9-pp-underlying-event-study
Likewise, 'RE' stands for recoil. The double-brackets indicate an average over trigger energy as well as an average over the ensemble of events. The UE averages presented below are for jets in the region UE[0]. The corresponding delta-phi and nJet distributions are attached.


Note: the statistical errors on the quoted average numbers of UE jets in the attached plots are typos. My macro accidentally used the average value rather than the error when making the labels. The actual errors are on the order of ~0.001.
- dmawxc's blog
- Login or register to post comments
