Estimation on Optimizing Store Length in Run 10 7.7 GeV
Date 4/25/2010.
During low energy runs, the store length is significantly reduced compared to high energy runs due to poor lifetime. In this study, I want to give an estimation on how long the store length will be to maximize the luminosity taken at STAR.
I took three stores taken in the afternoon on 4/25/2010, and I used the BBCE*W and VPDE*W respectively as the quantity for luminosity estimation. Fig. 1 shows the BBCE*W and VPDE*W rate in this period from the richScalar database.
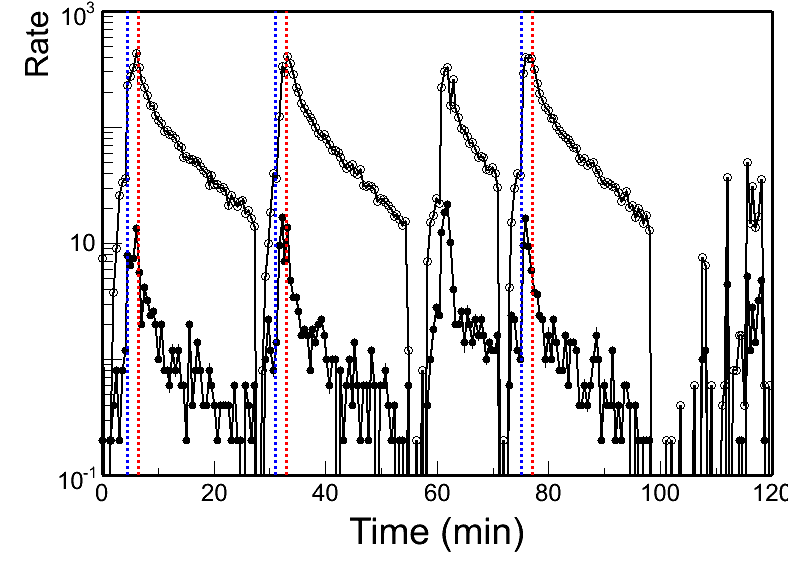
Fig. 1: BBCE*W (open) and VPDE*W (solid) rate vs time from 1pm to 3pm (EDT) on 4/25/2010. Red dashed lines indicate the time when CAD turned physics ON, and the blue lines indicate our DAQ starting time (about 2 mins before physics ON).
VPDE*W and BBCE*W have some correlation, but not fully. Fig. 2 shows the rate between these two vs time. One can see the ratio of VPDE*W/BBCE*W is about 0.1-0.2 in the begining of fill and then drops to ~0.2 five mins after the peak.
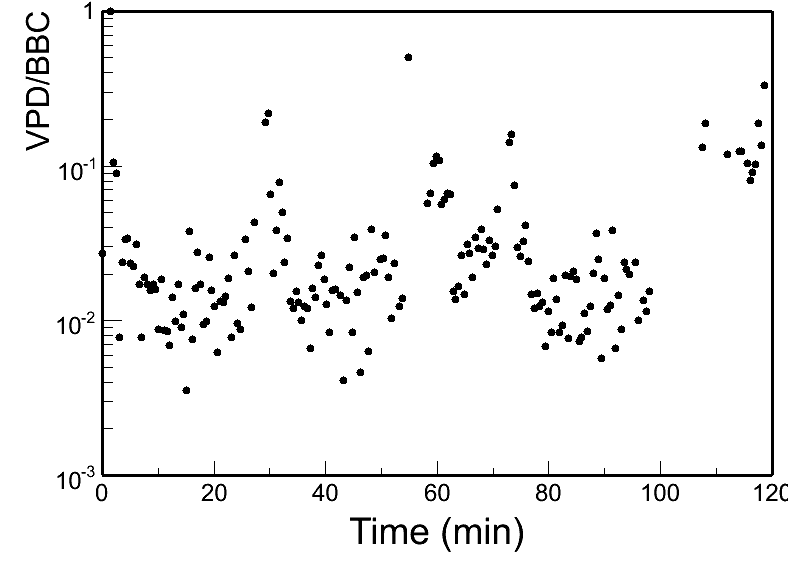
Fig. 2, VPDE*W/BBCE*W ratio vs time.
I took these scalar rates for the relative luminosity calculation in this optimization respectively. Fig. 3 shows the integrated luminosity fraction (normalized to the total in each store) for three stores respectively as time moves in the store. The starting points are just arbitrarily moved together for three store just for comparison.
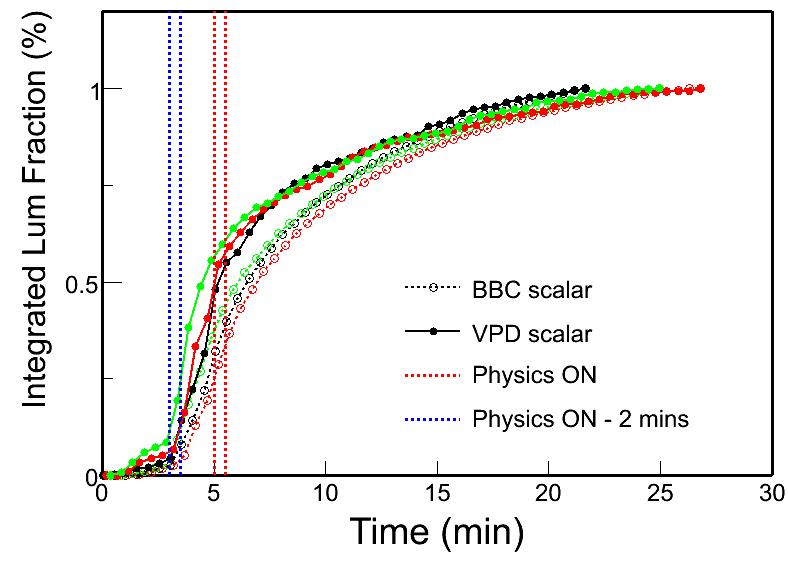
Fig. 3 Integrated luminosity fraction vs time with different scalars used for 3 stores taken on 4/20/2010 from 1pm-3pm.
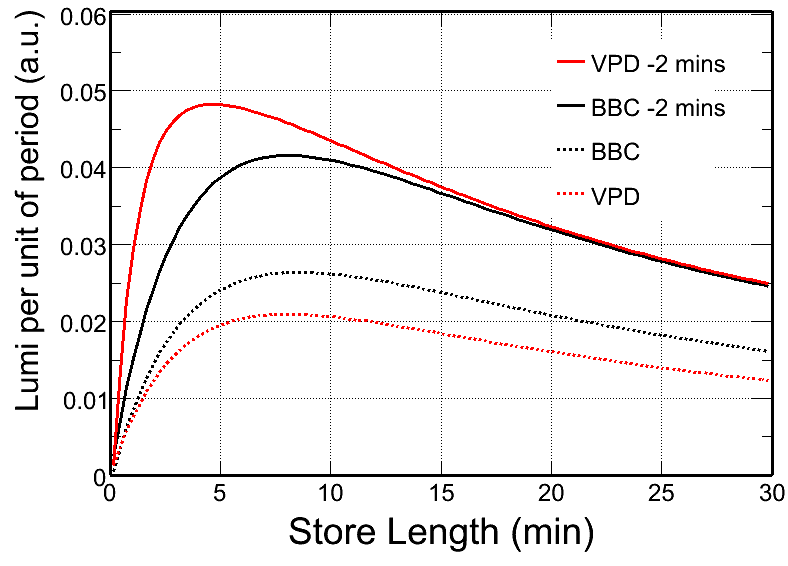
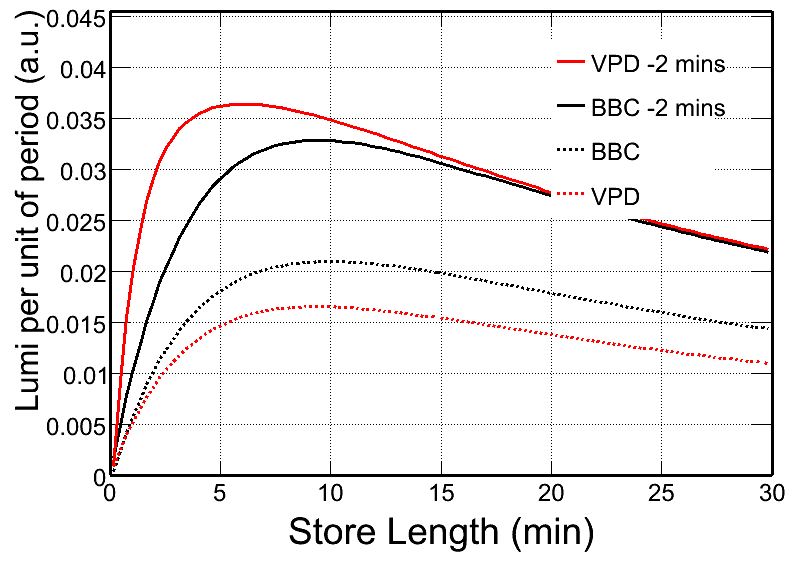
One can see, by the time when physics is ON by CAD, we already lose about 30-50% of the total luminosity. If we start our DAQ taking two mins earlier, we can recover the majority of this lose. So starting early is clearly important! Then next step, I average the numbers in three stores, and fit the data points above red/blue lines with the function: 1 - exp(-(x-[0])/[1]) (for the VPD scalar data points above the blue line are fit to 1 - exp(-(x-[0])/[1]) - exp(-(x-[2])/[3]). ). Then I can calculate the accumulated luminosity in a given period of time under different assumptions of down time between stores.
| Down Time = 5 mins | Down Time = 10 mins |
 |
 |
| Down Time = 15 mins | Down Time = 20 mins |
 |
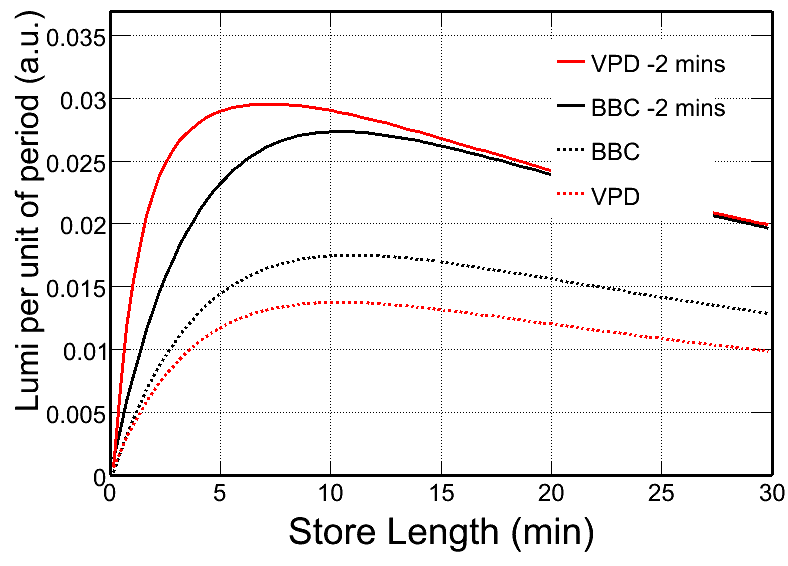 |
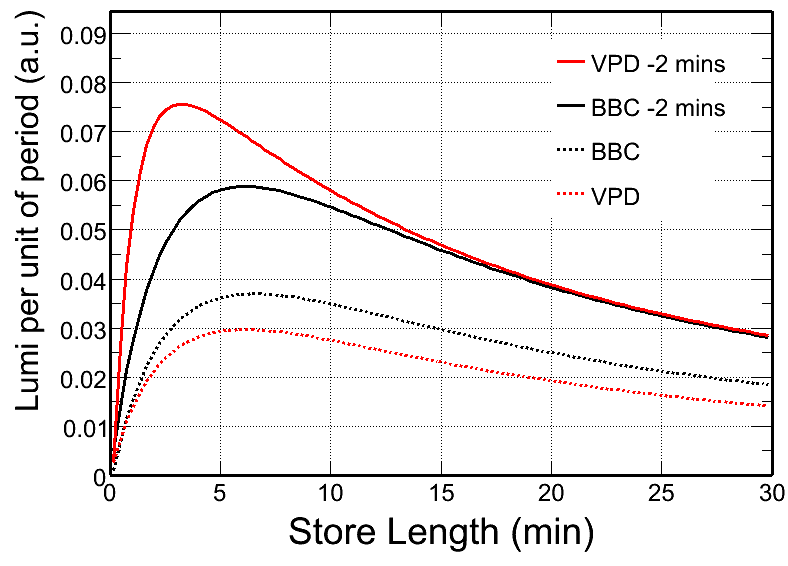
Fig.4 Total accumulated luminosity per unite of period time vs store time under different assumptions of down time between stores. Dashed curves are for DAQ starting on "Physics ON", and solid curves are for DAQ starting 2 mins before "Physics ON".
A couple of additions:
1) How long the down time between fills is a question. If everything goes well, this down time is quite good from the observation today (typically 6-8 mins), but not sure about it if averaged over a long period.
2) VPDE*W or BBCE*W is just an approximate for the luminosity estimation. Don't have quantified numbers on the background / efficiency for each. We can try to do this based on the "good" events" fraction vs time from the offline analysis. Lokesh is working on this now, hope we can get some more realistic estimation.
3) From Fig. 4, one can see the current store length - 20mins is not best for us. Shorten the store length is needed despite still some uncertainties metioned in 1) and 2) since the best store length found here is much shorter than 20 mins.
- dongx's blog
- Login or register to post comments
