- drach09's home page
- Posts
- 2022
- 2020
- June (1)
- 2019
- 2018
- 2017
- 2016
- 2015
- 2014
- December (13)
- November (2)
- October (5)
- September (2)
- August (8)
- July (9)
- June (7)
- May (5)
- April (4)
- March (4)
- February (1)
- January (2)
- 2013
- December (2)
- November (8)
- October (5)
- September (12)
- August (5)
- July (2)
- June (3)
- May (4)
- April (8)
- March (10)
- February (9)
- January (11)
- 2012
- 2011
- October (1)
- My blog
- Post new blog entry
- All blogs
Run-11 Transverse Jets: JP2 (High) Embedding (First Look at Track Resolutions)
Having examined resolutions related to the Sivers asymmetry it is also useful to look at those related to the Collins and Collins-like asymmetries. One issue, however, is that to this point no embedding analysis has attempted to combine jet matching and track matching. The jet trees do not store the information needed for the association maker to run. Pibero has recently edited the jet finder to run the association maker and a sample test suggest it will work. We will need to rerun the jet trees using the newest technology to complete this study. In the meantime, I have implemented a geometric matching for the tracks completely analogous to that of the jet-matching. Reconstructed tracks within reconstructed jets matched to "particle jets" are associated with the thrown particle nearest in (η,φ). The track is "matched" if
The fitting functions are the same skew-normal distributions as described in the previous embedding update. Fitted means are plotted in black circles, while geometric means are plotted with blue triangles.
Figure 1: Track Association
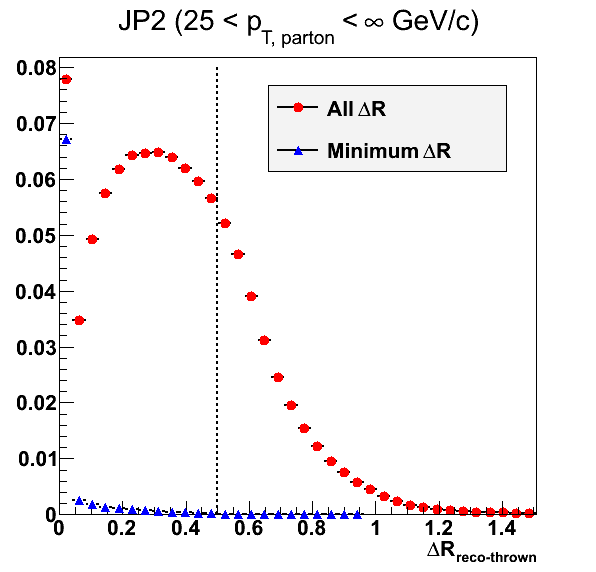
Figure 1 shows the distribution of ΔR and distribution of the minimum ΔR value between all reconstructed tracks and particles. Tracks, here, are taken from reconstructed jets matched to particle jets.
Kinematic Distributions
Figure 2
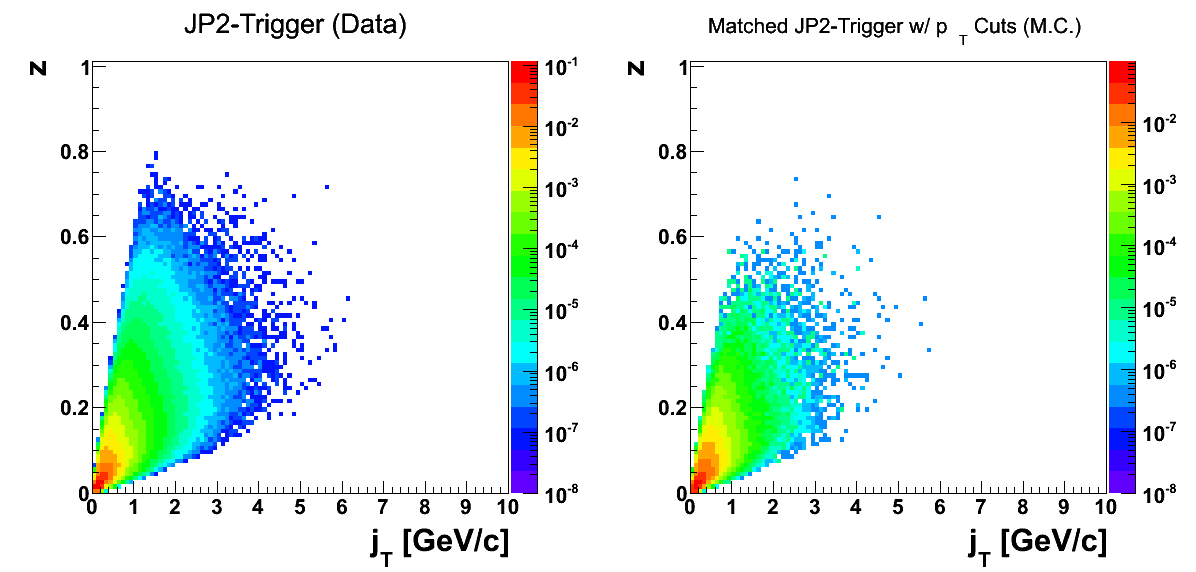
Qualitatively, the jT and z distributions appear similar.
Figure 3
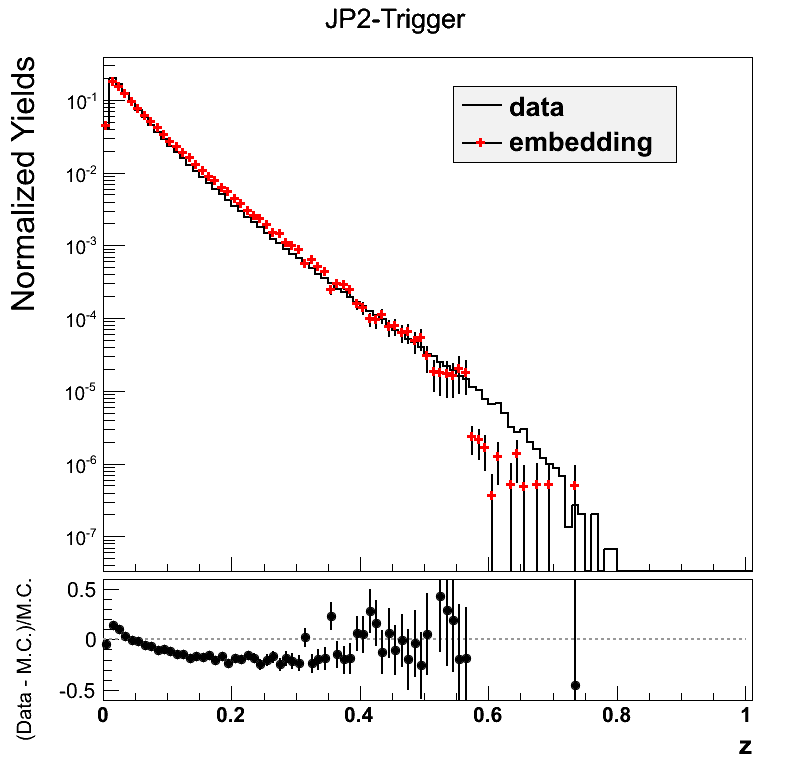
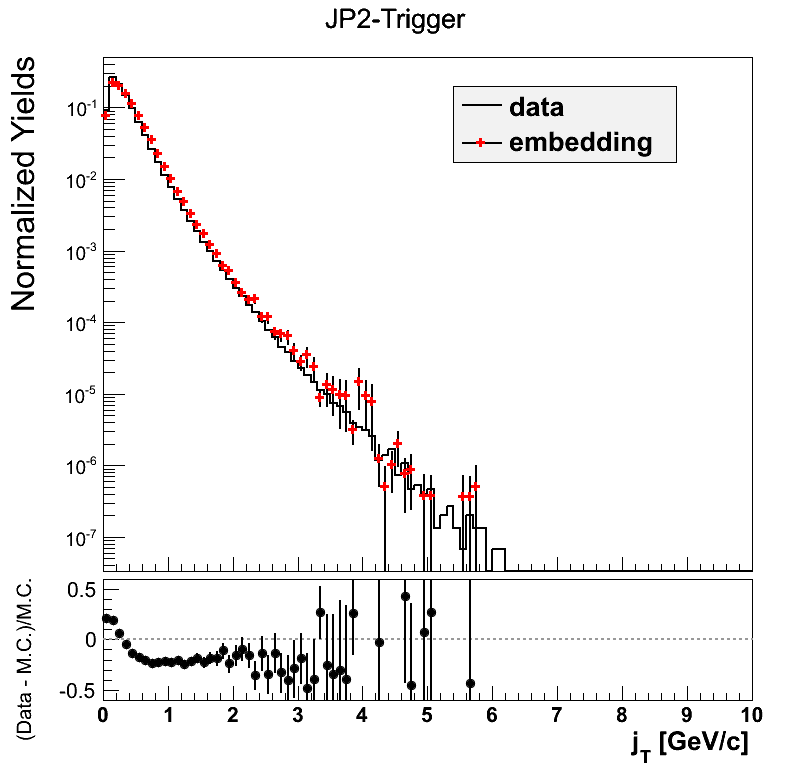
Again, the jT and z distributions appear relatively civilized comparing data to embedding. Hopefully, as the lower partonic-pT bins are filled in the situation will even improve.
Momentum Fraction Resolution
The results examine the Collins and Collins-like asymmetries as a function of z = ptrack/pjet. Thus, it is useful to examine the shift and resolution of z. As a reminder, the current bins are defined as
const double zbins[nzbins+1] = { 0., 0.05, 0.1, 0.2, 0.3, 0.4, 0.5, 0.8, 1. };
Figure 4
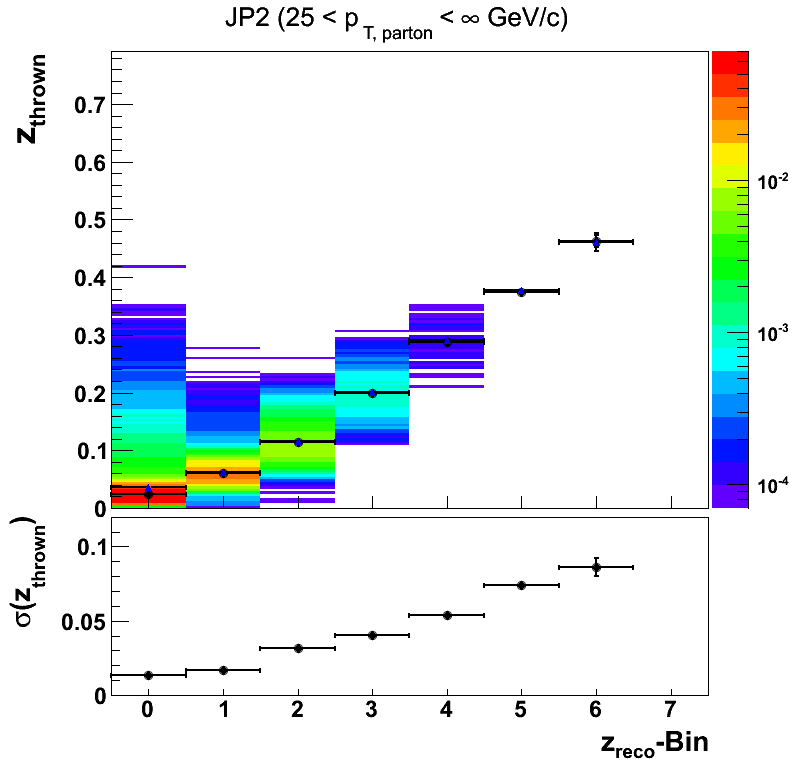
Off the bat, one can see no matched tracks in the sample are reconstructed in the highest bin. This should probably come as no surprise as very few tracks show up in this bin in the data. I have not even shown this bin in analysis updates. Additionally, I note that the thrown z values are considerably shifted even outside of the reconstructed bin widths. Of course, I still lack the lower partonic pT sample which may change the story somewhat.
Relative Track Transverse Momentum
Collins and Collins-like asymmetries are also shown as a function of the transverse momentum as measured in NLS coordinates, jT. Here, our lack of low partonic-pT bins should affect the distributions in lower jT-bins. As a reminder I define jT-bins as
const double jtbins[njtbins+1] = { 0., 0.1, 0.2, 0.3, 0.5, 0.7, 1., 2., 10. };
Figure 5
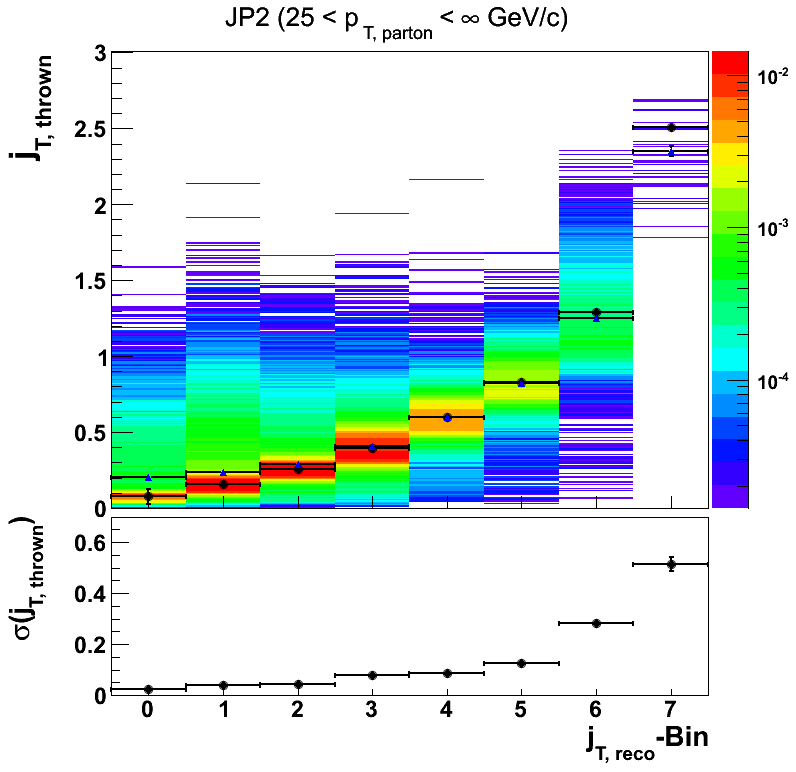
Again, very few tracks reconstruct in the highest bin, just as in the data. The fit quality at lower jT is not very good. Likely this is due in part to the lack of low partonic pT. Generally speaking, things seem relatively well behaved up to 1 GeV/c perhaps even to 2 GeV/c where σ(jT)/jT ~ 0.25. Above this, there simply are not the statistics to evaluate things appropriately. The feeddown from lower jT bins will shift things lower, so one should wait until then to draw firm conclusions.
Track Transverse Momentum
The previous study implied that an appropriate jet pT upper limit may be 55 GeV/c. Another limitation may be that of the track pT resolution. We may want to exclude jets with tracks of pT above a certain value. It is therefore worthwhile to examine the resolution of track pT.
Figure 6
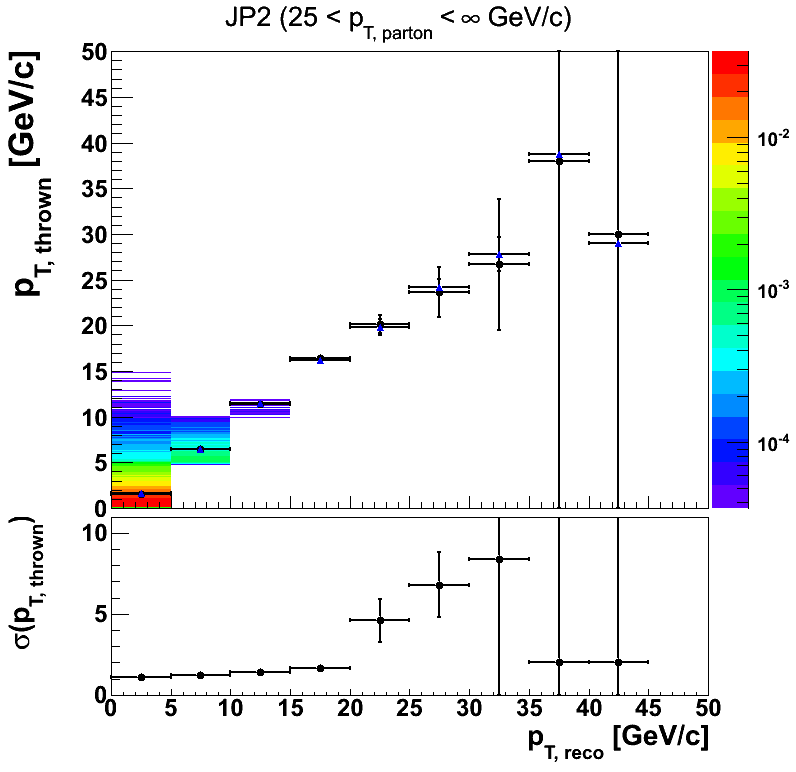
Statistics begin to run out around 20 GeV/c. Consequently, this is also where the resolution appears to take off. By 30 GeV/c it appears we are largely influenced by misreconstructed tracks. Perhaps, 20-30 GeV/c is a sensible cut-off for track pT.
Collins Angle Resolution
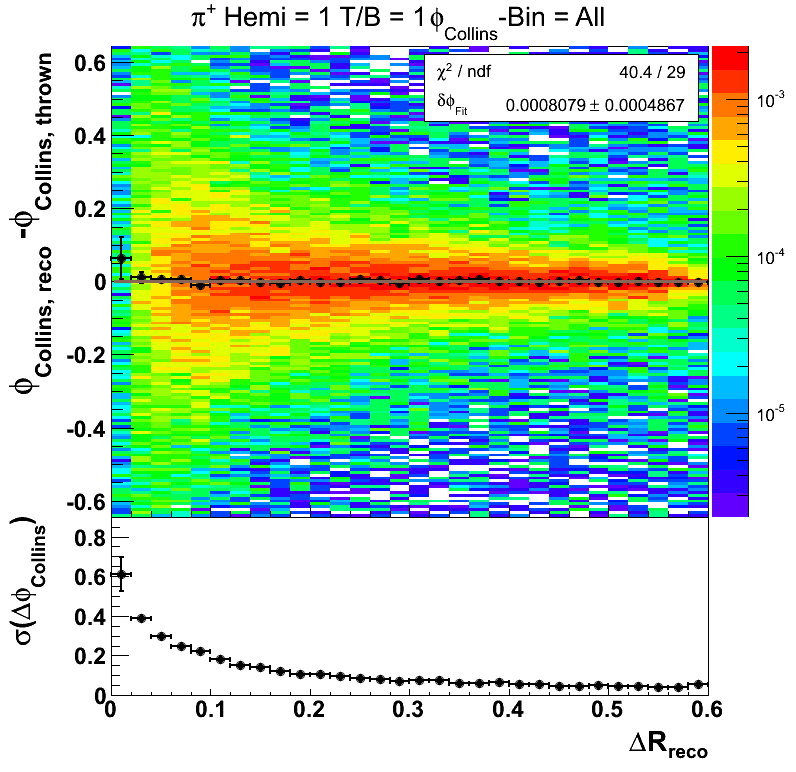
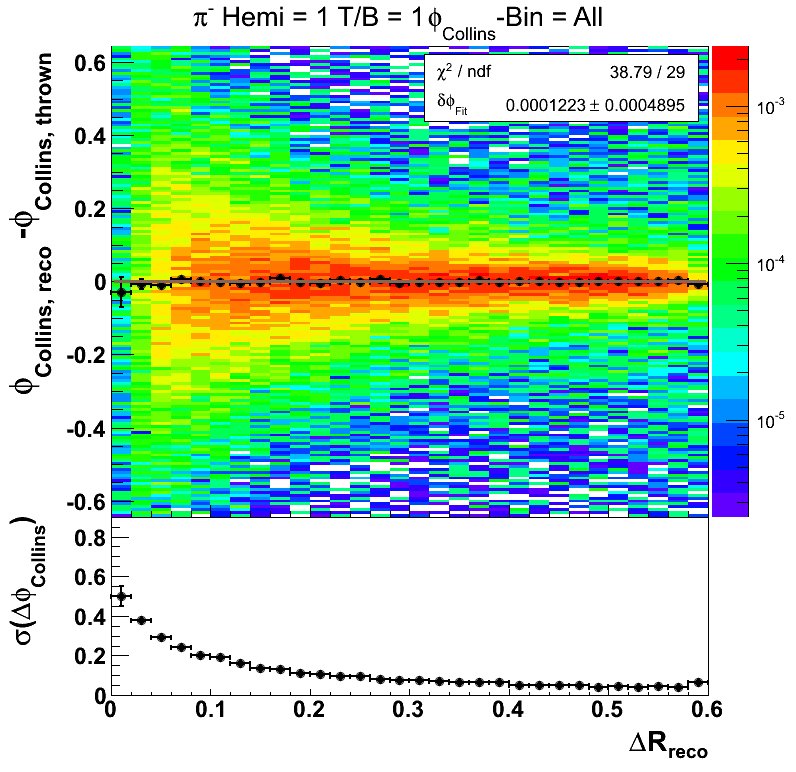
One of the most important cuts for the Collins analysis is the resolution on the Collins angle. To keep this systematic under control we have implemented a cut on tracks with ΔR < 0.1. It will be useful to tune this cut with embedding. For this study I have simply fit ΔφCollins = φCollins, reco - φCollins, thrown with a Gaussian, rather than the skew normal distribution. Often, this fit is not very good, so it may be worthwhile to consider simply the RMS for future studies.
Figure 7
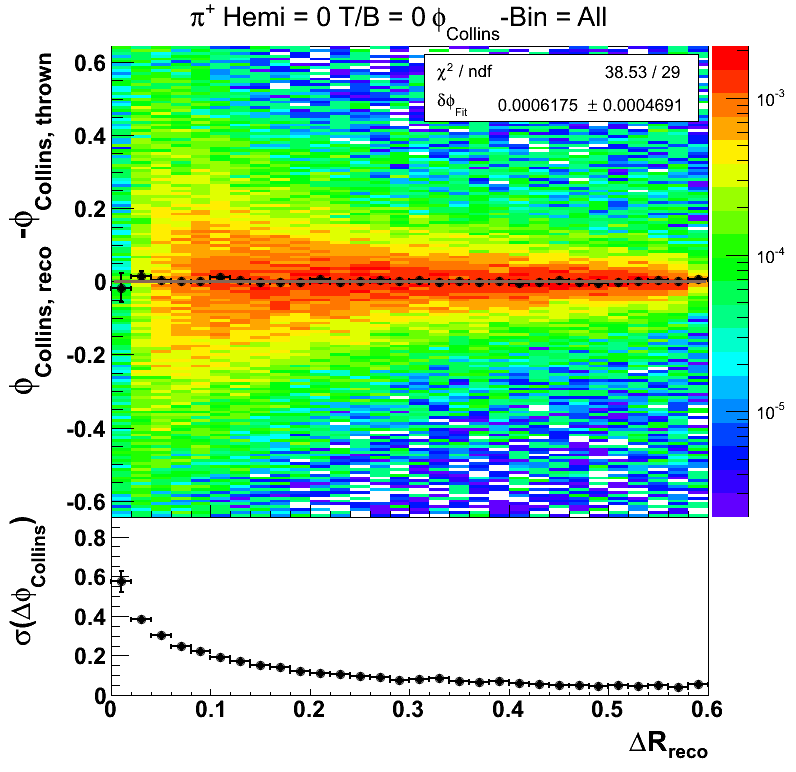
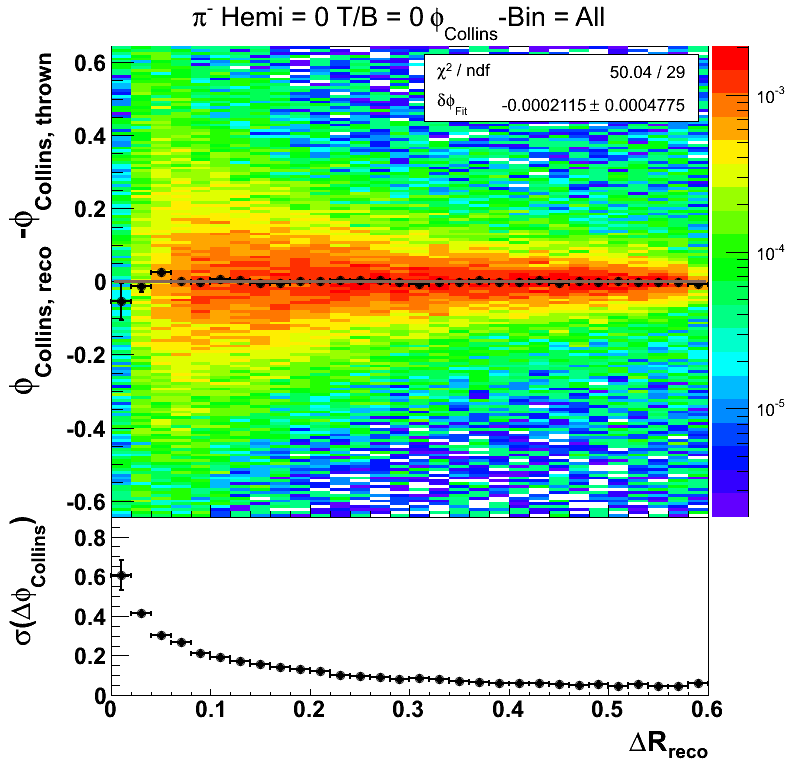
Figure 7 shows the collins angle resolution as a function of radius integrated over all bins of the collins angle for pions reconstructed in the west-top portion of the TPC. Other areas of the detector show qualitatively similar behavior. One observes that the shifts in the Collins angle are quite minimal. One, further, observes that at lower radius, the resolution takes off rather quickly. At our current cut, the resolution (taken as the σ for the Gaussian fit) is around 0.2. If I convolute a sine function with a Gaussian of width 0.2, I return a sine function damped by about 2%. This appears to be quite managable given the small size of the measured asymmetries. At ΔR = 0.05 the resolution appears to be ~0.3 which would yield a damping of ~5%. At the lowest bin of ΔR the resolution appears to be ~0.6 which would yield a damping of ~16%.
Figures 8-10 show the resolutions for other portions of the detector. It appears the behavior is very similar to what is seen in Fig. 4.
Figure 8
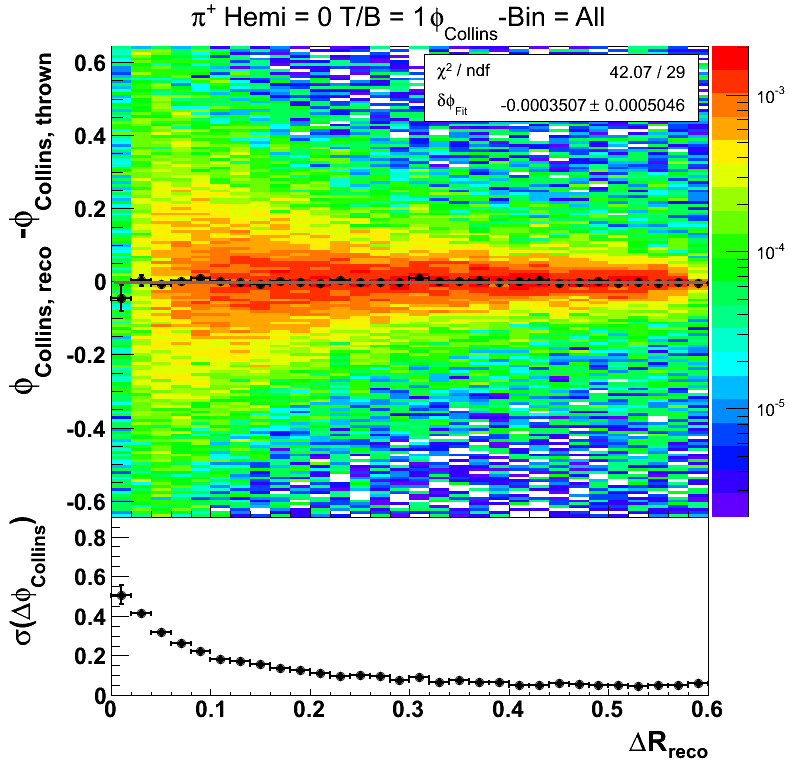
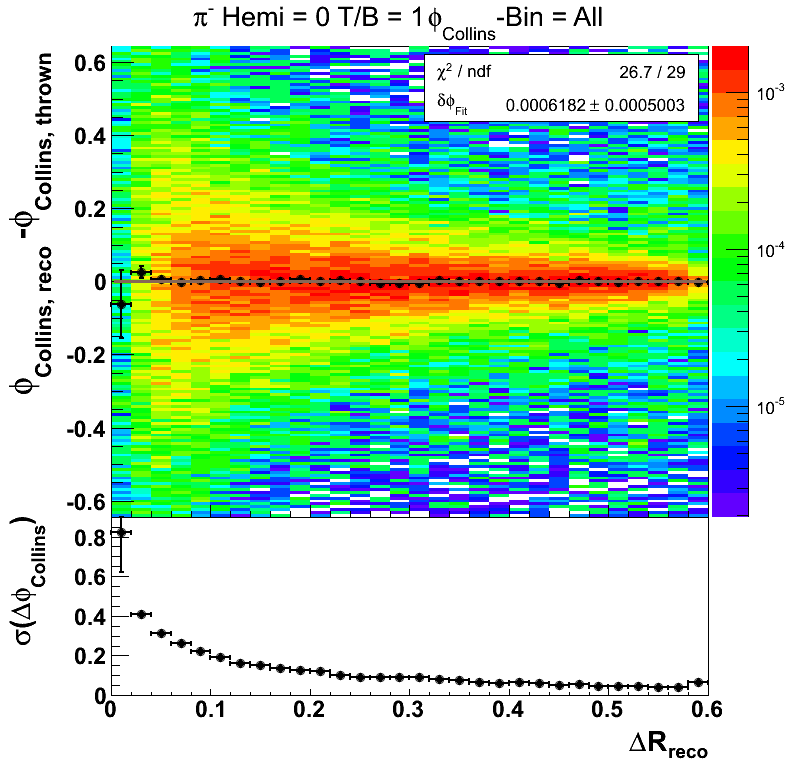
Figure 9
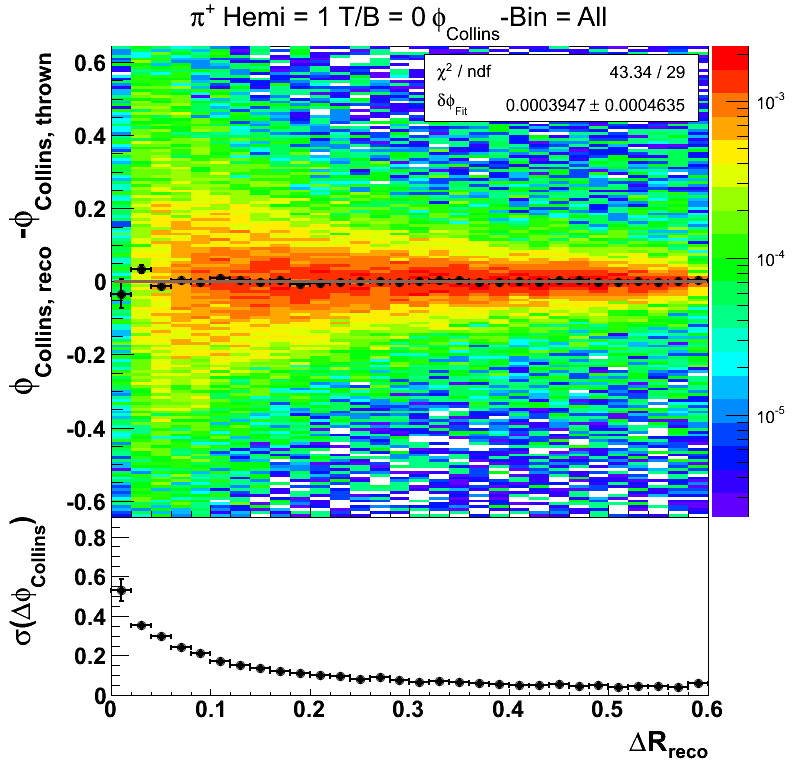
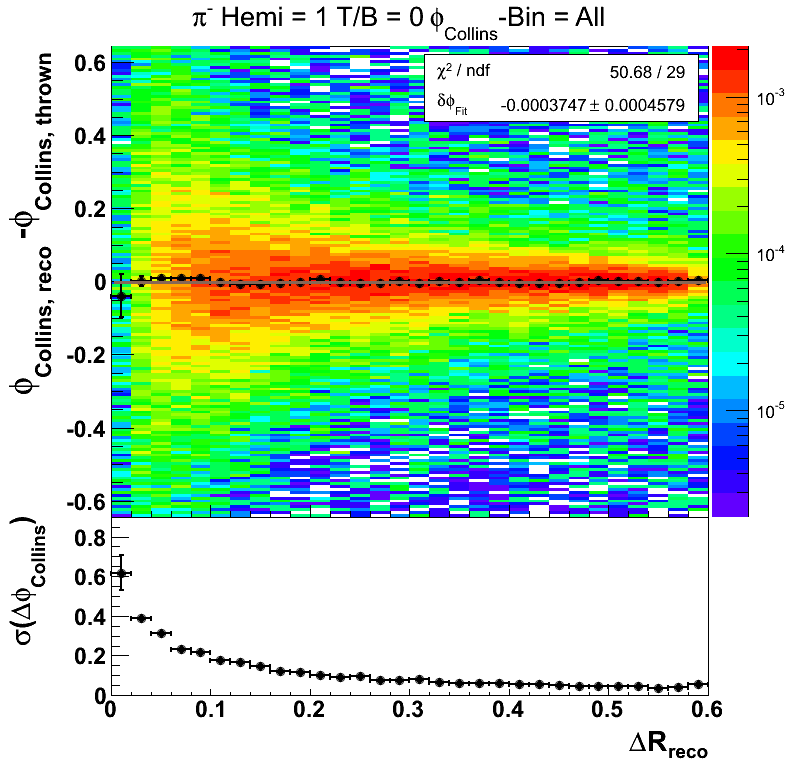
Figure 10
- drach09's blog
- Login or register to post comments
