There is a striking discrepancy between the signal fractions derived from TOF and those derived from dE/dx. Here, I investigate a bit deeper, targeting the first z-bin. For this purpose, I split the first z-bin into two subsets: 0.1 < z < 0.15 and 0.15 < z < 0.2. I repeat the dE/dx study with these new ranges and compare to the information extracted from TOF.
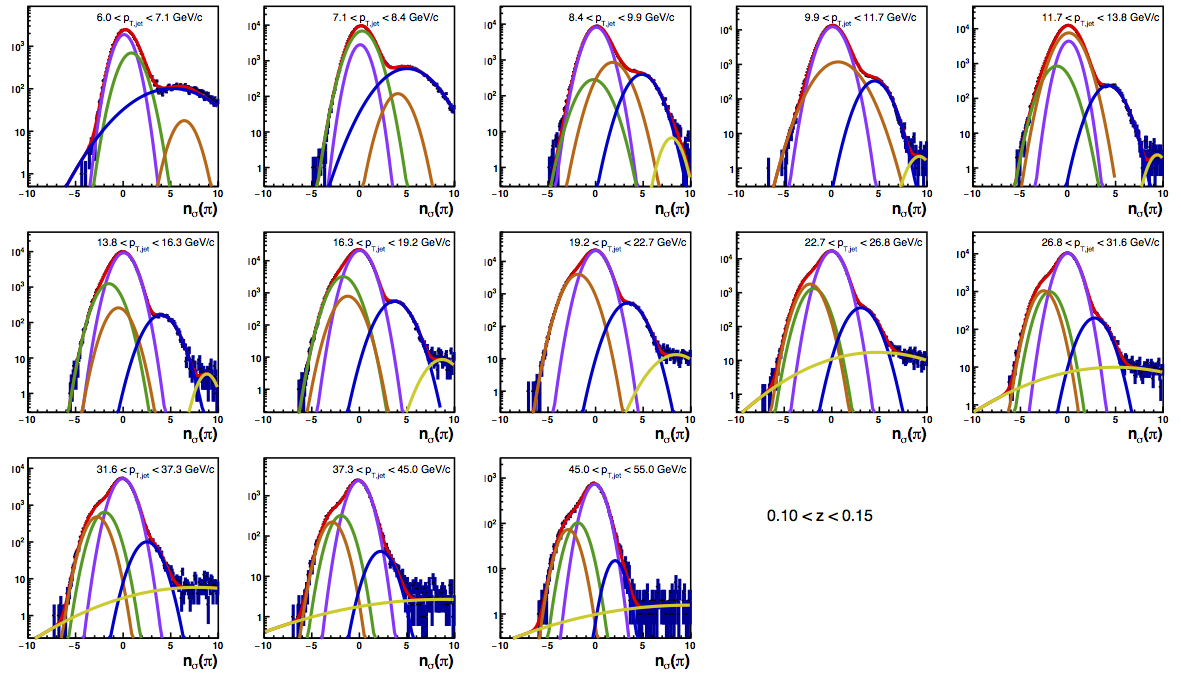
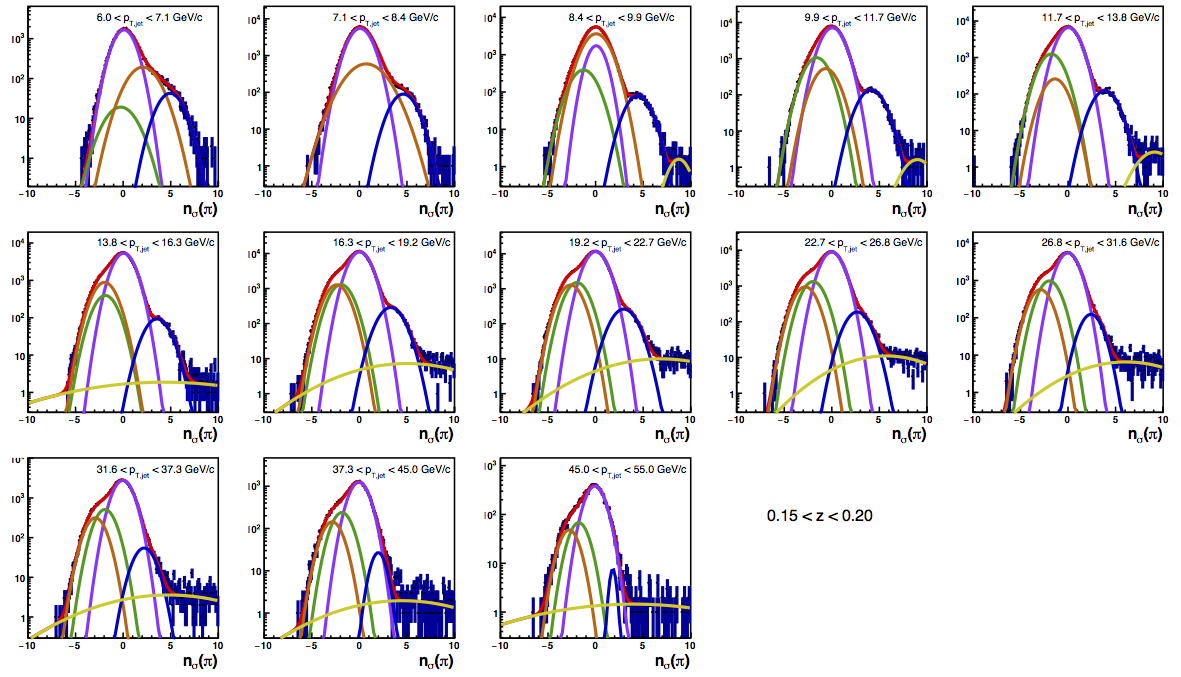
dE/dx PID Fits
Figure 1: dE/dx PID Fits (All Triggers)
| Positive Charge |
Negative Charge |
 |
 |
 |
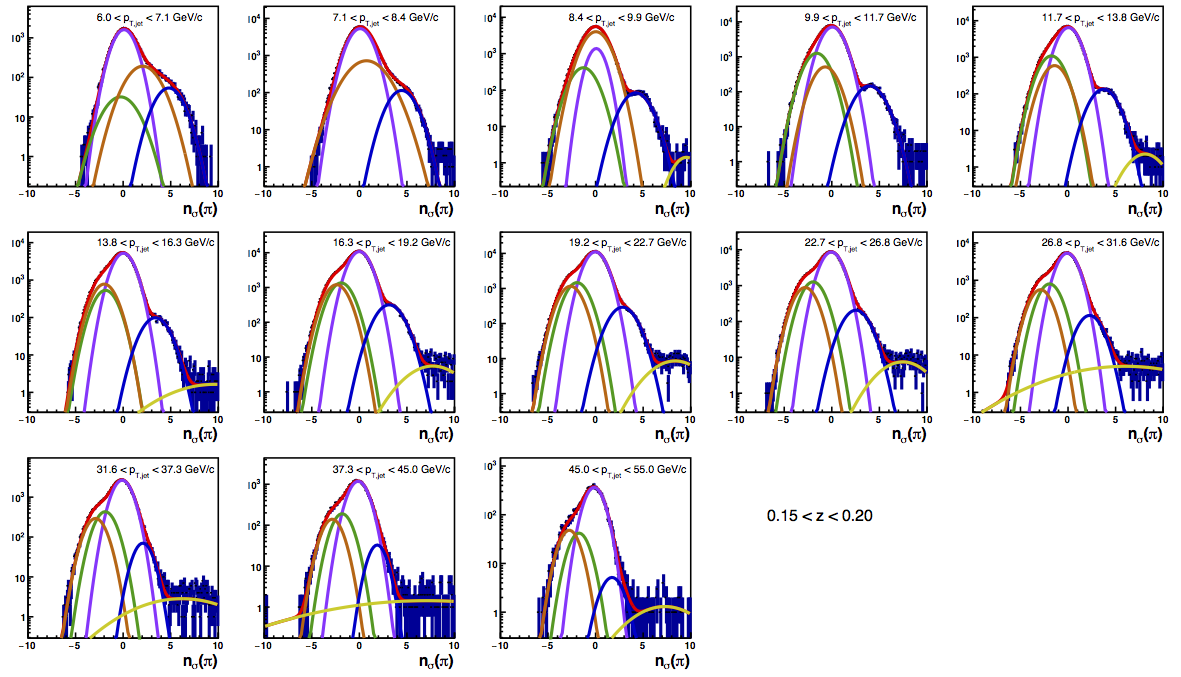 |
The color scheme is the same as used in the previous blog post: violet = pions, green = kaons, orange = protons, and blue = electrons. NOTE: This is different than the color scheme used for the TOF histograms used in Figs. 3-6 (sorry!). One can see that splitting the bin allows the fits to converge over a broader kinematic range. For example, the fits only converge sensibly for pT > 22.7 GeV/c for 0.1 < z < 0.15, however, they converge (more or less) sensibly for pT > 13.8 GeV/c for 0.15 < z < 0.2.
TOF PID Fits
I introduce a few significant edits to the TOF distributions. Be advised that these new cuts are only for the signal fraction analysis. The cuts for the asymmetry analysis are unchanged. First, I now require events to contain a VPD vertex that matches to the TPC vertex. Second, I require all events satisfy |zvtx| < 30 cm, as I do for VPDMB events. In the end, I do not believe the zvtx cut makes a significant difference, but it does put the events on equal footing.
Figure 2: Event Class Comparison
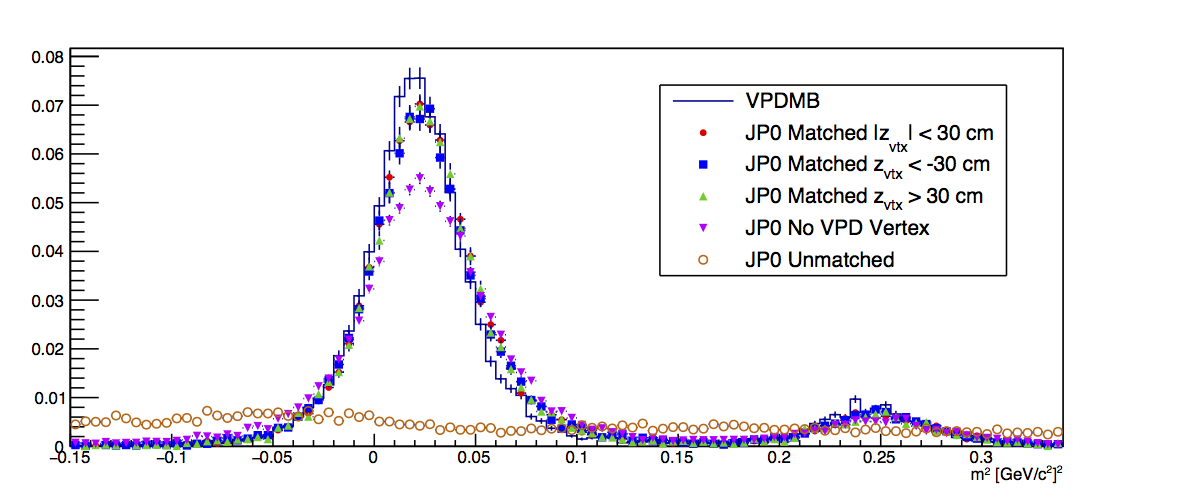

Figure 2 (left) shows a comparison of the various event classes for the 0.1 < z < 0.15 and 7.1 < pT < 8.4 GeV/c bin (positive charge). The histograms have each been normalized to unity. One can observe that there is still a small amount of discrepancy between the VPDMB events and the JP0 triggered events. Events without a VPD-TPC vertex match are basically a constant vertical offset. On the right, I show a comparison of the JP0 "matched" events to "corrected" JP0 no-VPD events. For the "correction," I scale the (prenormalized) JP0 unmatched distribution by the ratio of (prenormalized) JP0 no-VPD to JP0 matched+unmatched. Then, I subtract this distribution from JP0 no-VPD. I normalize each to unity and overlay them for comparison (my apologies for the choice of colors!). The match is not perfect but significantly improved. Clearly, excluding the unmatched events is the right thing to do, and excluding no-VPD for this study is a significant improvement, as well.
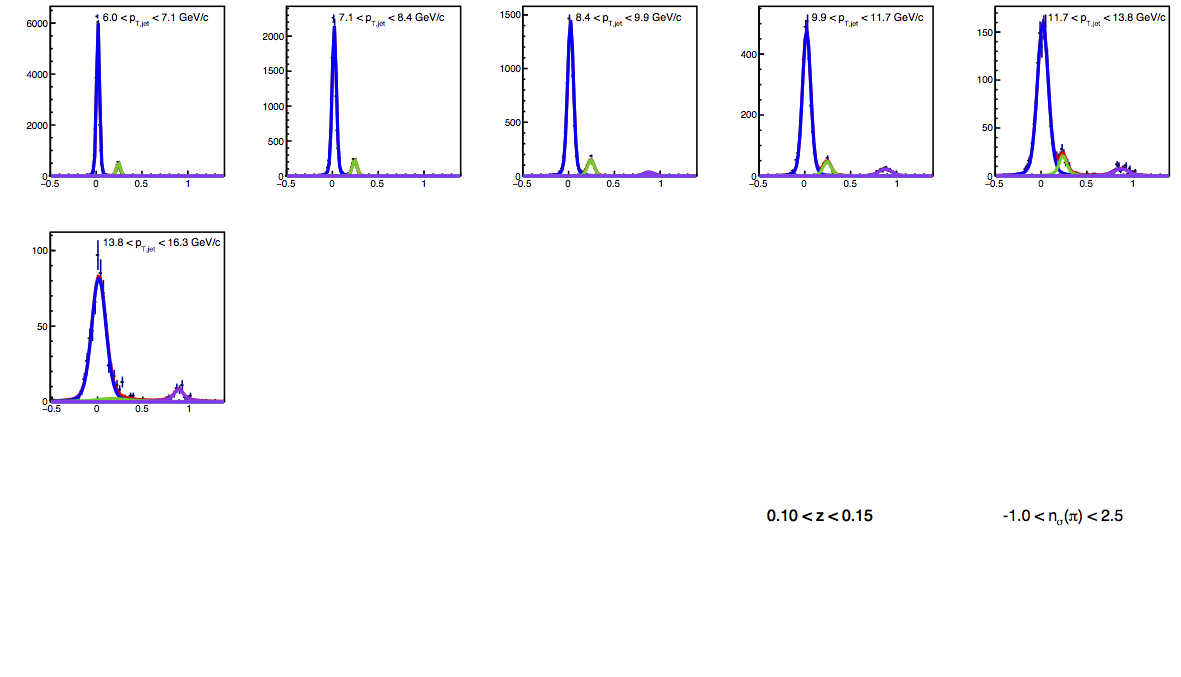
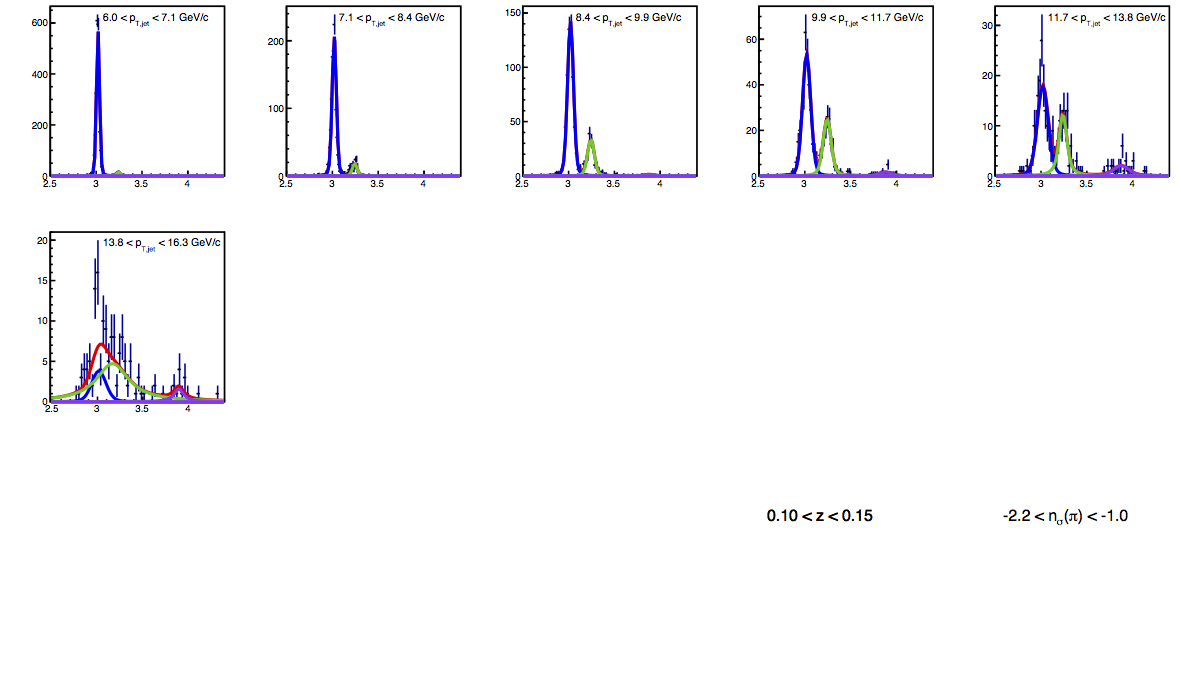
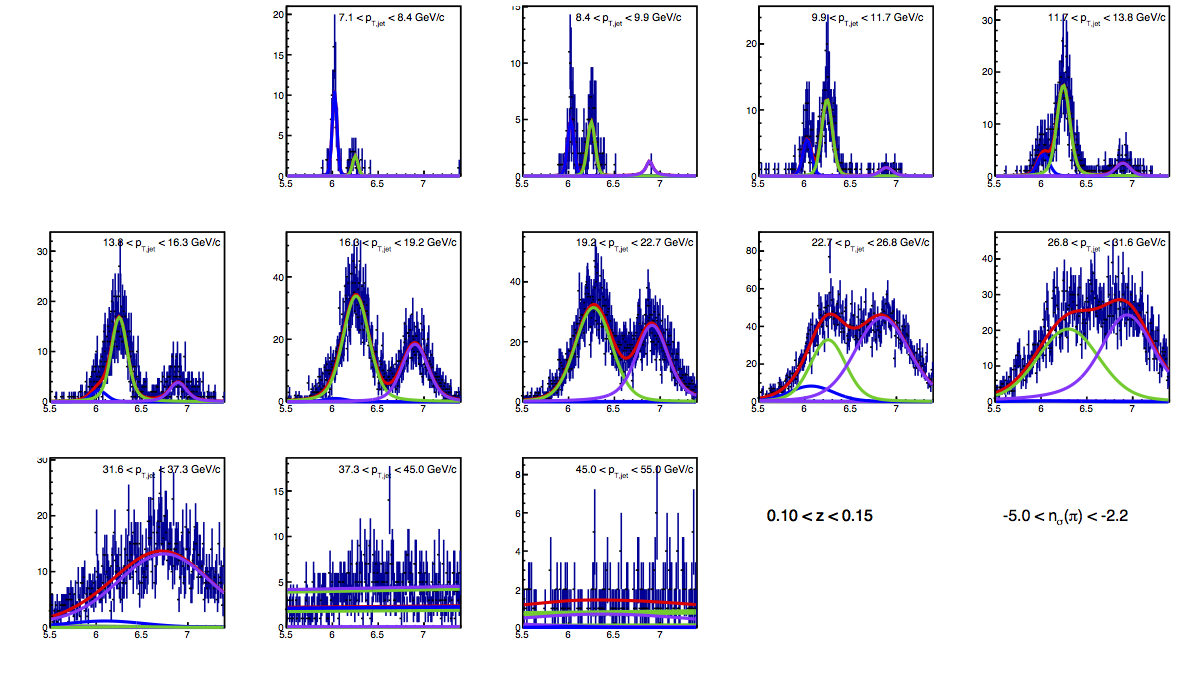
Figure 3: VPDMB TOF PID Fits for 0.1 < z < 0.15
| Positive Charge |
Negative Charge |
 |
 |
 |
 |
 |
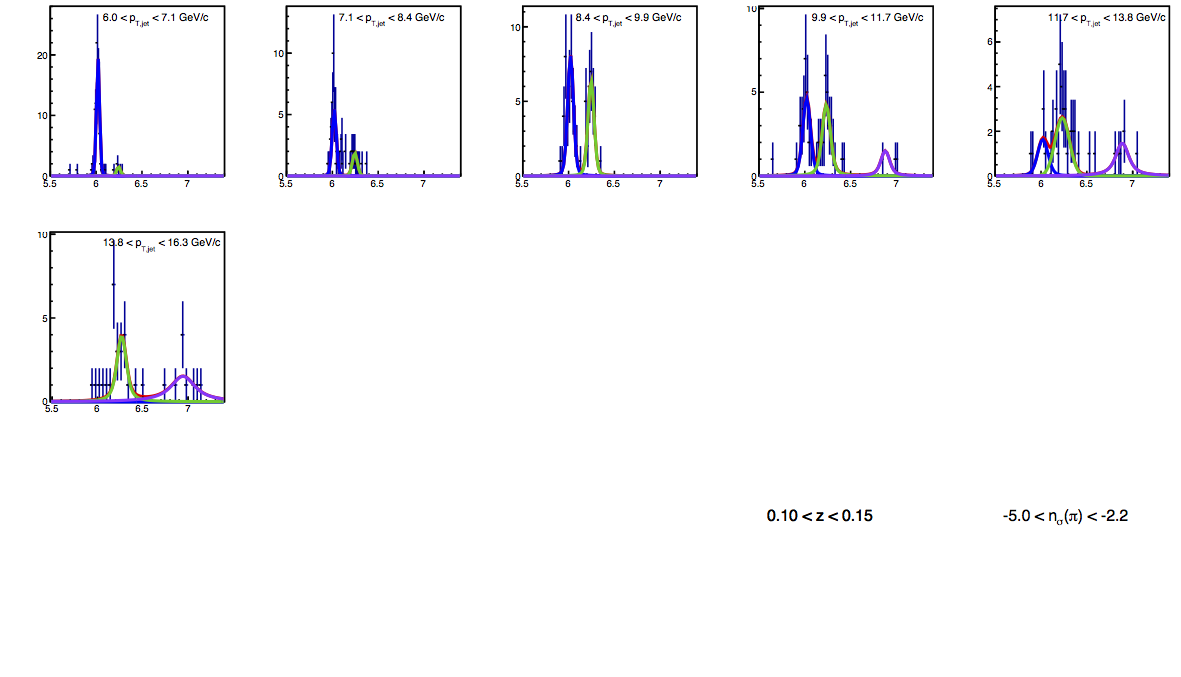 |
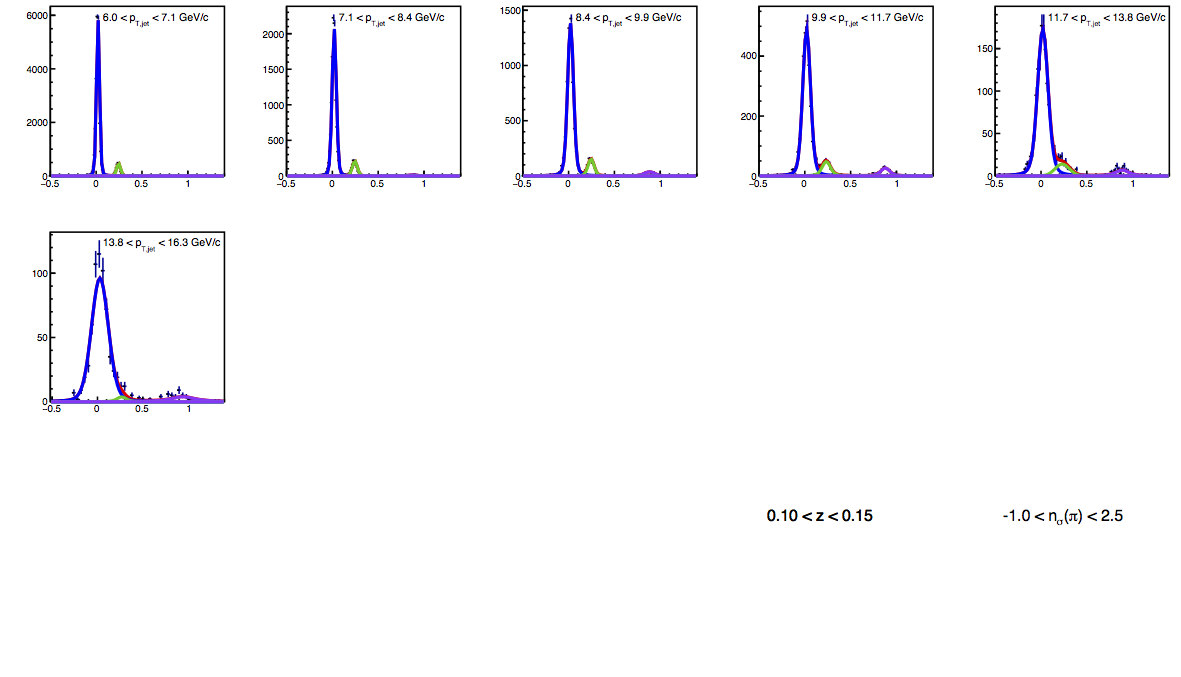
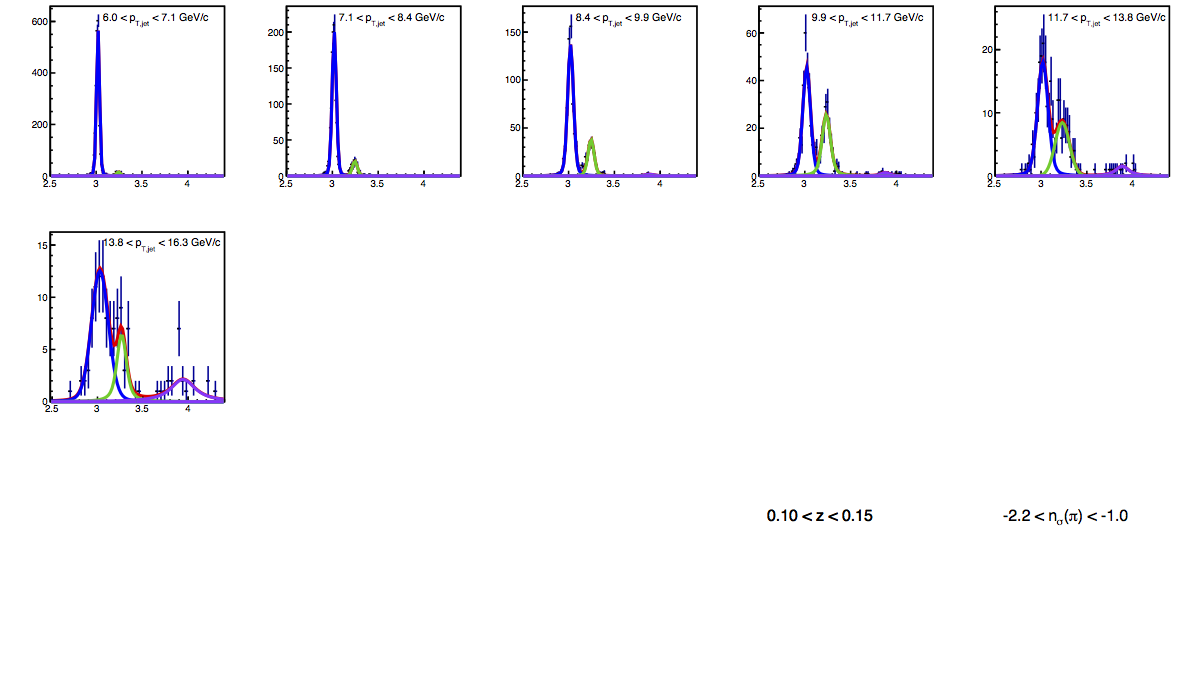
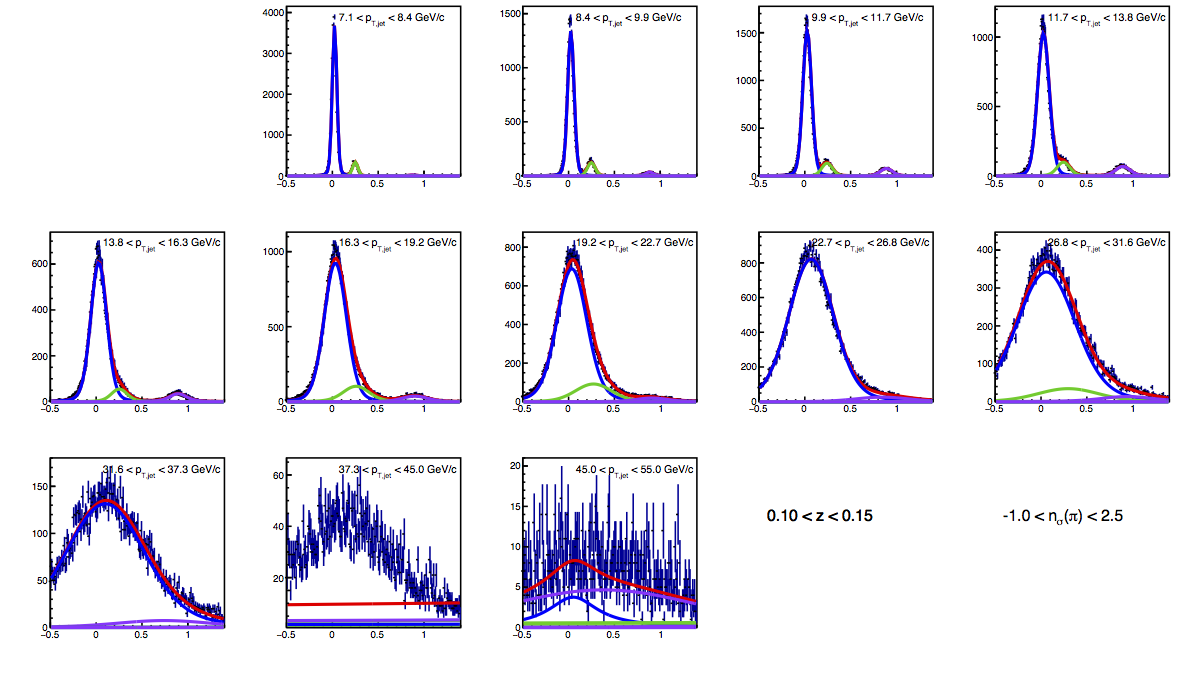
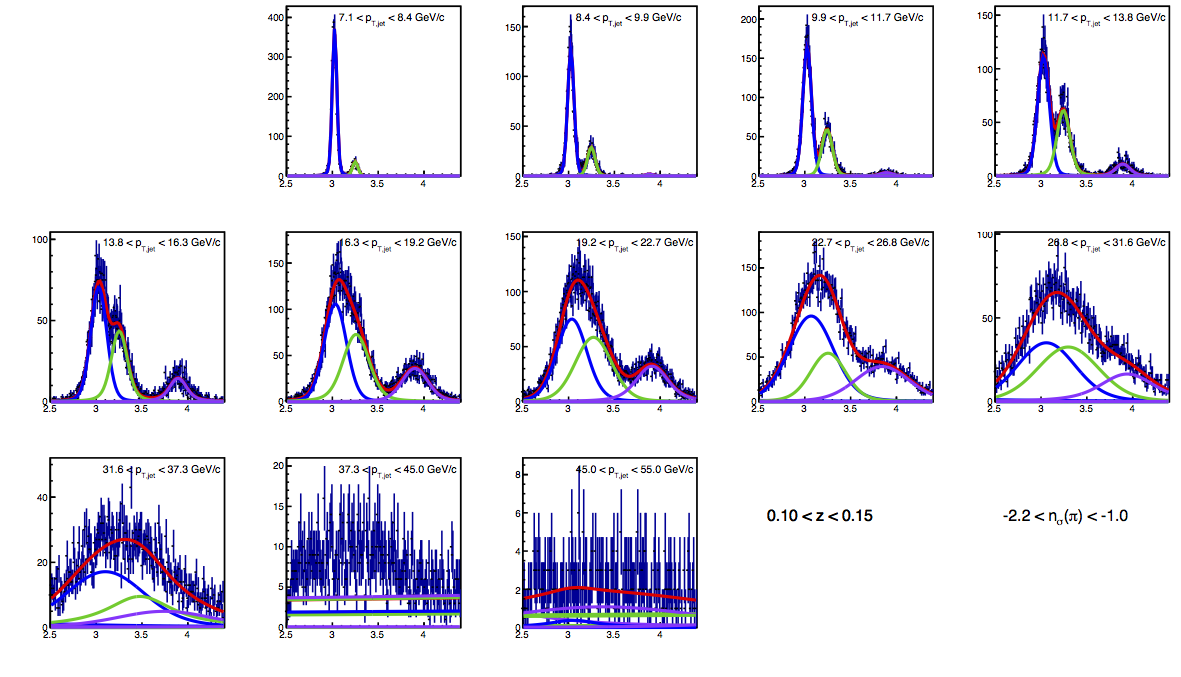
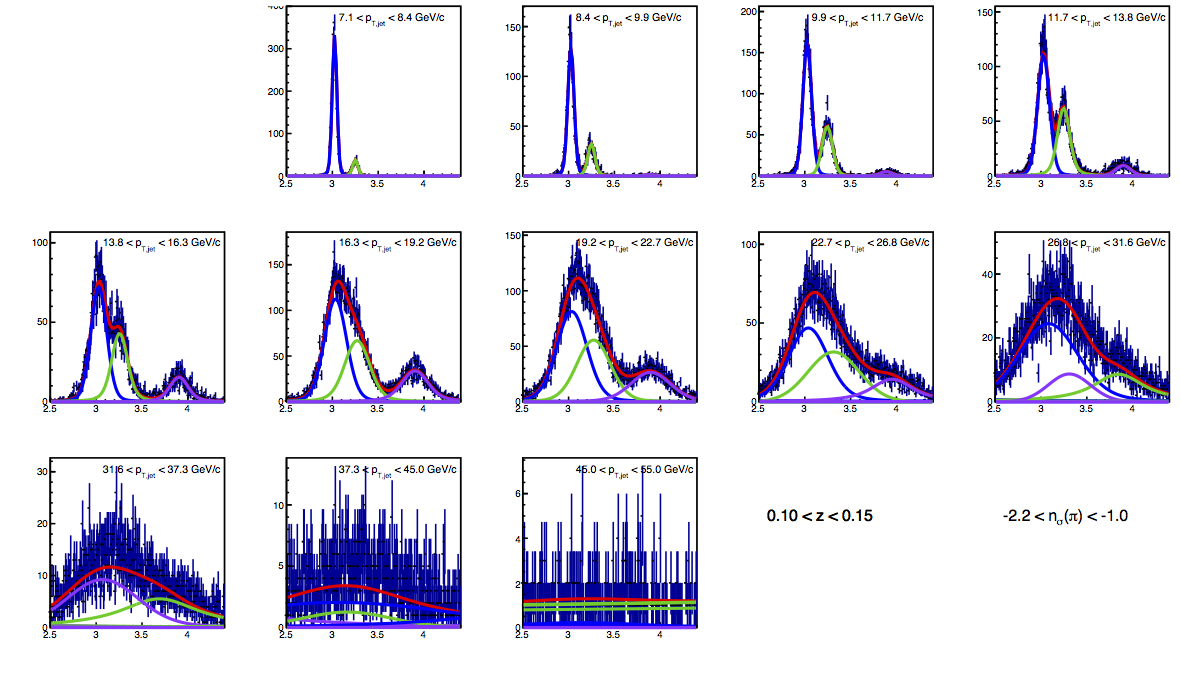
Figure 4: JP TOF PID Fits for 0.1 < z < 0.15
| Positive Charge |
Negative Charge |
 |
 |
 |
 |
 |
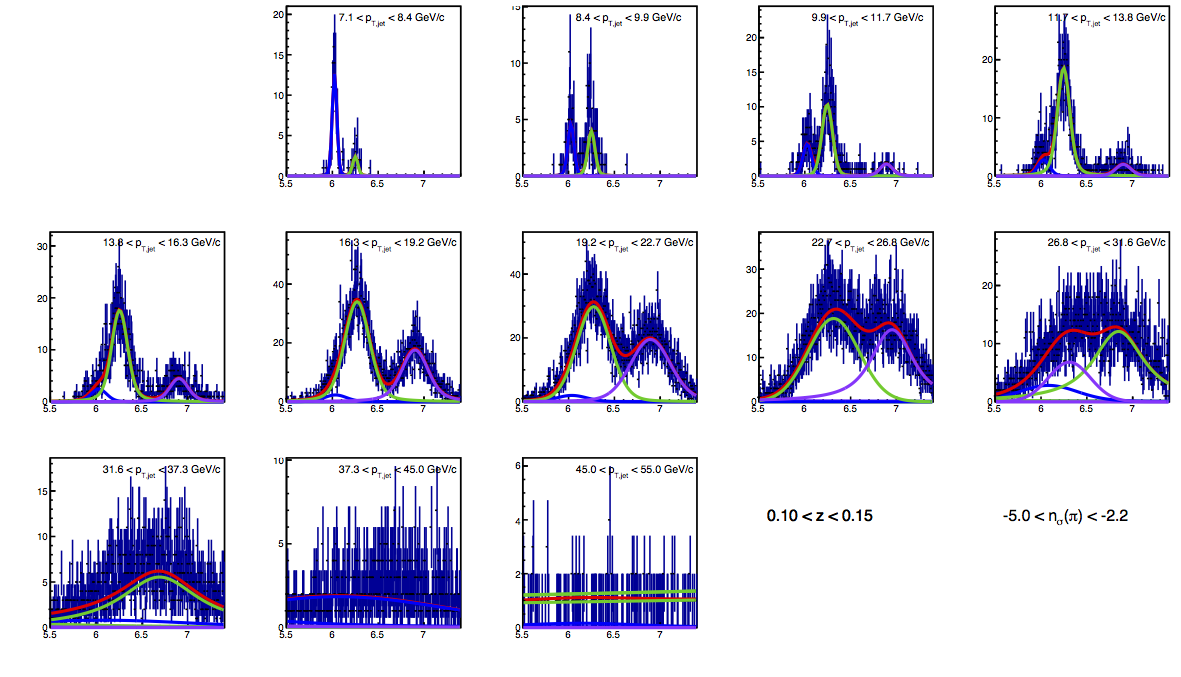 |
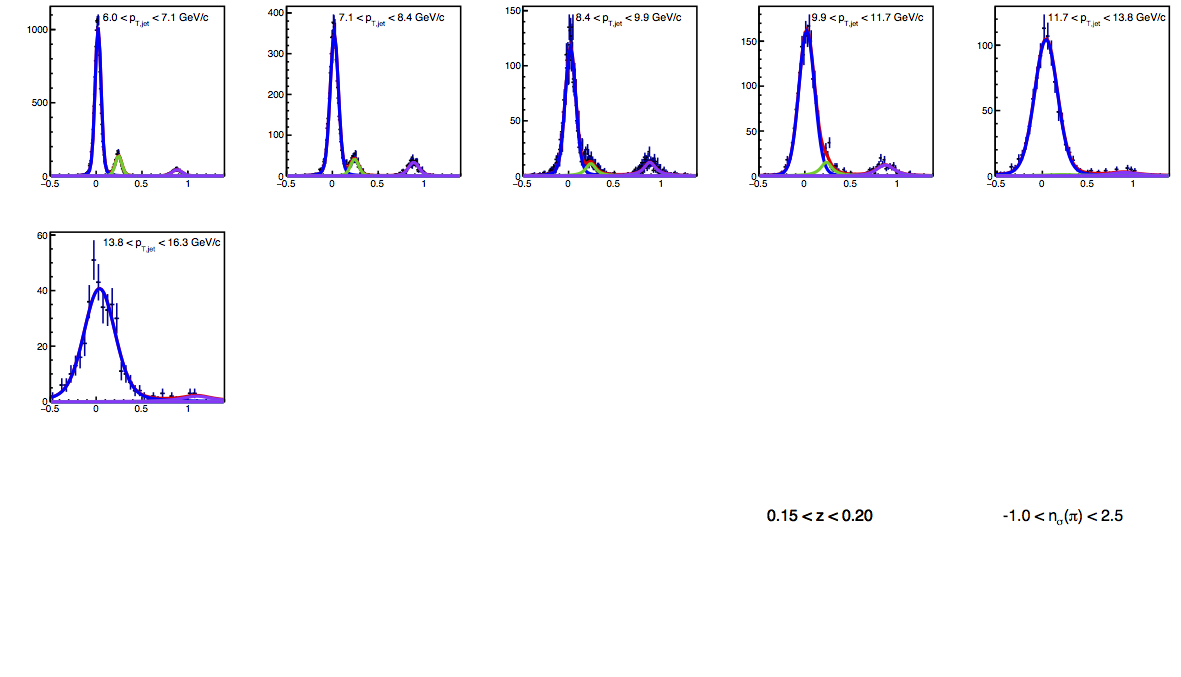
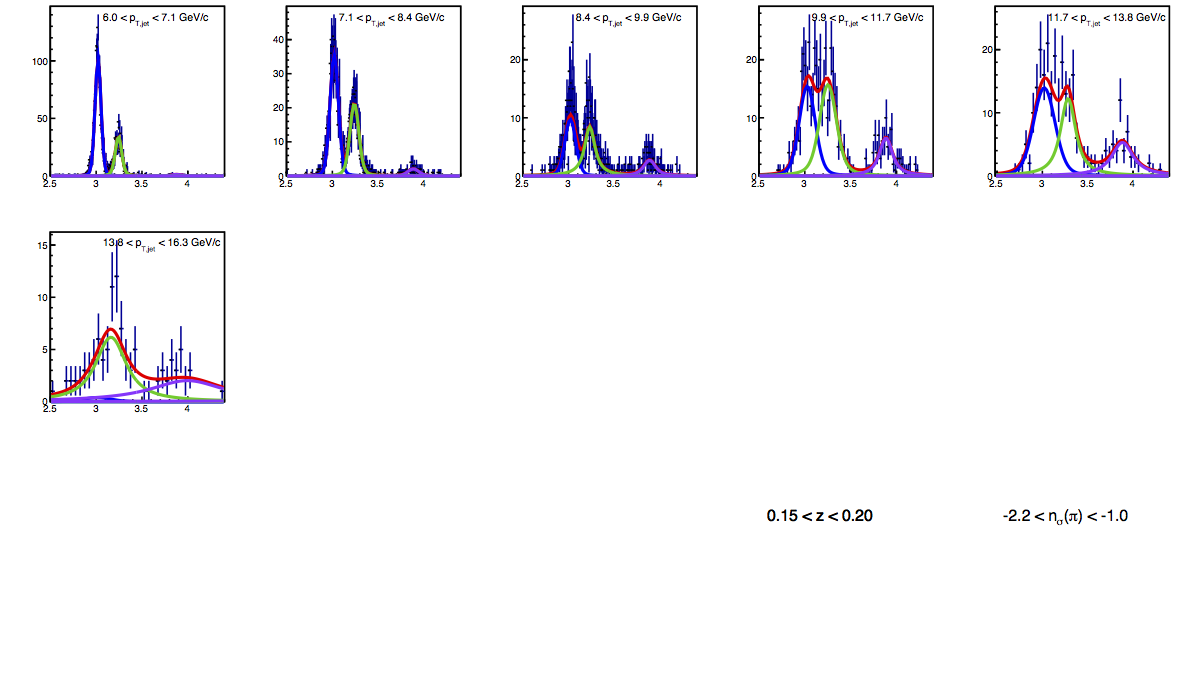
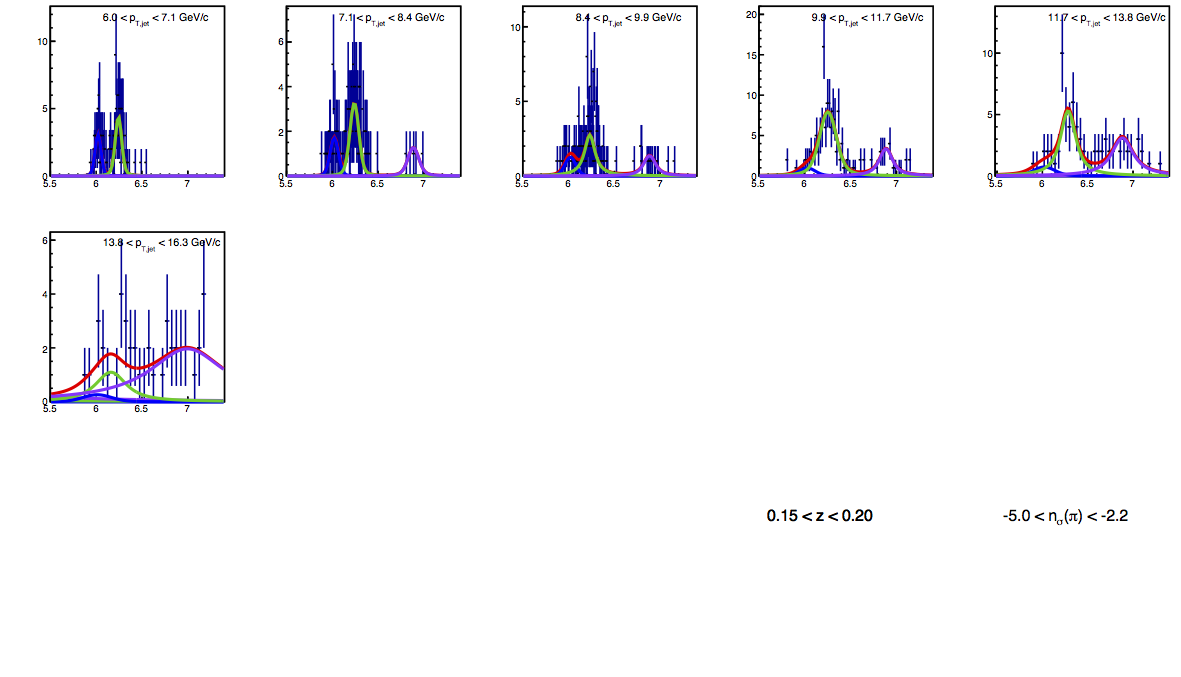
Figure 5: VPDMB TOF PID Fits for 0.15 < z < 0.2
| Positive Charge |
Negative Charge |
 |
 |
 |
 |
 |
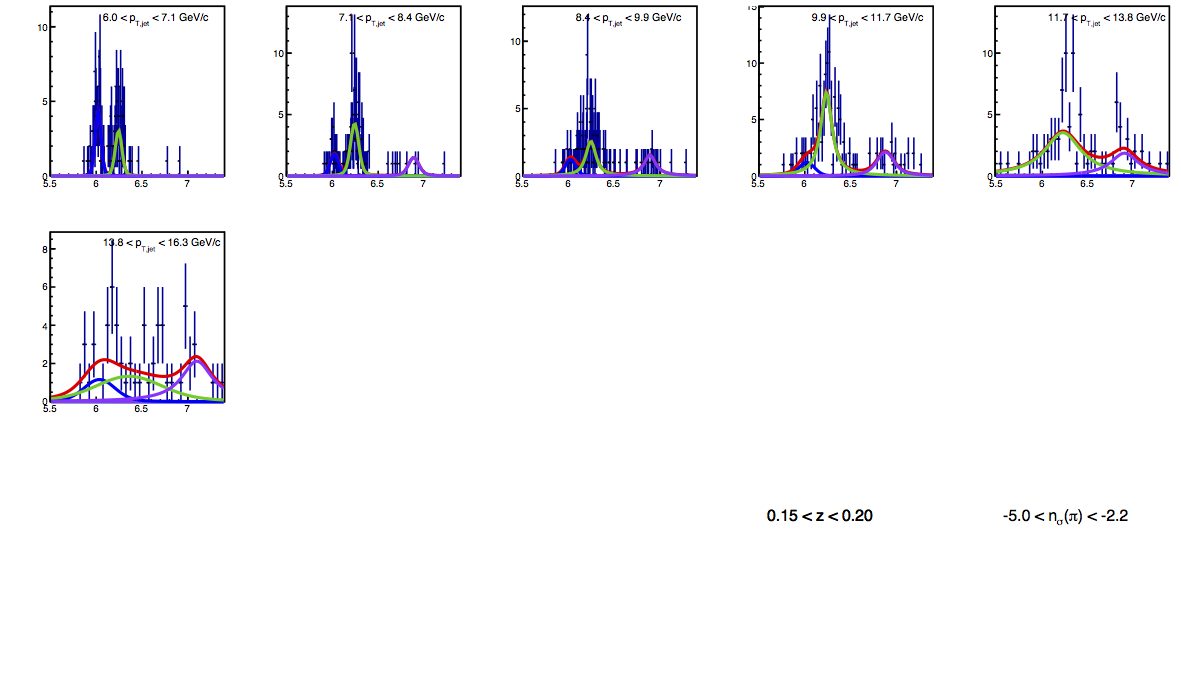 |
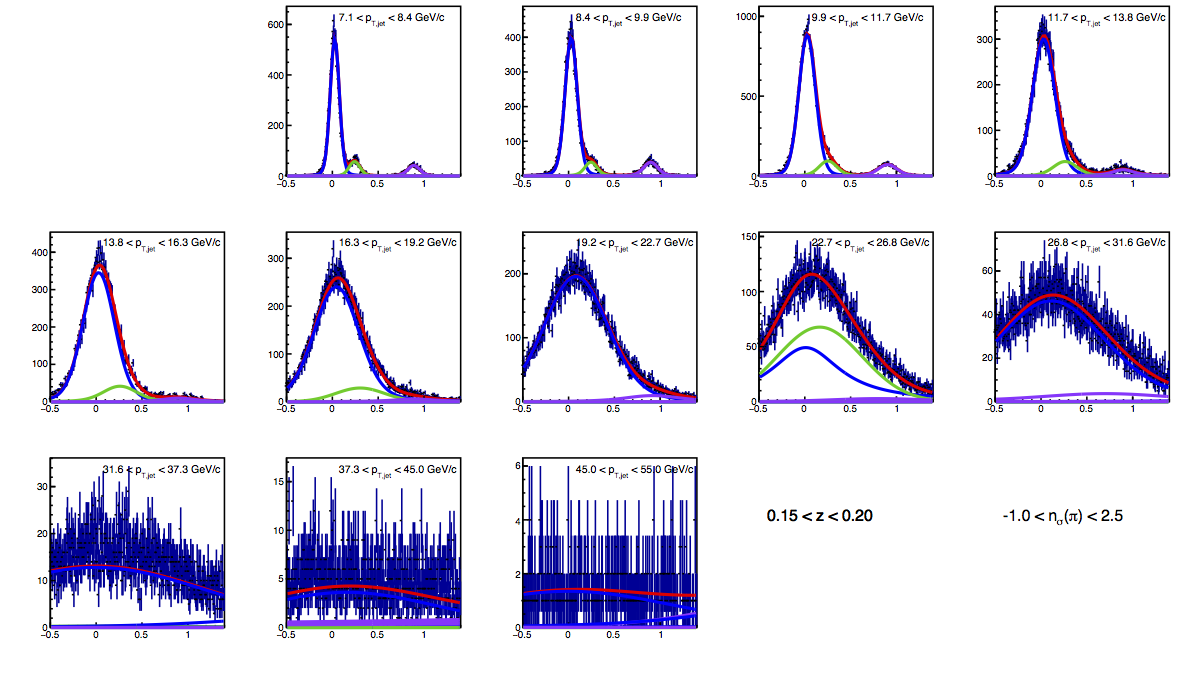
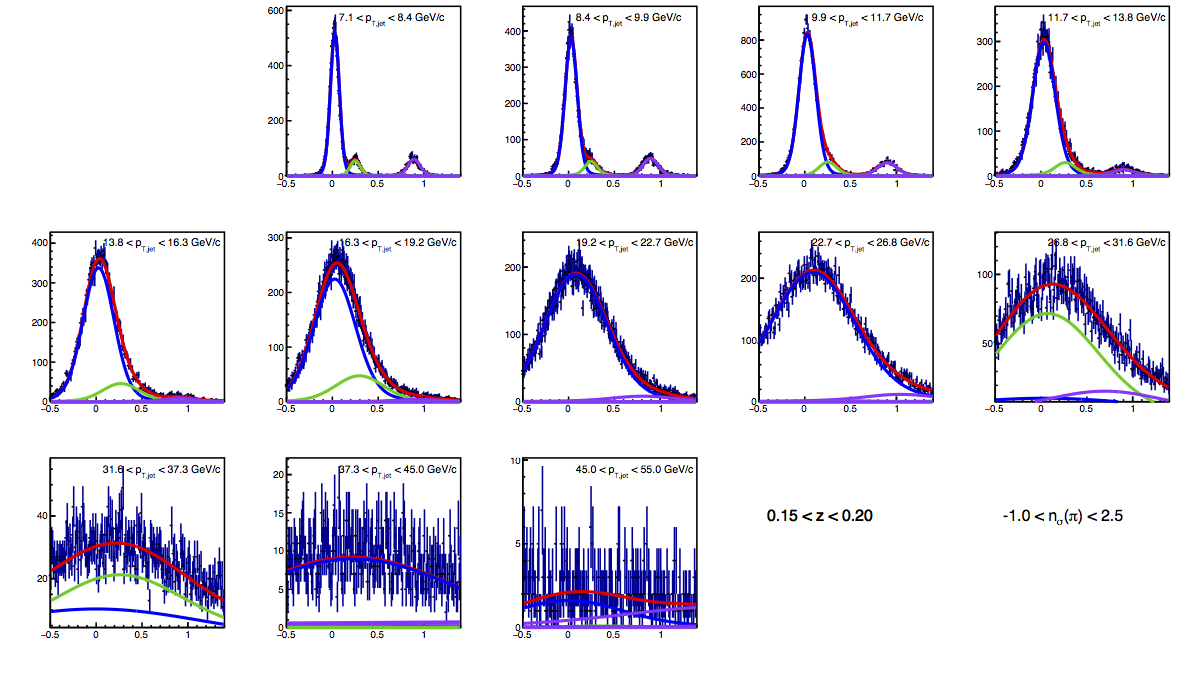
Figure 6: JP TOF PID Fits for 0.15 < z < 0.2
| Positive Charge |
Negative Charge |
 |
 |
 |
 |
 |
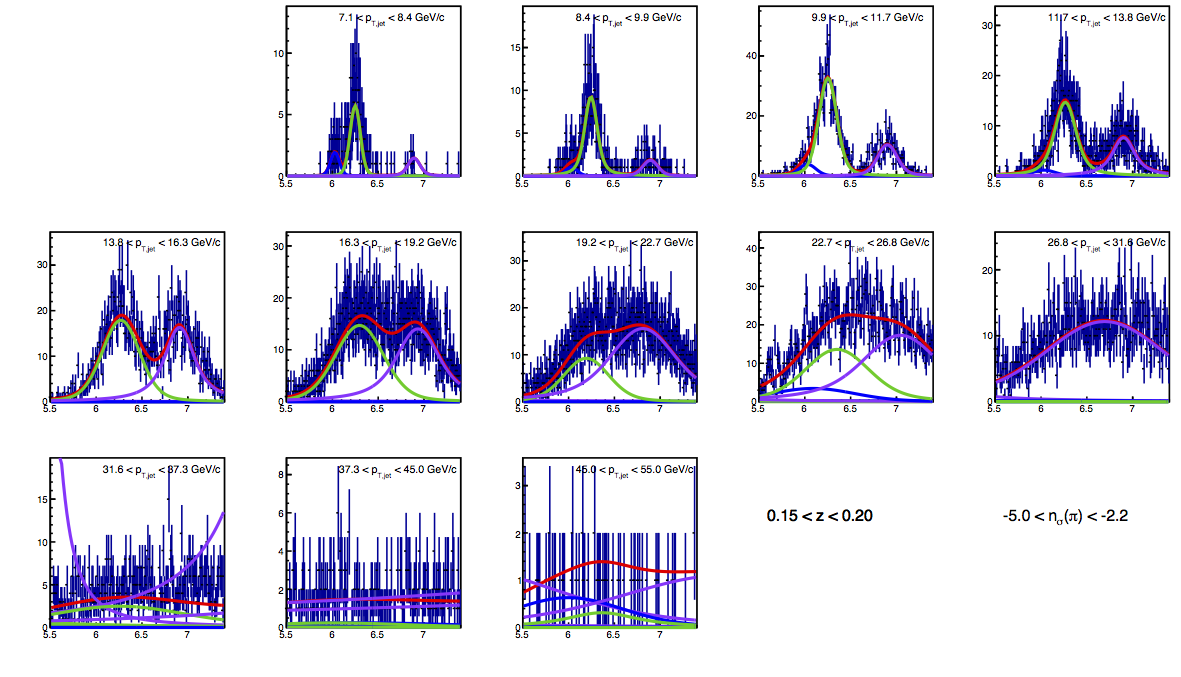 |
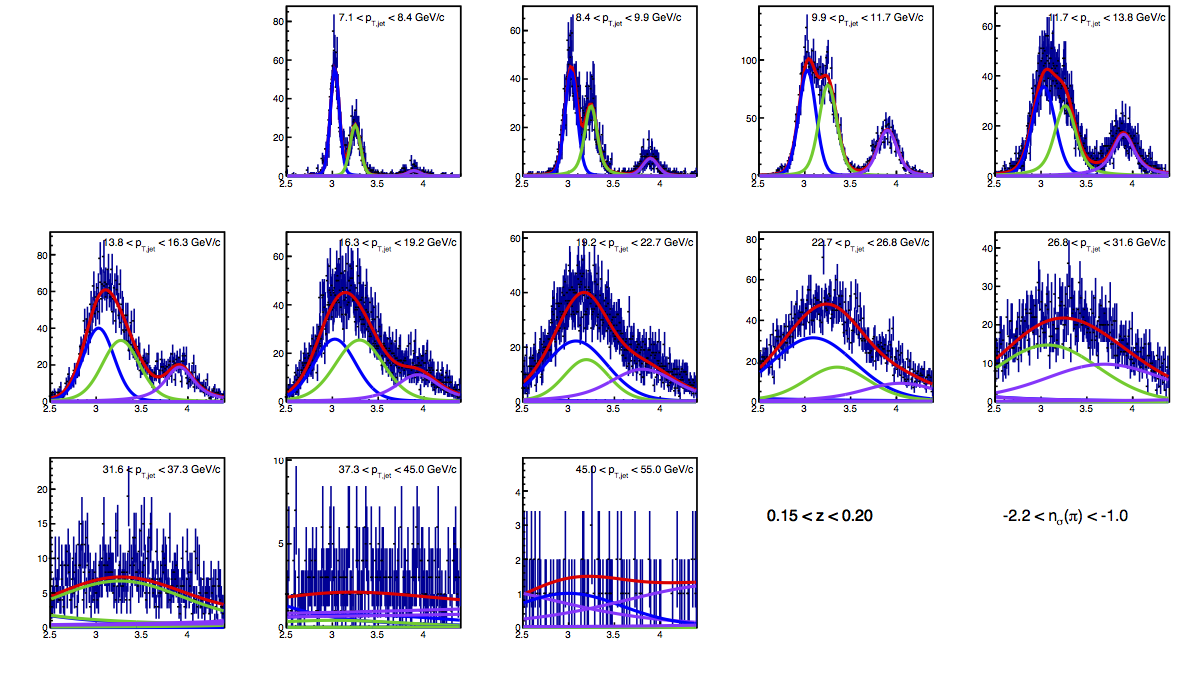
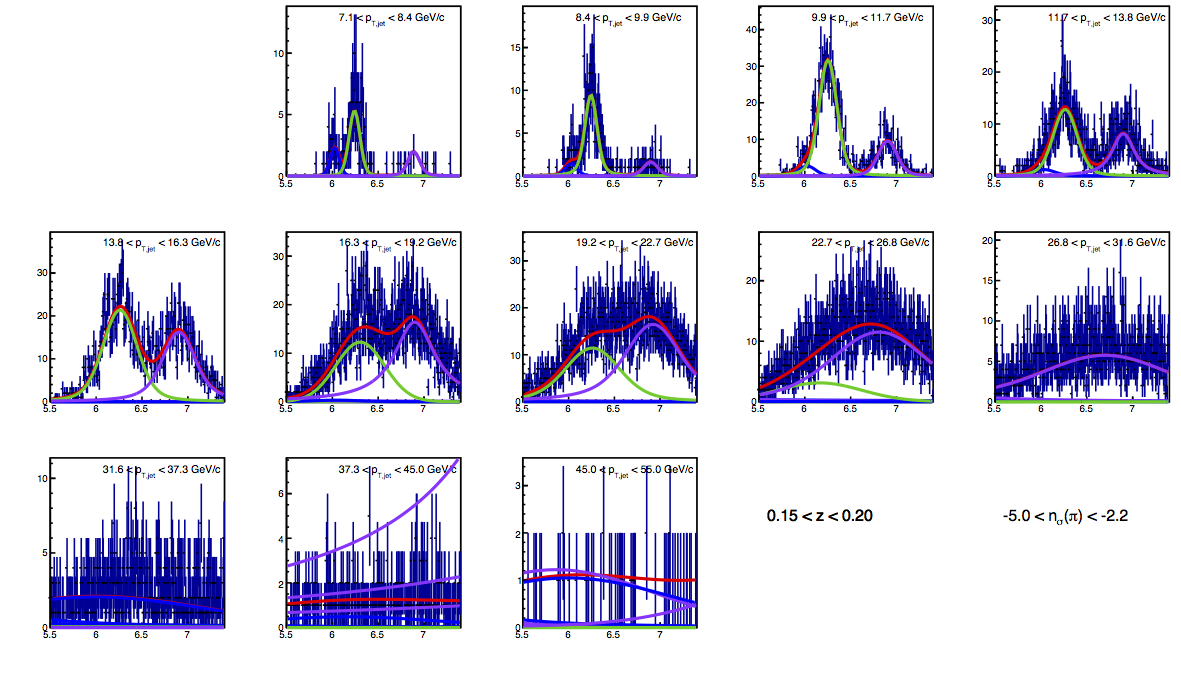
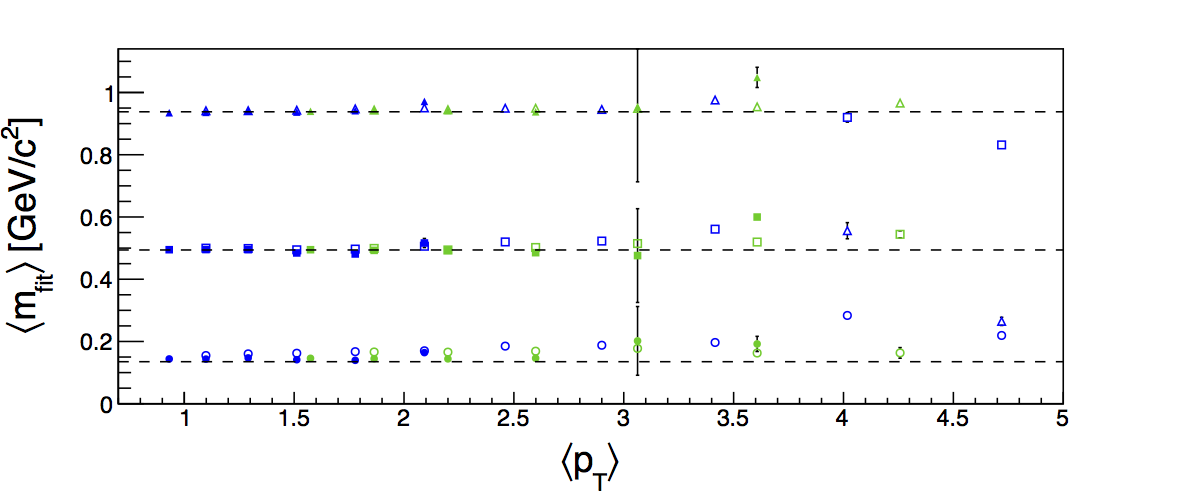
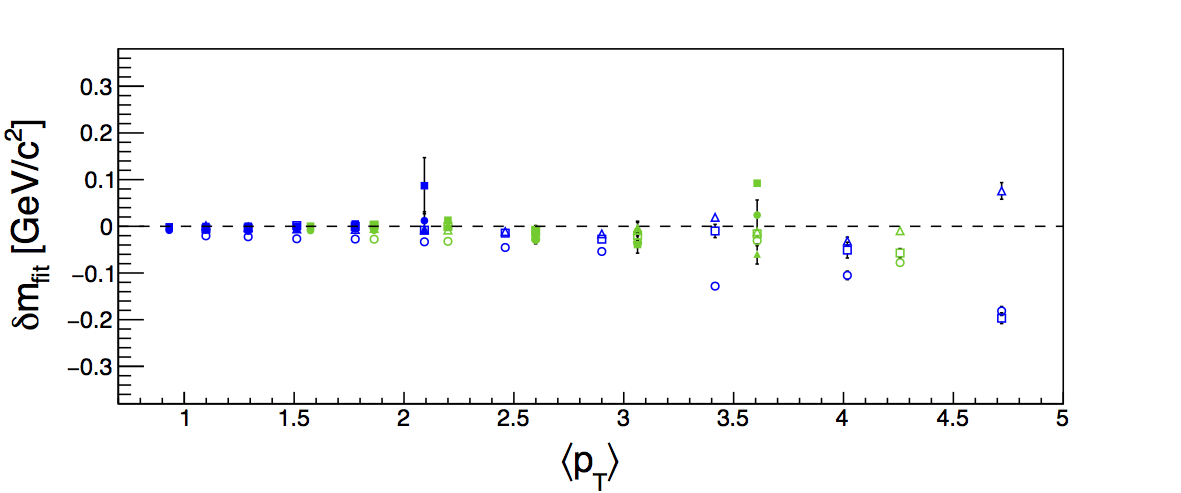
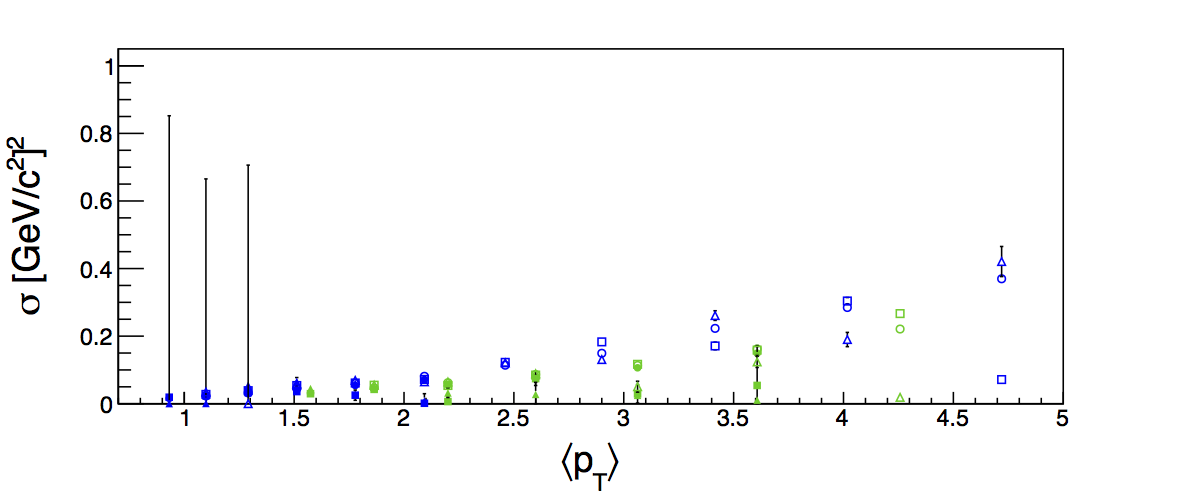
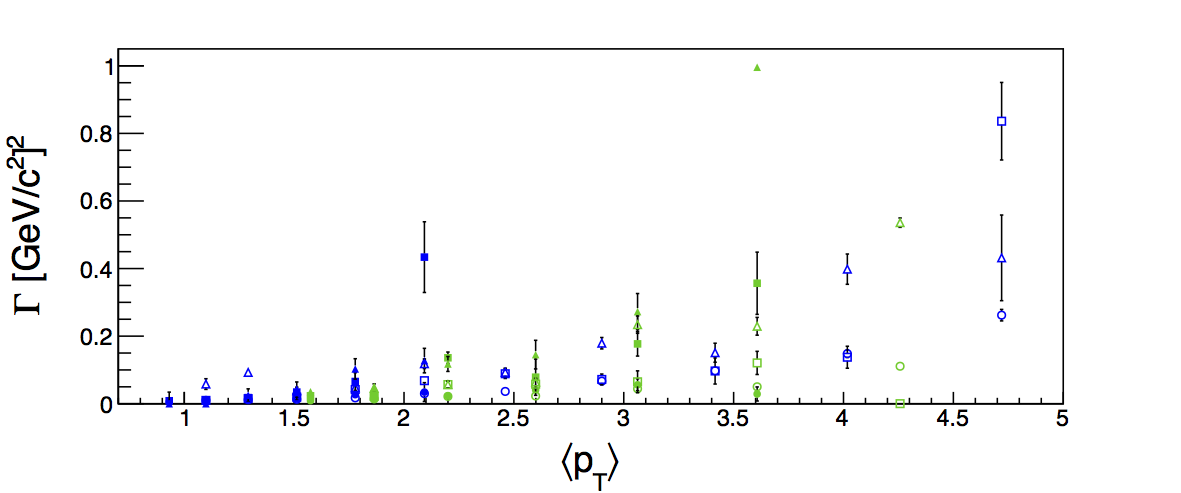
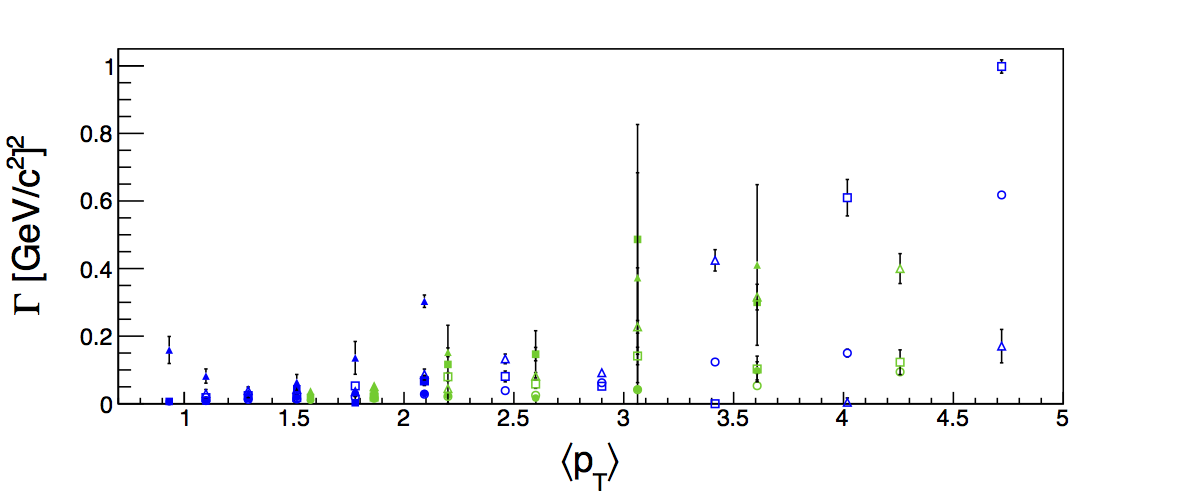
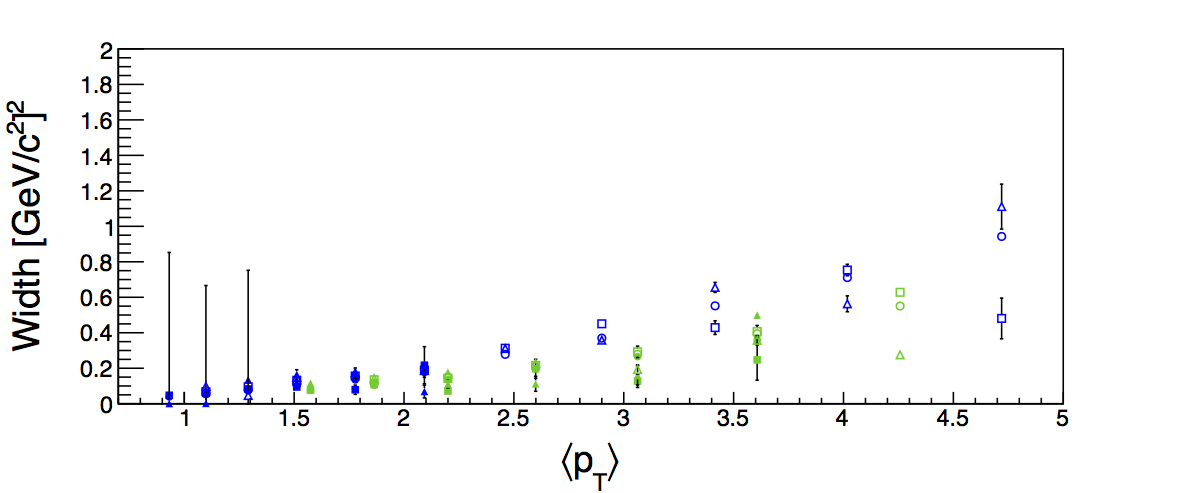
The TOF color scheme is also the same as used in the previous blog post: blue = pions (really, pions+electrons), green = kaons, violet = protons. NOTE: This is different than the color scheme used for the dE/dx fits used in Fig. 1 (sorry!). The new matching and vertex requirements do improve the comparison between VPDMB and JP triggers, though some difference still remains. Furthermore, the discrepancy between dE/dx and TOF in the overlapping bins remains (see Tables 1-2). My gut still tells me this is a result of overestimating the kaon contamination in TOF. As the pion peak resolution degrades, there is significant overlap between the pion and kaon peaks. The Voigt profile allows a longer tail on the distributions, and my intuition tells me that the fit wants to extend the Lorentzian tails on the kaon peak to fit the high-mass pion tail. I note that the fit tends to undershoot the low-mass tail of the pion peak; perhaps a hint that the kaon width or even amplitude is too large.
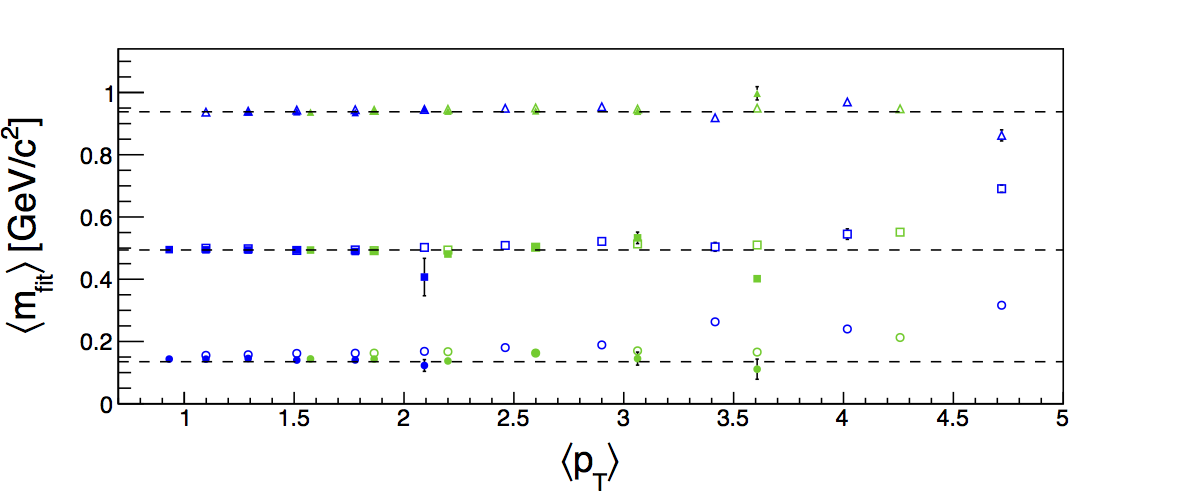
Figure 7: Centroids and Deviations
| Positive Charge |
Negative Charge |
 |
 |
 |
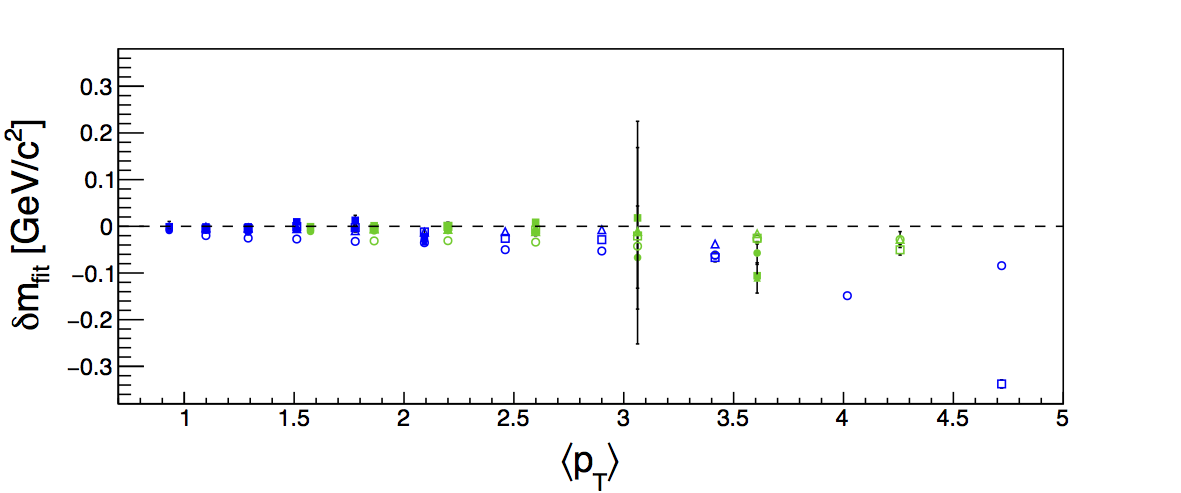 |
Figure 8: Sigmas, Gammas, and Total Widths
| Positive Charge |
Negative Charge |
 |
 |
 |
 |
 |
 |
Table 1: π-rich Fractions for 0.1 < z < 0.15
| pT Range [GeV/c] |
dE/dx π+ Fracs |
TOF π+ Fracs |
dE/dx π- Fracs |
TOF π- Fracs |
| 6-7.1 |
0.6565±0.0052 |
0.8996±0.0097 |
0.6727±0.0030 |
0.8913±0.0096 |
| 7.1-8.4 |
0.1841±0.0019 |
0.8886±0.0091 |
0.2410±0.0018 |
0.8794±0.0091 |
| 8.4-9.9 |
0.8641±0.0058 |
0.862±0.010 |
0.8708±0.0070 |
0.857±0.010 |
| 9.9-11.7 |
0.8647±0.0027 |
0.844±0.018 |
0.8809±0.0028 |
0.834±0.014 |
| 11.7-13.8 |
0.366±0.027 |
0.8320±0.0065 |
0.304±0.032 |
0.8380±0.0066 |
| 13.8-16.3 |
0.9498±0.0079 |
0.8510±0.0092 |
0.9250±0.0078 |
0.8597±0.0088 |
| 16.3-19.2 |
0.9407±0.0000 |
0.837±0.010 |
0.9295±0.0021 |
0.8455±0.0098 |
| 19.2-22.7 |
0.94484±0.00033 |
0.831±0.012 |
0.9424±0.0013 |
0.82860±0.00066 |
| 22.7-26.8 |
0.9654±0.0012 |
0.9537±0.0093 |
0.9594±0.0012 |
0.824±0.017 |
| 26.8-31.6 |
0.9653±0.0011 |
0.86096±0.00051 |
0.9636±0.0011 |
0.92992±0.00047 |
| 31.6-37.3 |
0.9634±0.0014 |
0.92071±0.00054 |
0.9592±0.0014 |
0.03729±0.00034 |
| 37.3-45 |
0.9555±0.0020 |
0.31791±0.00063 |
0.9562±0.0021 |
0.03081±0.00075 |
| 45-55 |
0.9469±0.0042 |
-0.0122±0.00154 |
0.9528±0.0038 |
-0.0189±0.0012 |
Table 2: π-rich Fractions for 0.15 < z < 0.2
| pT Range [GeV/c] |
dE/dx π+ Fracs |
TOF π+ Fracs |
dE/dx π- Fracs |
TOF π- Fracs |
| 6-7.1 |
0.8836±0.0035 |
0.8152±0.0093 |
0.8715±0.0078 |
0.8000±0.0091 |
| 7.1-8.4 |
0.8688±0.0016 |
0.8043±0.0096 |
0.8420±0.0040 |
0.7809±0.0092 |
| 8.4-9.9 |
0.263±0.037 |
0.8079±0.0088 |
0.204±0.036 |
0.7733±0.0082 |
| 9.9-11.7 |
0.8988±0.0066 |
0.825±0.015 |
0.8920±0.0017 |
0.816±0.012 |
| 11.7-13.8 |
0.9320±0.0030 |
0.862±0.013 |
0.9127±0.0040 |
0.87068±0.00034 |
| 13.8-16.3 |
0.9458±0.0033 |
0.83833±0.00088 |
0.9409±0.0032 |
0.836±0.022 |
| 16.3-19.2 |
0.9572±0.0013 |
0.86455±0.00009 |
0.9503±0.0015 |
0.77805±0.00009 |
| 19.2-22.7 |
0.9598±0.0010 |
0.9434±0.0013 |
0.9538±0.0012 |
0.93660±0.00066 |
| 22.7-26.8 |
0.9562±0.0011 |
0.44992±0.00061 |
0.9526±0.0012 |
0.92168±0.00053 |
| 26.8-31.6 |
0.9508±0.0014 |
0.88958±0.00051 |
0.9503±0.0015 |
0.18836±0.00047 |
| 31.6-37.3 |
0.9481±0.0020 |
0.963±0.028 |
0.9437±0.0020 |
0.30867±0.00034 |
| 37.3-45 |
0.9410±0.0040 |
0.00214±0.00063 |
0.9403±0.0033 |
0.73603±0.00075 |
| 45-55 |
0.9445±0.0074 |
0.524±0.029 |
0.9497±0.0074 |
0.3656±0.0012 |


