Run-11 Transverse Jets: Digging Deeper into TOF-dE/dx Comparisons (Part II)
Carl points out one potential issue with the TOF fits. In regions where the kaon and proton peaks are best constrained, the statistics are low enough that the Gaussian assumption is invalid. Therefore, the fits would be best executed using the log-likelihood flag. One clear indication this is the case is the propensity for the previous fits to undershoot the datapoints in the kaon and proton-rich nσ(π) regions. In the process of implementing this change, I discovered another potential issue: many of the fits at higher pT fail to converge normally. This could result in an unreliable estimation of the fit uncertainties. More detail is given below.
TOF PID Fits
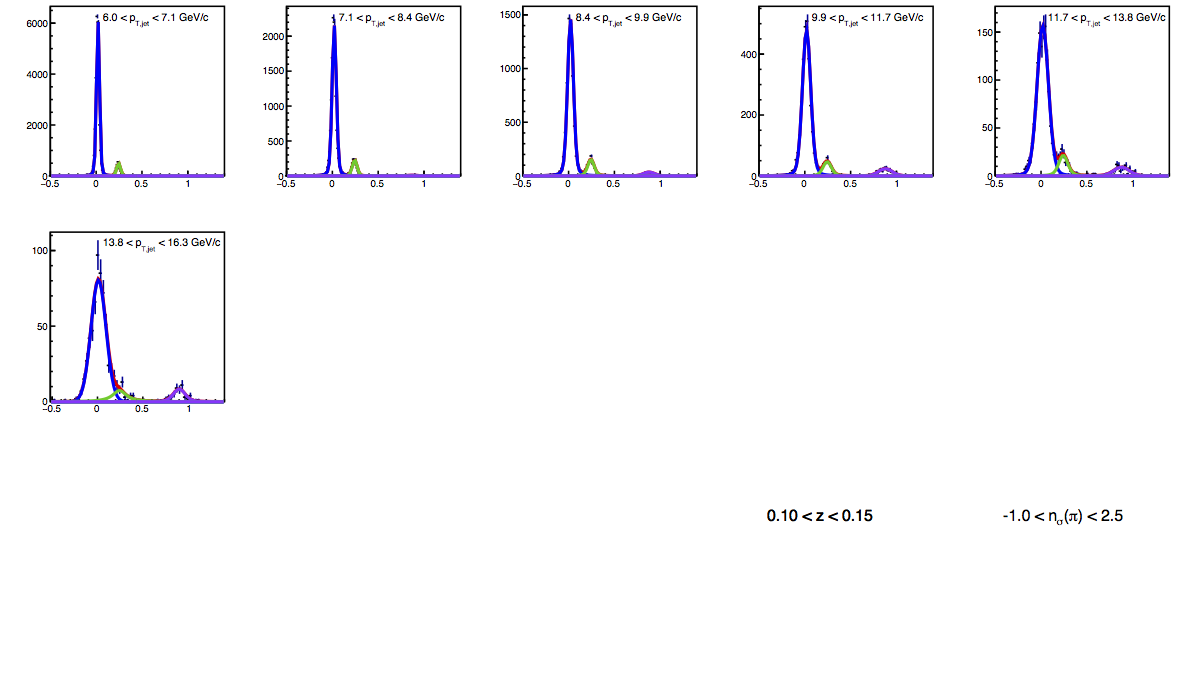
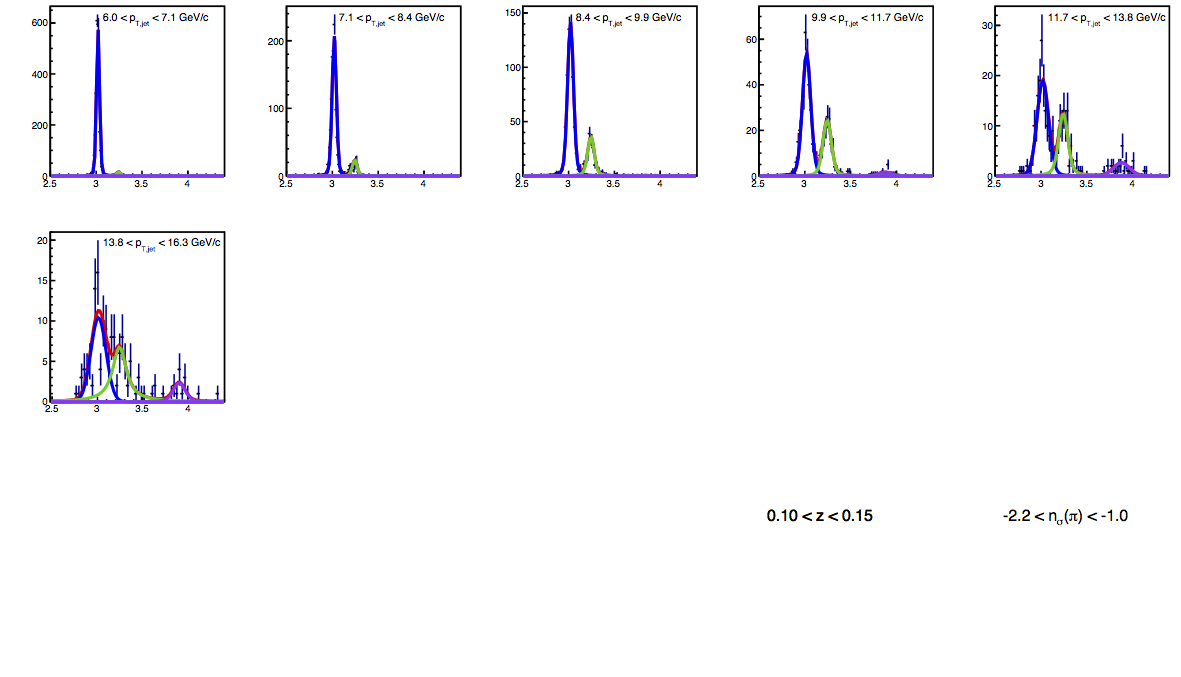
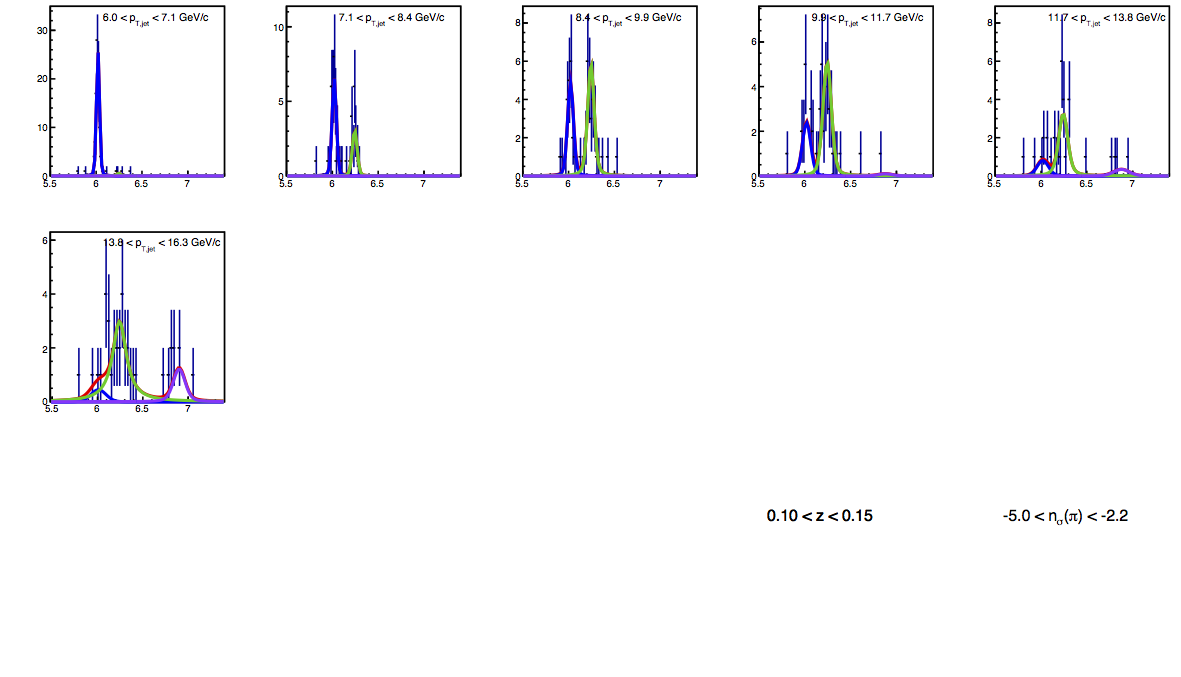
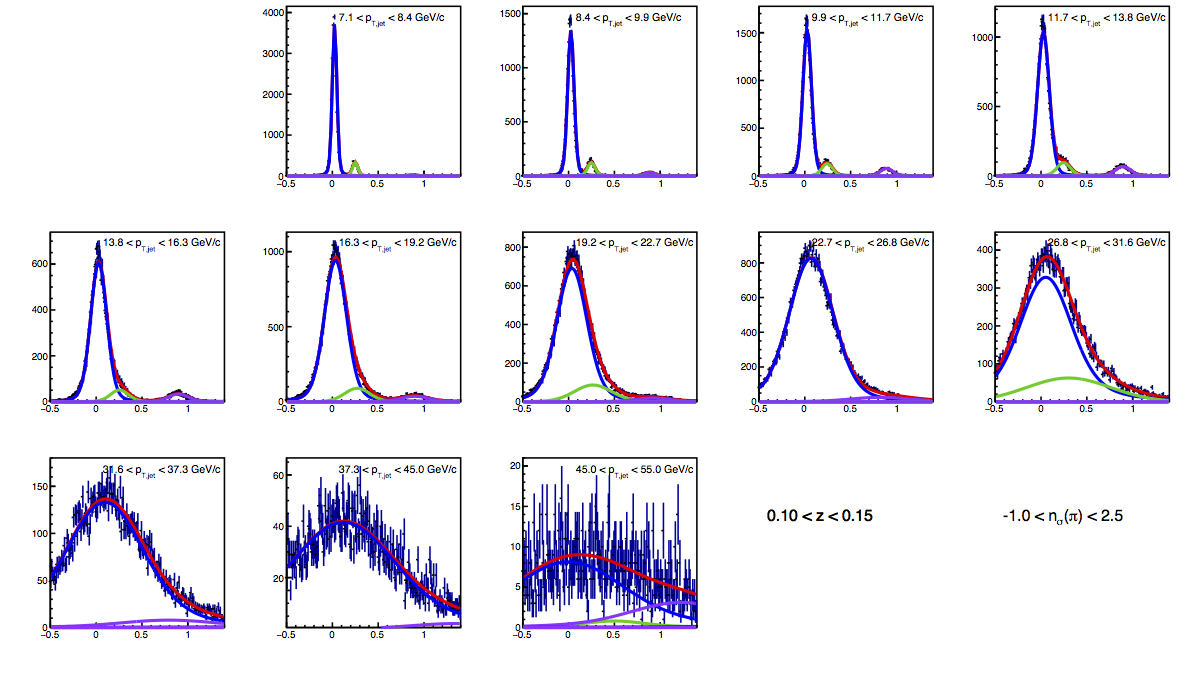
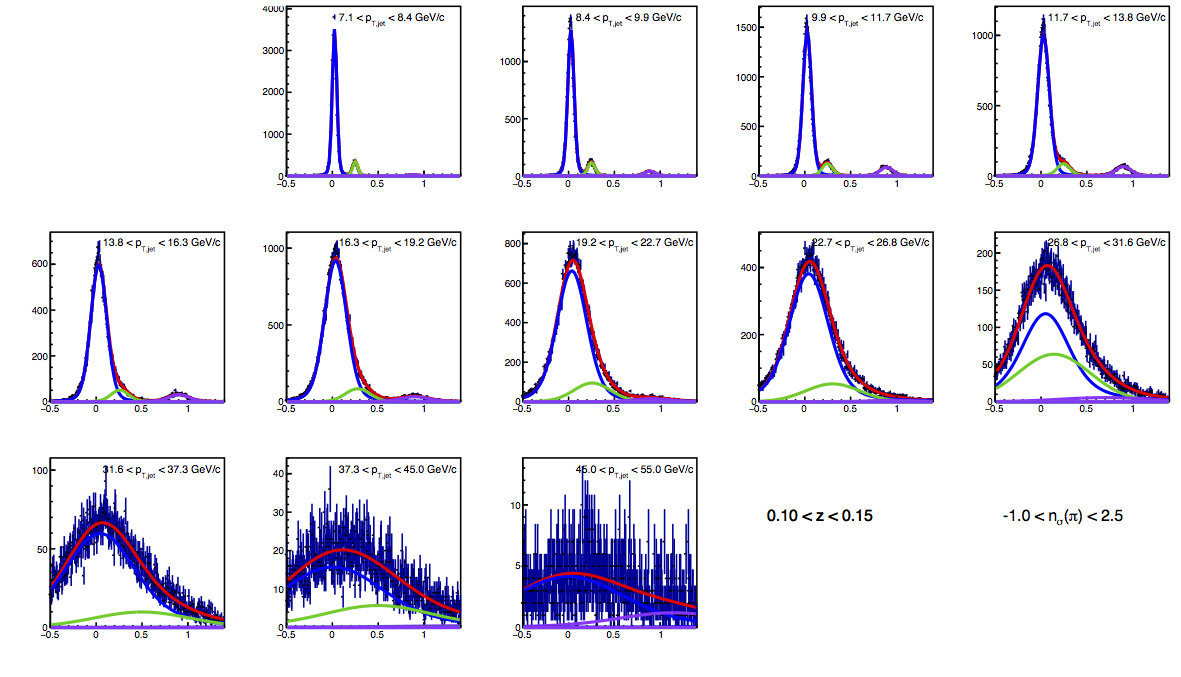
In the following figures, I show the updated fits using the log-likelihood method. One may notice the fits do a much better job of passing through the middle of the datapoint scatter.
Figure 1: VPDMB TOF PID Fits for 0.1 < z < 0.15
| Positive Charge | Negative Charge |
 |
 |
 |
 |
 |
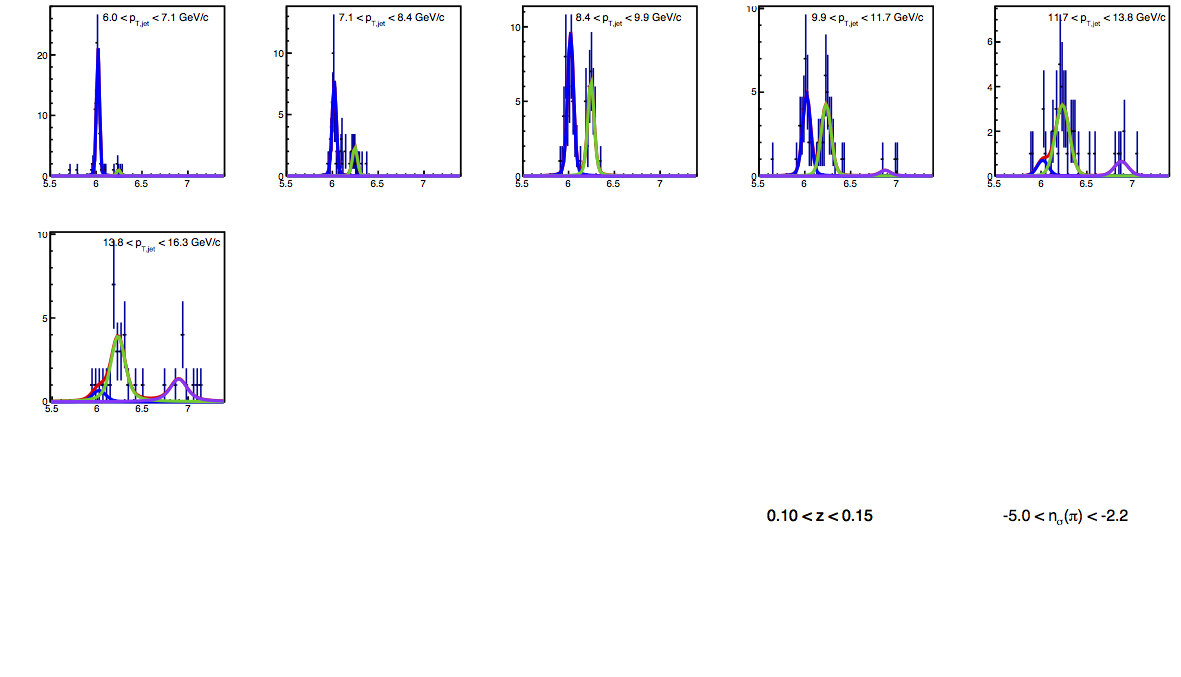 |
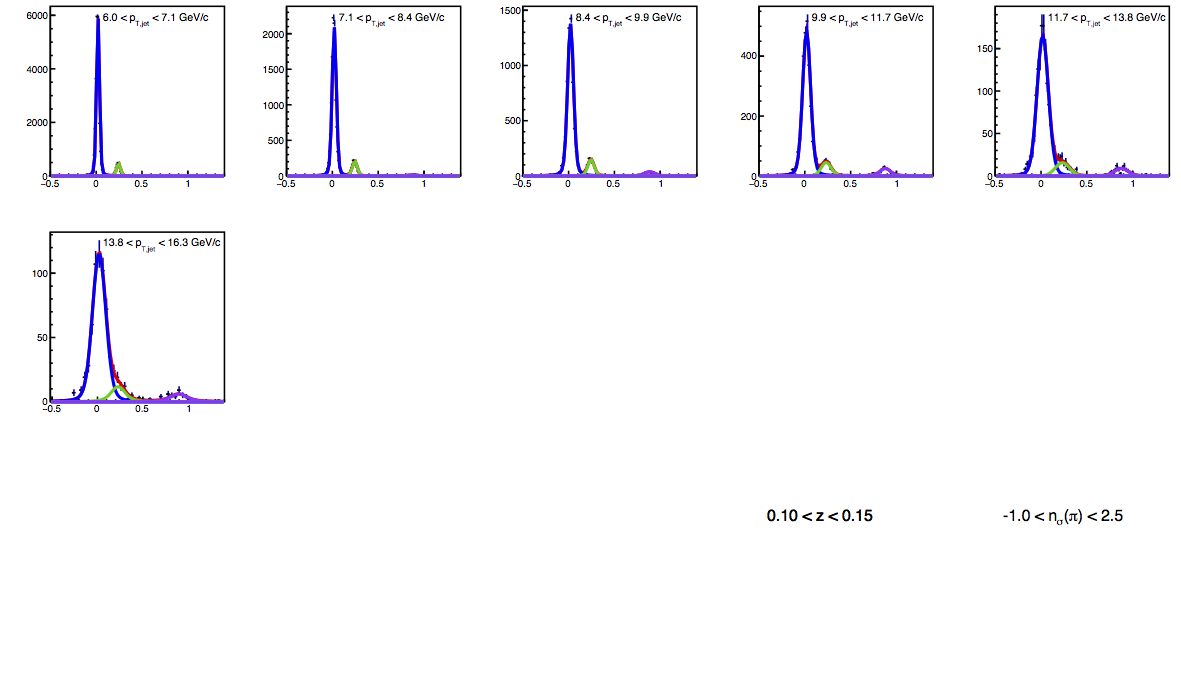
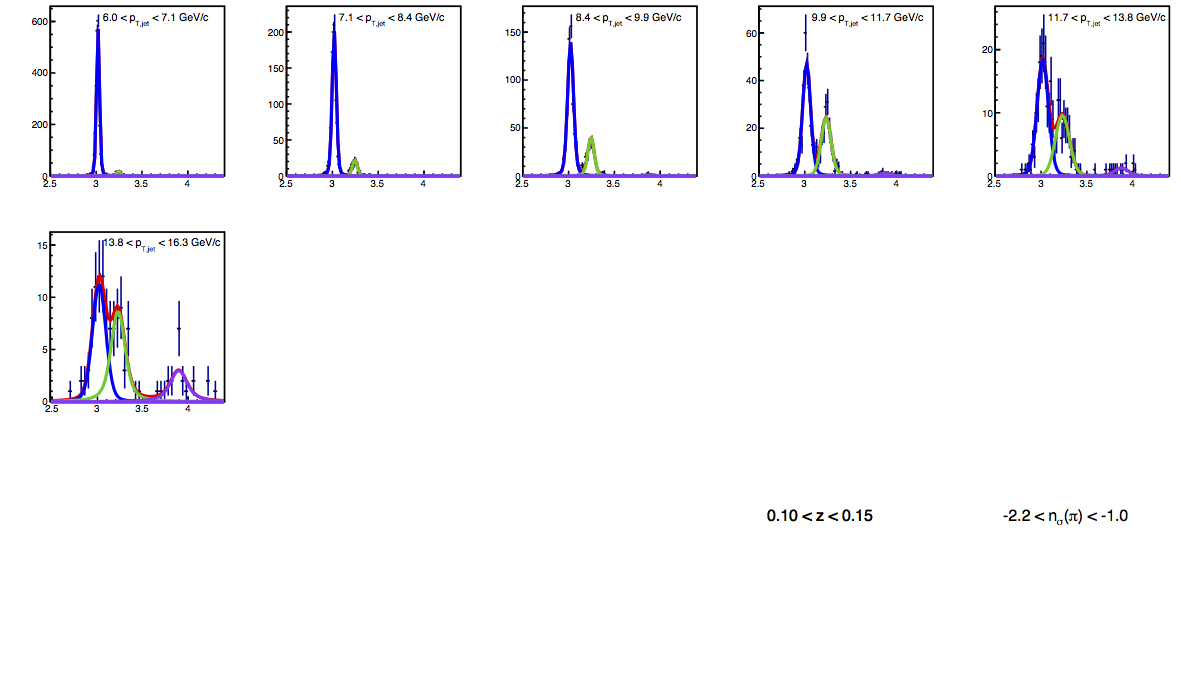
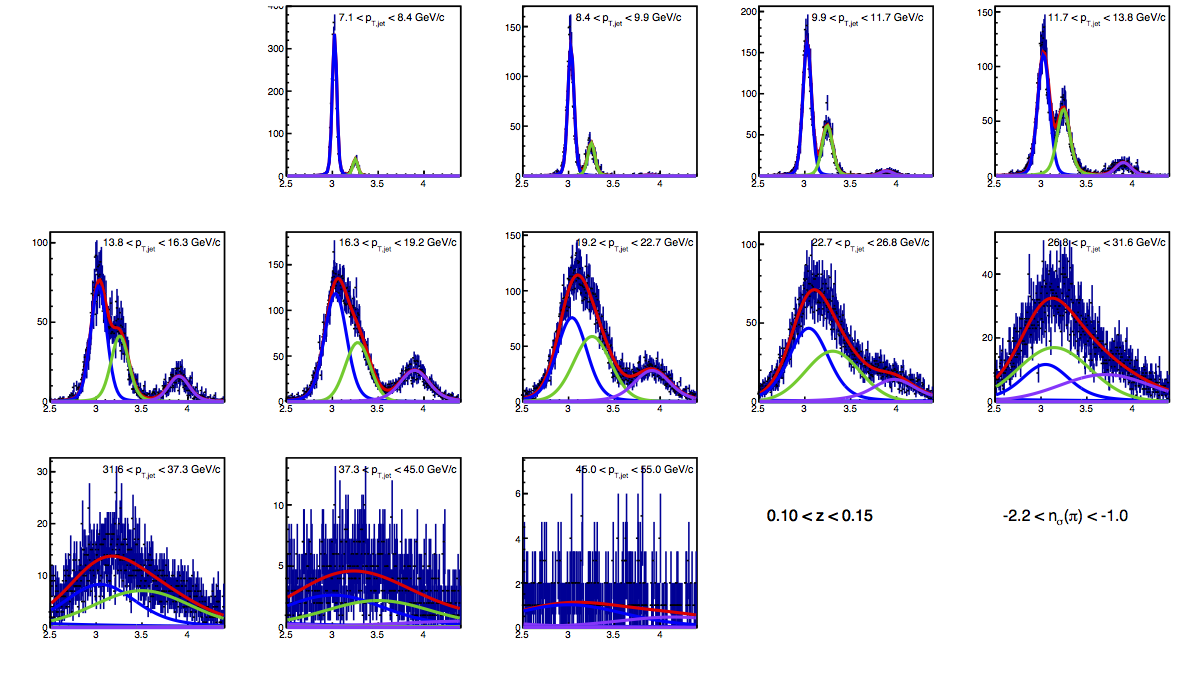
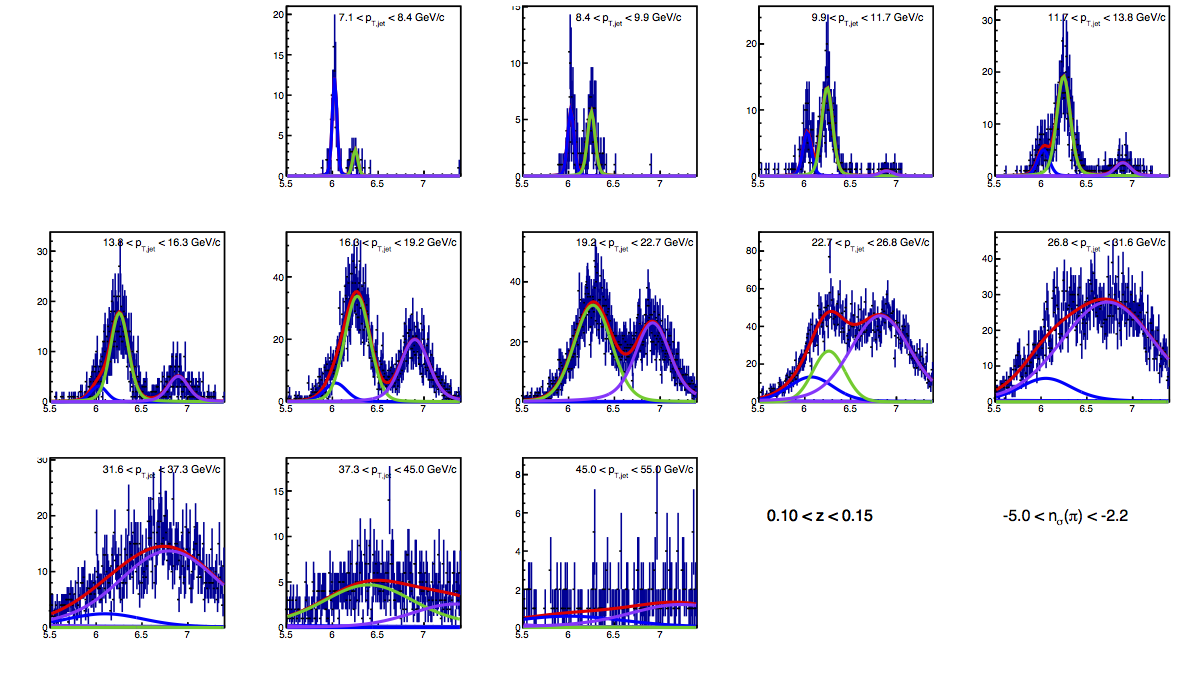
Figure 2: JP TOF PID Fits for 0.1 < z < 0.15
| Positive Charge | Negative Charge |
 |
 |
 |
 |
 |
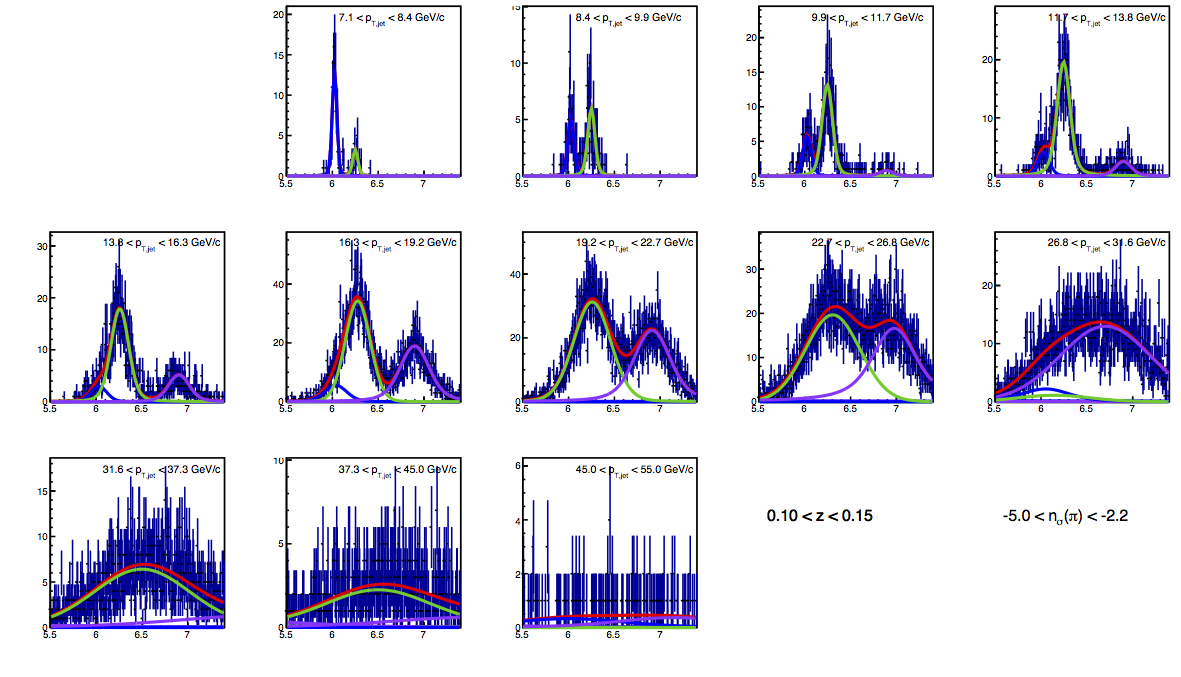 |
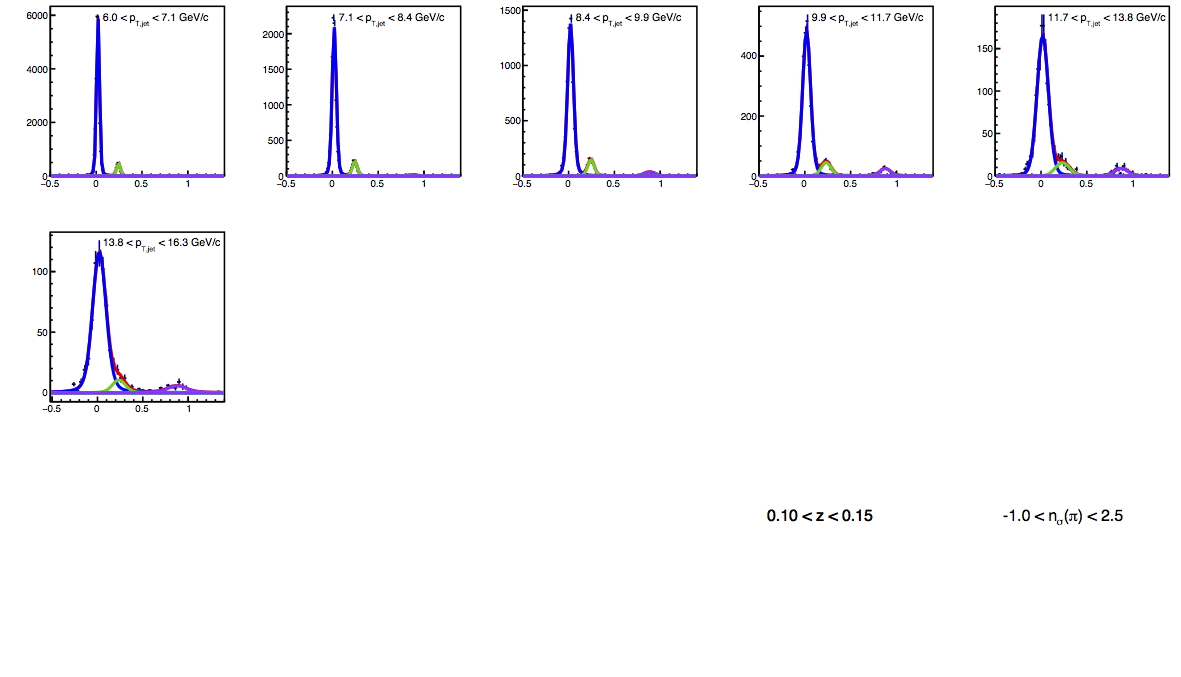
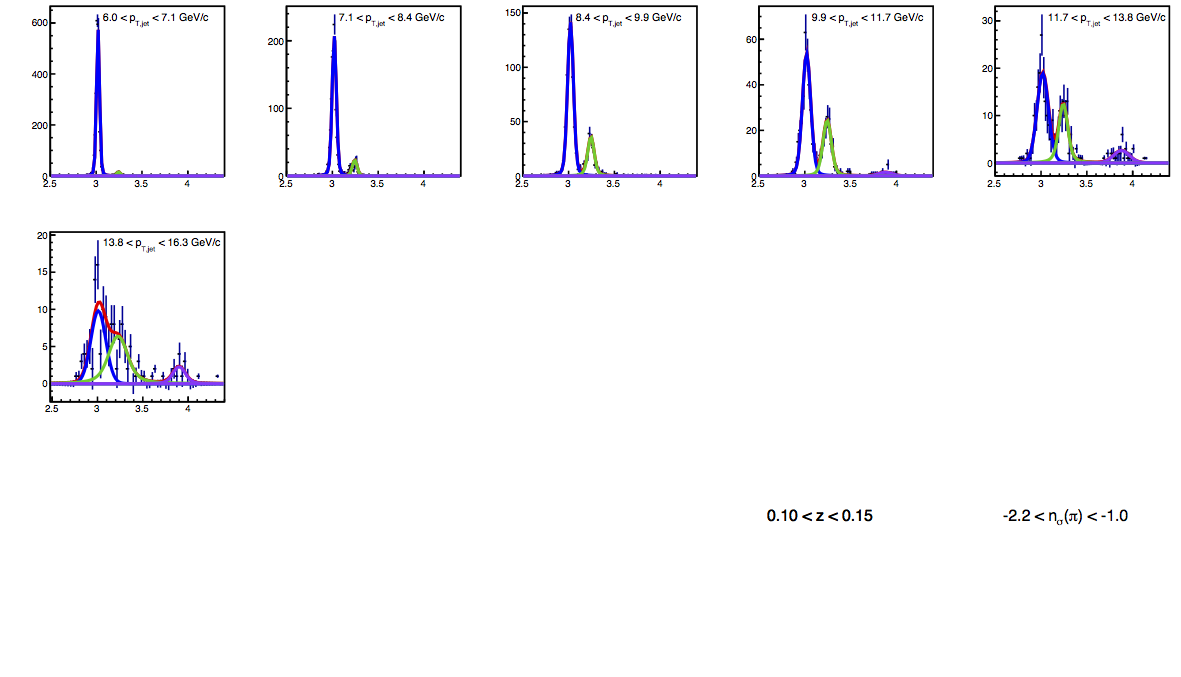
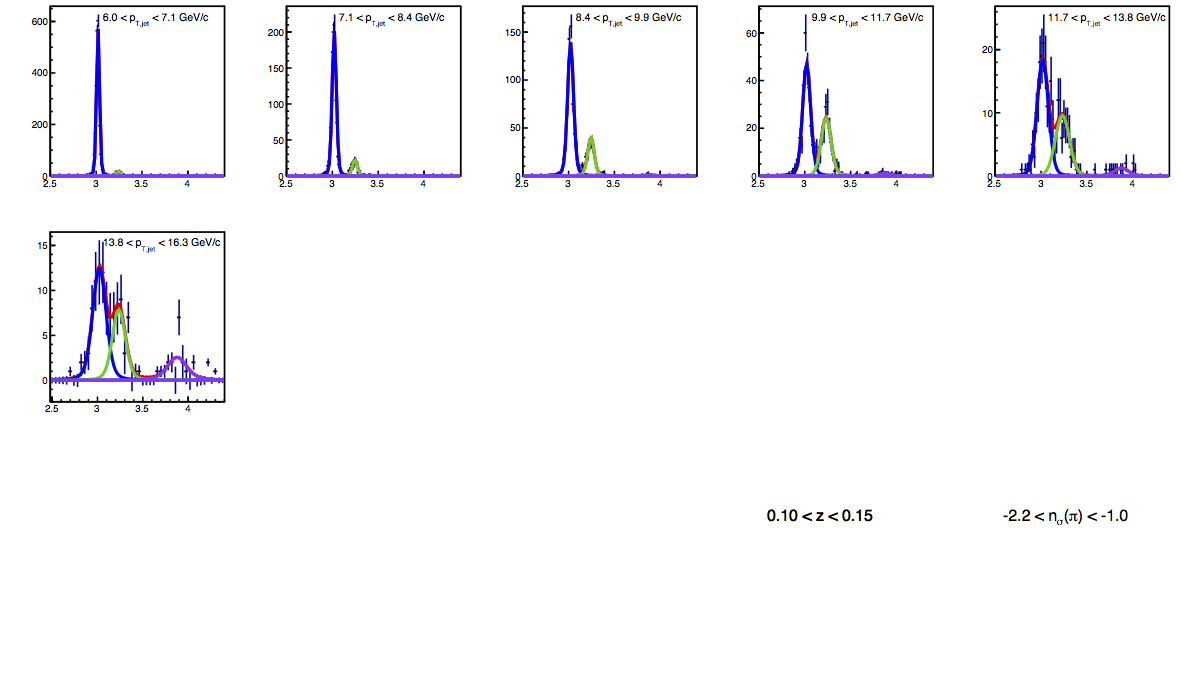
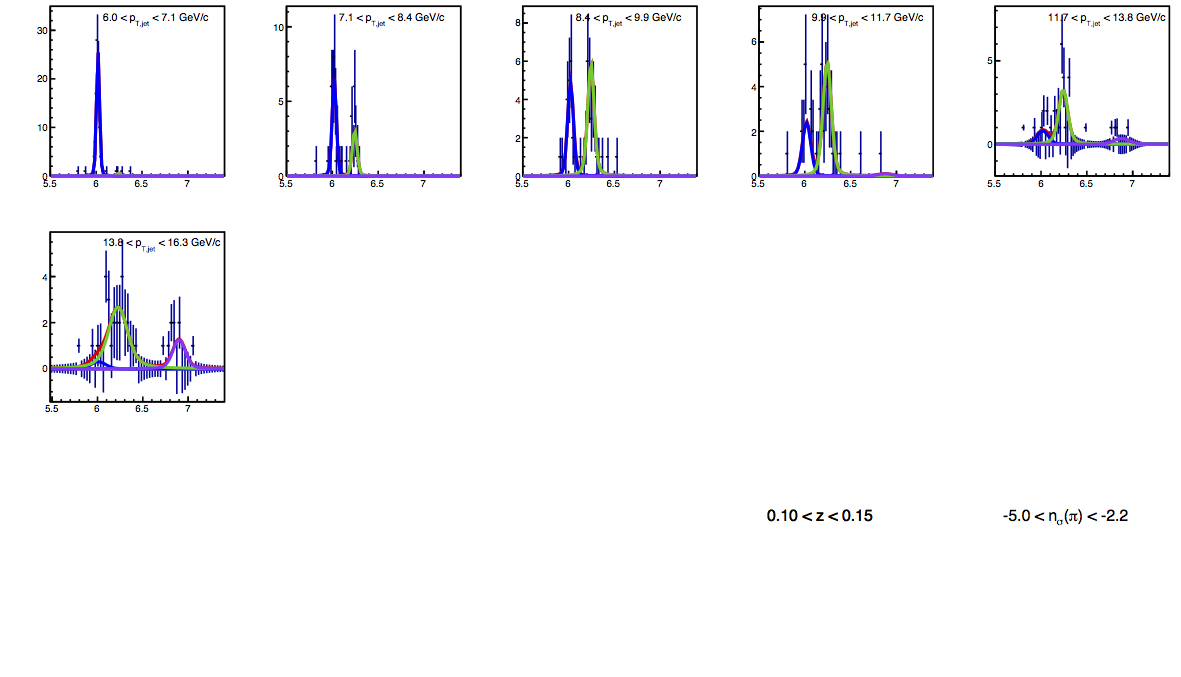
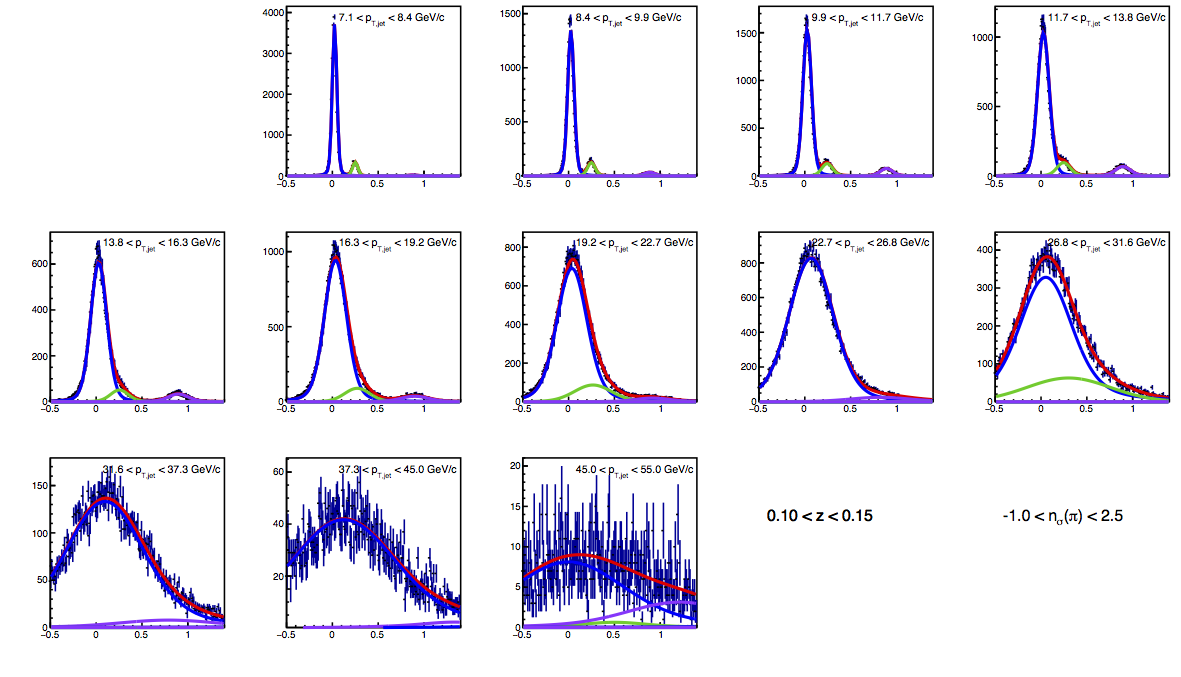
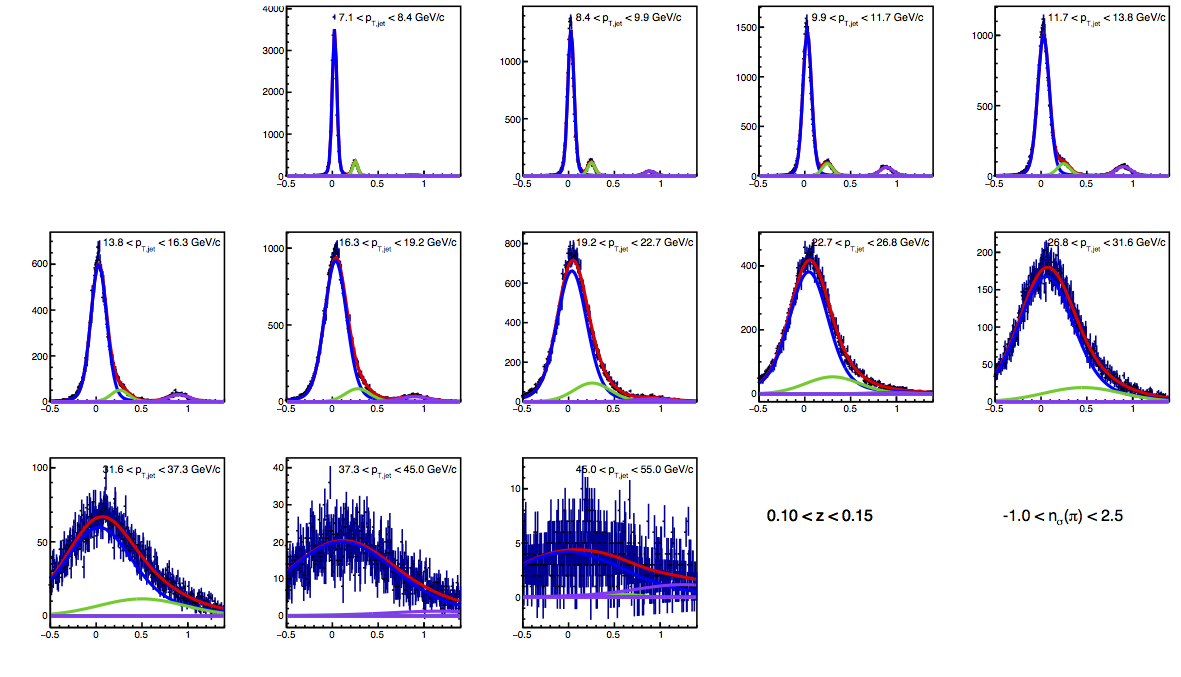
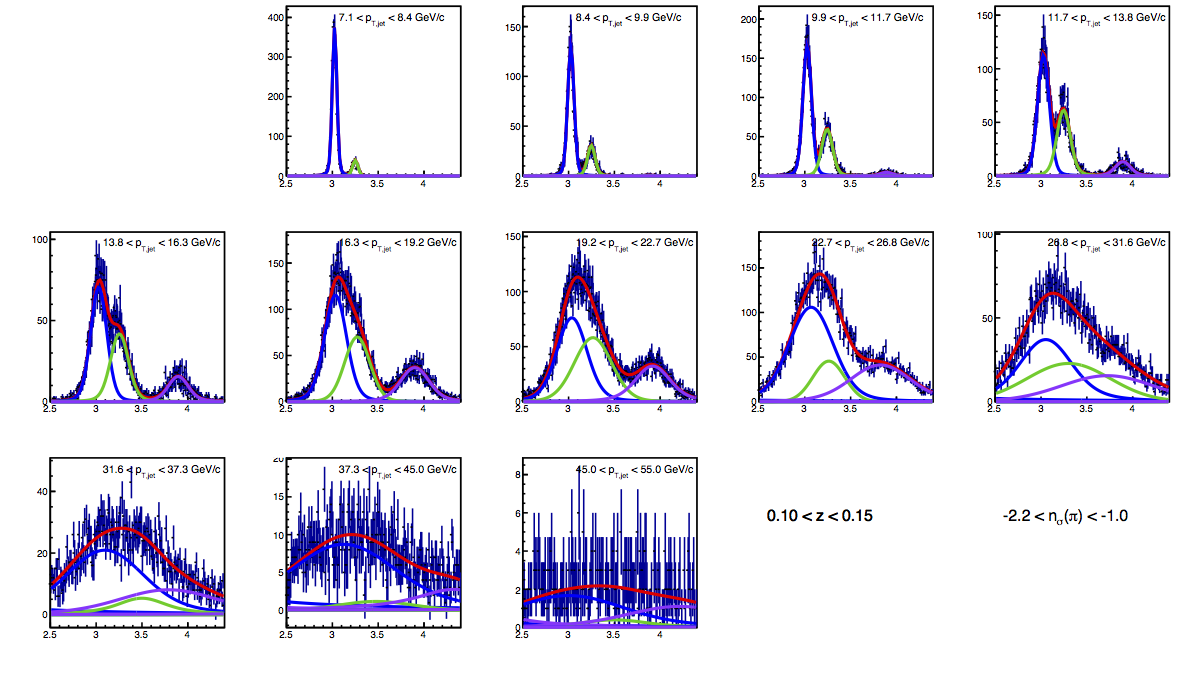
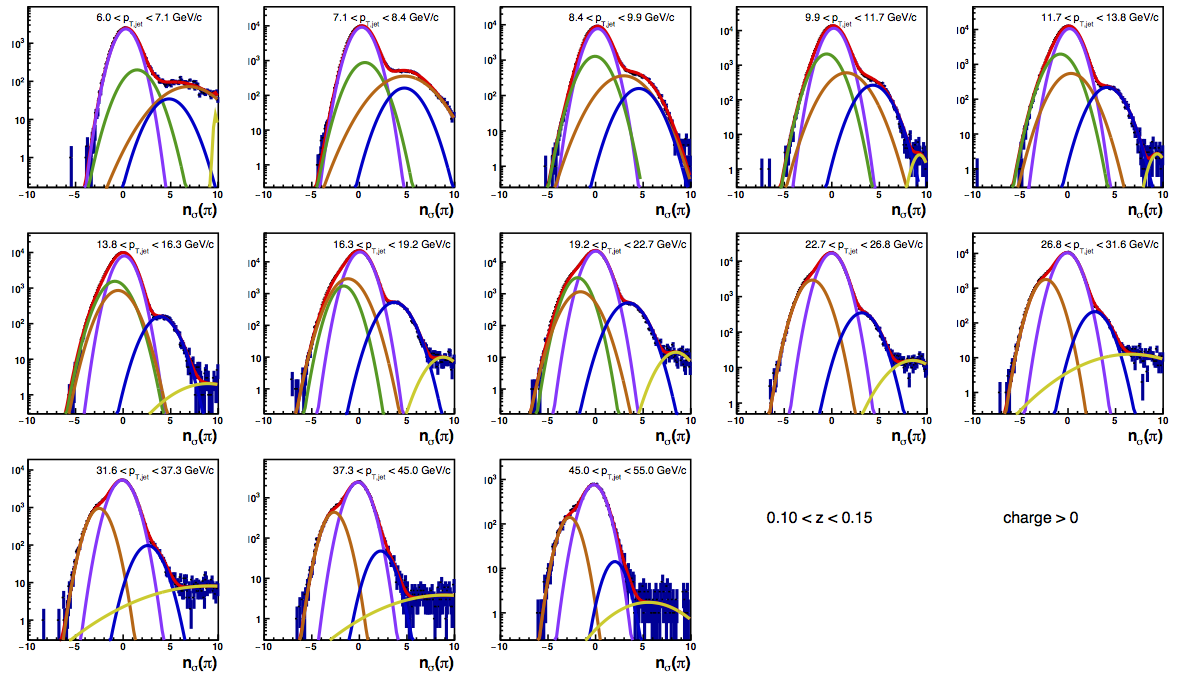
The TOF color scheme is also the same as used in the previous blog post: blue = pions (really, pions+electrons), green = kaons, violet = protons. In general the fits look improved over the previous set, however, in several cases, the fits do not properly converge. So, while the curves likely give a decent description of the data, issues may remain with the associated uncertainties.
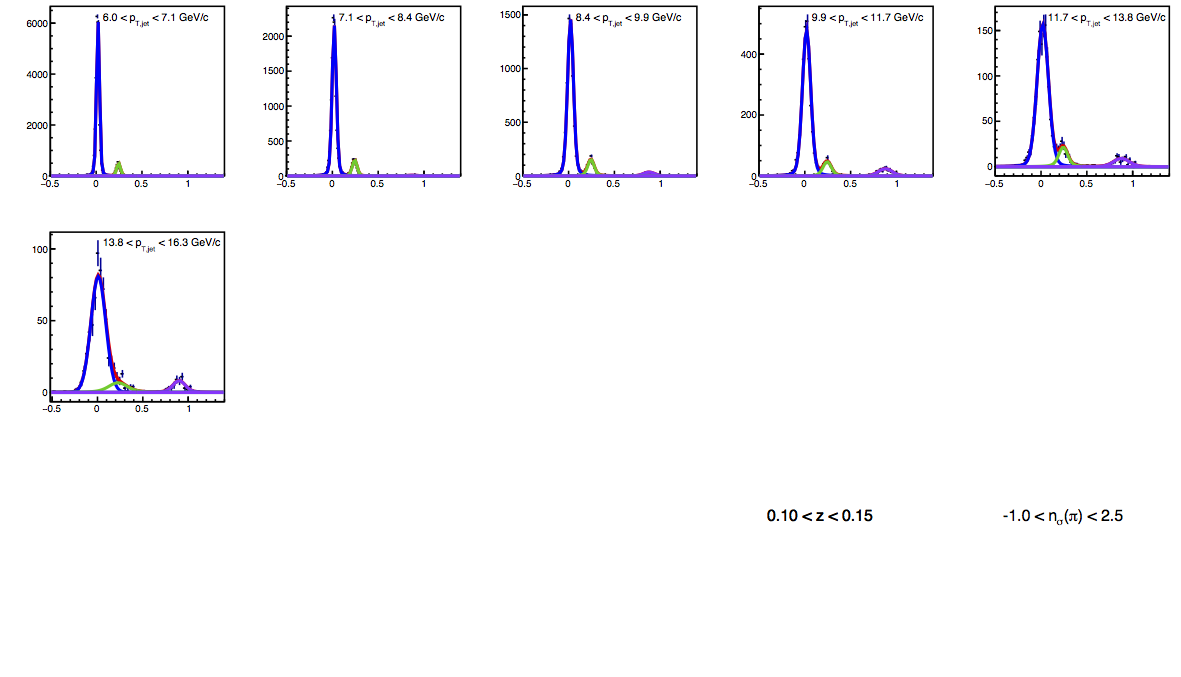
To address this issue, I edited the code to refit the data if the status returned is not 0, i.e. convergence. If the initial fit does not converge, I repeat the log-likelihood fit, adding the "M" flag for the Minuit "improve" command. If this fit also failes, I perform an iterative procedure for using "analytic" uncertainties. I replace all uncertainties with the square root of the previous fit function value at the bin location, including bins with no counts. I refit with the standard χ2 method. I repeat the uncertainty replacement procedure and refit. If this fit converges, I exit, otherwise I try one more iteration. In all cases, the fit returns a status = 0, though, it should be noted that several first derivatives still return values of "at limit." Results are shown in Figs. 3-4 and reported in Table 1.
Figure 3: VPDMB TOF PID Fits for 0.1 < z < 0.15 with Analytic Errors
| Positive Charge | Negative Charge |
 |
 |
 |
 |
 |
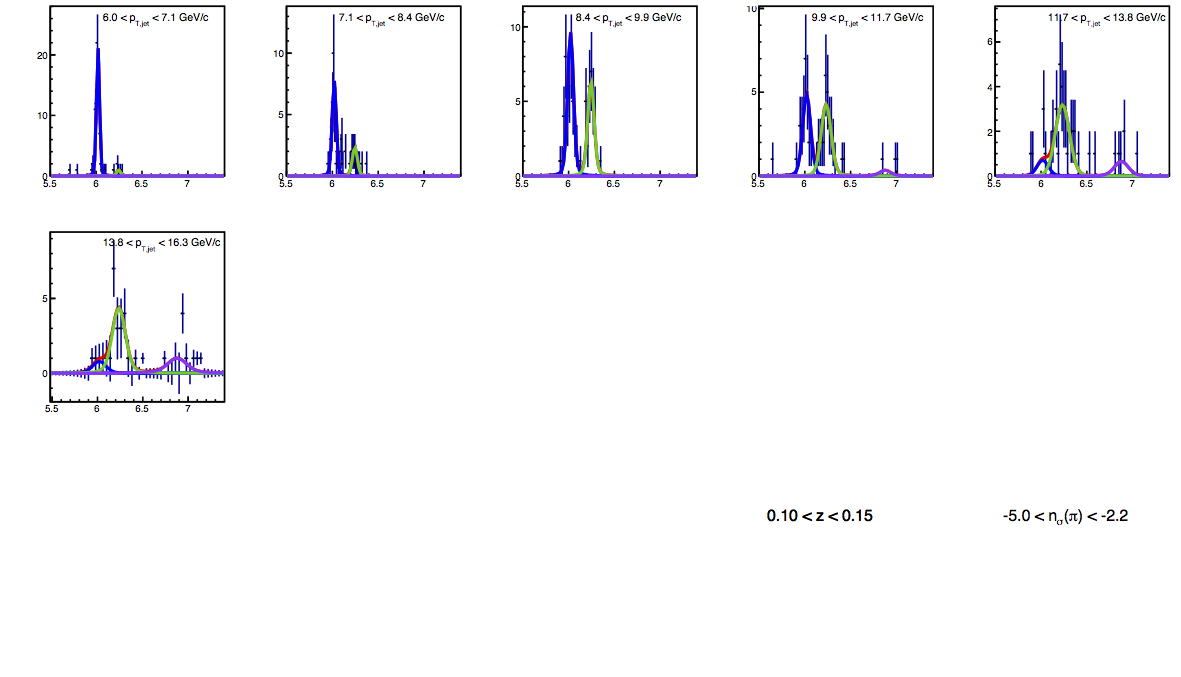 |
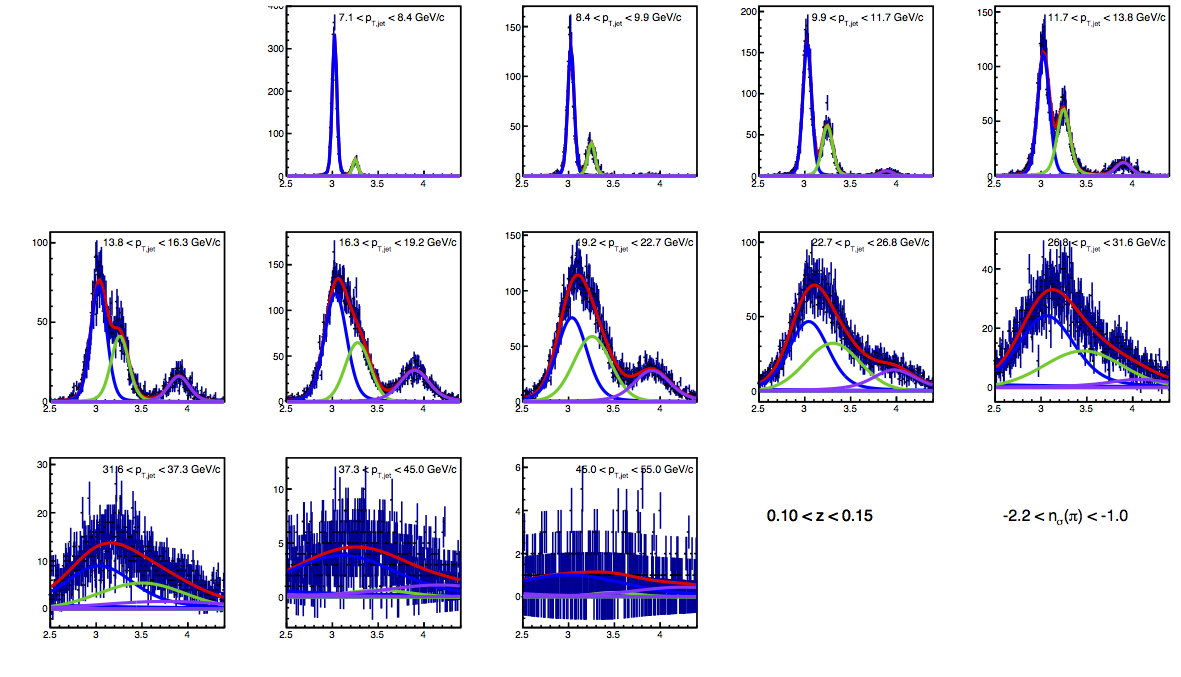
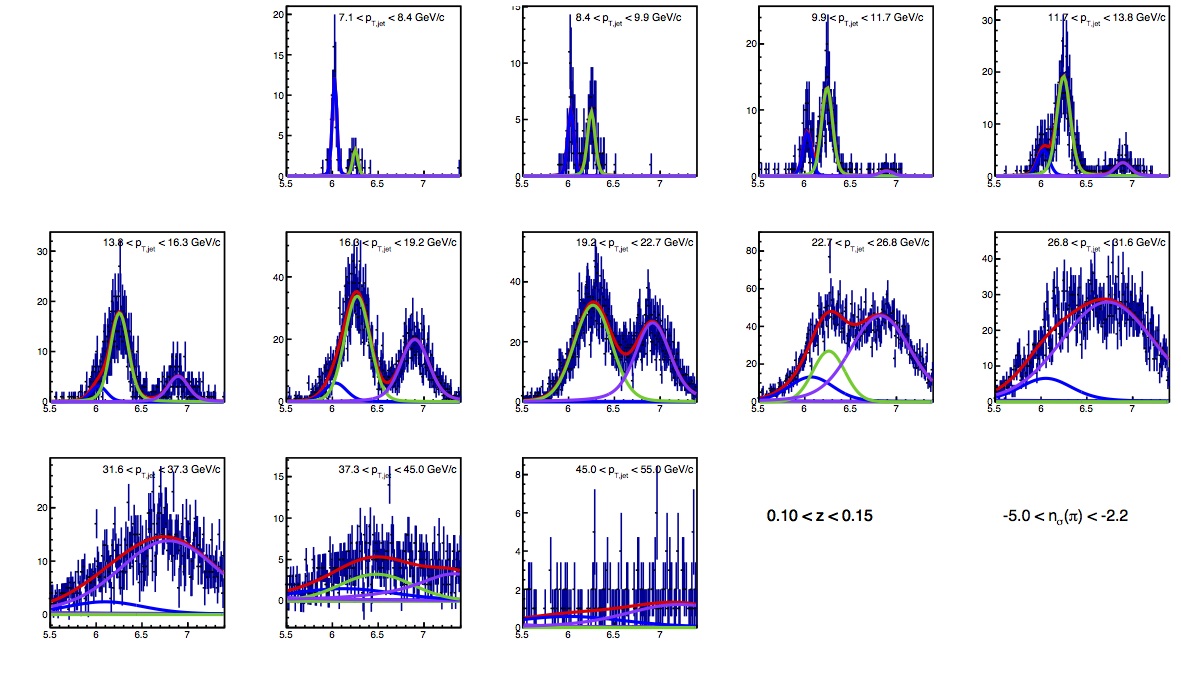
Figure 4: JP TOF PID Fits for 0.1 < z < 0.15 with Analytic Errors
| Positive Charge | Negative Charge |
 |
 |
 |
 |
 |
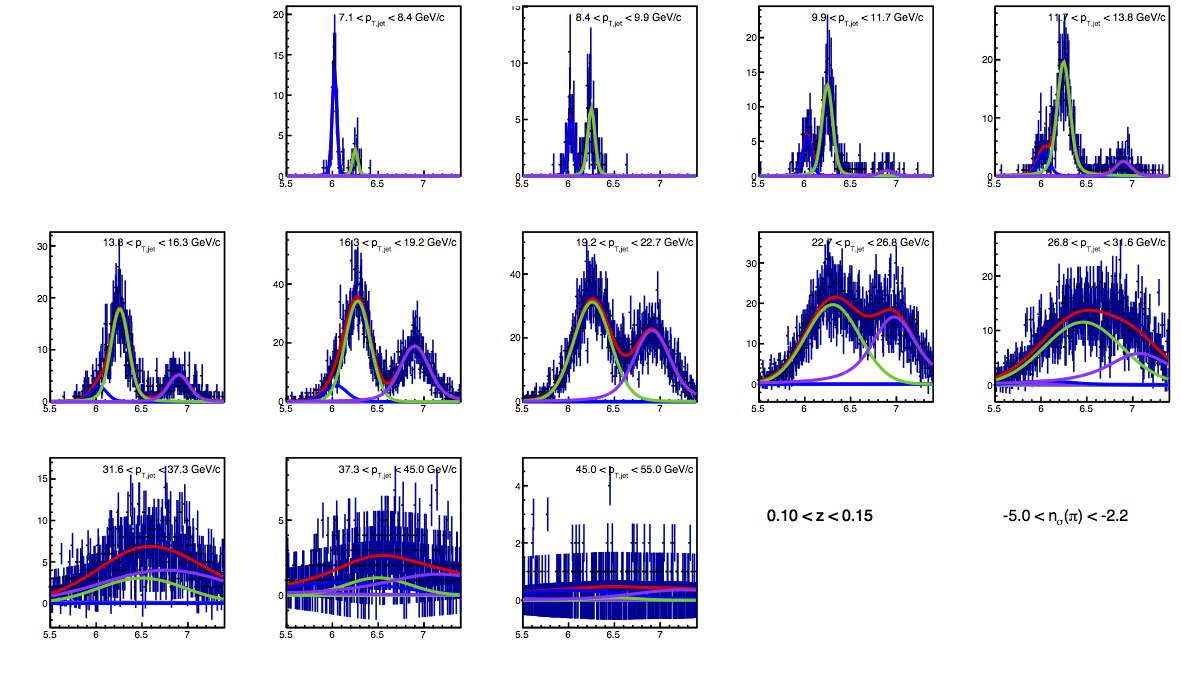 |
Using the normal χ2 minimization with the edited uncertainties the fits always converge after an iteration or two. However, in the following cases, at least one first derivative is "at limit":
- VPDMB 13.8-16.3 GeV/c: pi-rich pion integral (pos&neg) and proton gamma (pos)
- JP 22.7-26.8 GeV/c: kaon gamma and p-rich pion integral (neg)
- 26.8-31.6 GeV/c: pi-rich pion integral, pi-rich proton amplitude, and p-rich kaon amplitude (neg)
- 31.6-37.3 GeV/c: pi-rich kaon amplitude (pos), kaon centroid (pos&neg), kaon gamma (pos&neg), pi-rich proton integral (neg), p-rich pion integral (neg), and p-rich kaon integral (pos)
- 37.3-45 GeV/c: pion gamma (pos&neg), pi-rich kaon integral (pos&neg), kaon centroid (neg), kaon gamma (pos&neg), and proton gamma (pos&neg)
- 45-55 GeV/c: pion sigma, pion gamma, kaon centroid, kaon gamma, proton gamma (neg)
To check potential changes, I edited the procedure by using the analytic uncertainties with the log-likelihood fitting, allowing up to 5 iterations. In only one case is the central value substantially changed (26.8-31.6 GeV/c, negative, where the pion fraction goes from 0.86613±0.00047 to 0.92366±0.00047). In a few cases, the uncertainties for the above bins are increased by up to a factor of 2. While each fit eventually returns a status of "OK," the "at limit" messages are never resolved.
Table 1: π-rich Fractions for 0.1 < z < 0.15
| pT Range [GeV/c] | dE/dx π+ Fracs | TOF π+ Fracs | dE/dx π- Fracs | TOF π- Fracs |
| 6-7.1 | 0.6565±0.0052 | 0.89930±0.00959 | 0.6727±0.0030 | 0.89269±0.00953 |
| 7.1-8.4 | 0.1841±0.0019 | 0.88988±0.00922 | 0.2410±0.0018 | 0.88062±0.00961 |
| 8.4-9.9 | 0.8641±0.0058 | 0.85976±0.01049 | 0.8708±0.0070 | 0.85512±0.01023 |
| 9.9-11.7 | 0.8647±0.0027 | 0.84405±0.01826 | 0.8809±0.0028 | 0.83196±0.01344 |
| 11.7-13.8 | 0.366±0.027 | 0.83053±0.00811 | 0.304±0.032 | 0.83348±0.00843 |
| 13.8-16.3 | 0.9498±0.0079 | 0.84852±0.01154 | 0.9250±0.0078 | 0.85373±0.01311 |
| 16.3-19.2 | 0.9407±0.0000 | 0.86223±0.00941 | 0.9295±0.0021 | 0.86318±0.00914 |
| 19.2-22.7 | 0.94484±0.00033 | 0.83909±0.01197 | 0.9424±0.0013 | 0.82546±0.01196 |
| 22.7-26.8 | 0.9654±0.0012 | 0.95168±0.00954 | 0.9594±0.0012 | 0.83314±0.01798 |
| 26.8-31.6 | 0.9653±0.0011 | 0.78599±0.05055 | 0.9636±0.0011 | 0.86613±0.00047 |
| 31.6-37.3 | 0.9634±0.0014 | 0.91872±0.01863 | 0.9592±0.0014 | 0.82415±0.01412 |
| 37.3-45 | 0.9555±0.0020 | 0.93565±0.02528 | 0.9562±0.0021 | 0.91195±0.02890 |
| 45-55 | 0.9469±0.0042 | 0.68917±0.03963 | 0.9528±0.0038 | 0.76374±0.04107 |
Table 1 reflects the pion fractions extracted from the fits in Figs. 3-4. The TOF uncertainties may still be a bit underestimated, but the recent changes do move things in generally the right direction.
dE/dx PID Fits
In order to resolve some of the tension between the dE/dx fits and the TOF fits, I have tried what is tantamount to reversing the above procedure. I, now, examine the dE/dx distributions in three bins of TOF mass.
Figure 5: nσ(π) vs. M2 (Positive Charge)
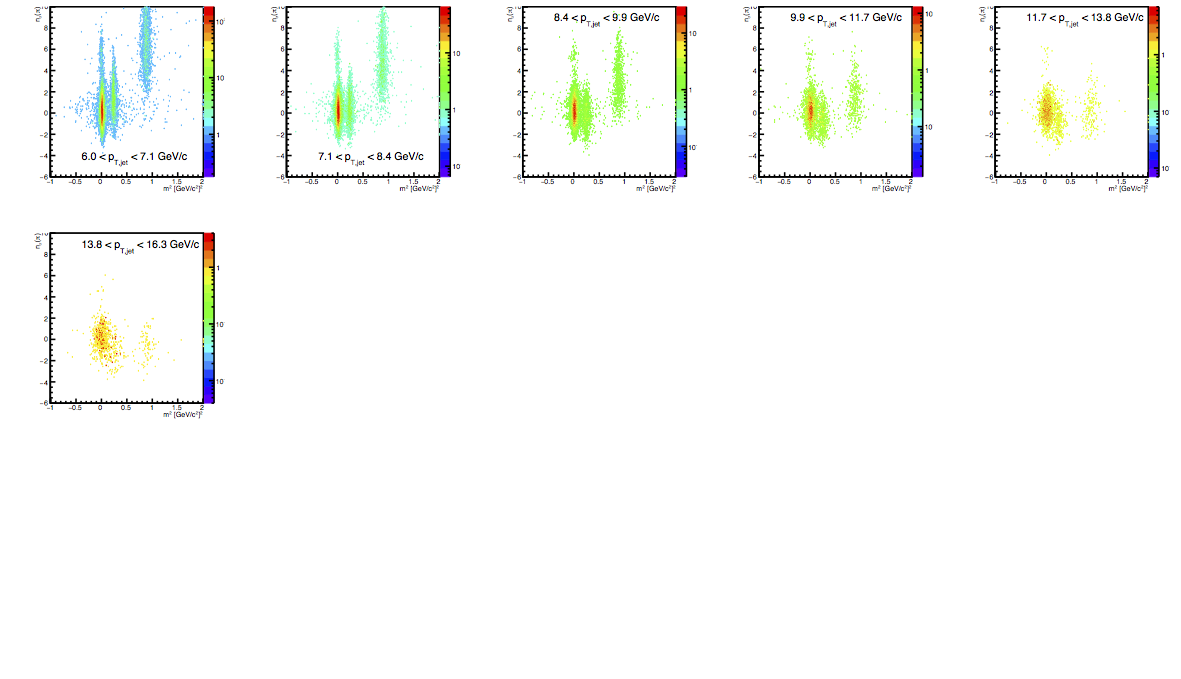
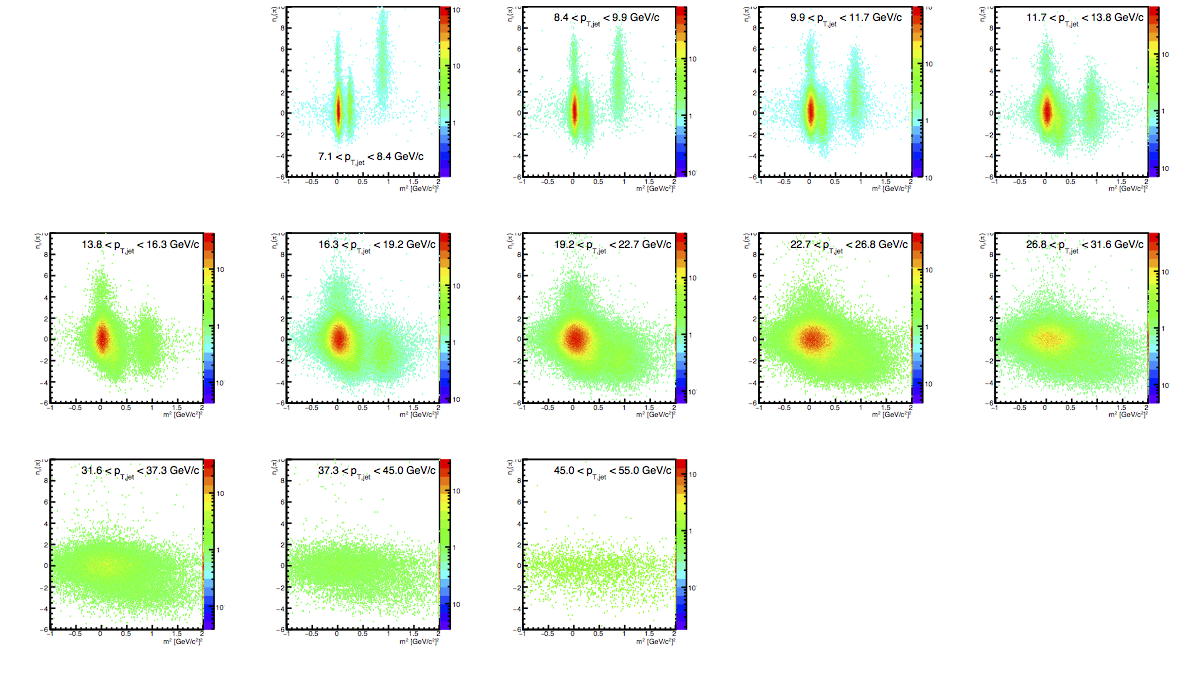
Figure 5 shows the 2-D distributions for nsigma(pi) vs. mass2 (VPDMB-left, JP-right). At the lower kinematics the species separation is dramatic. By the 4th or 5th bin, the pi/K overlap is fairly significant. To get an idea of the expected dE/dx fit parameters, I drew mass windows around the peaks to see if I could generate pure samples. The fits are shown in Fig. 6.
Figure 6: nσ(π) in M2 Bins (Positive Charge)
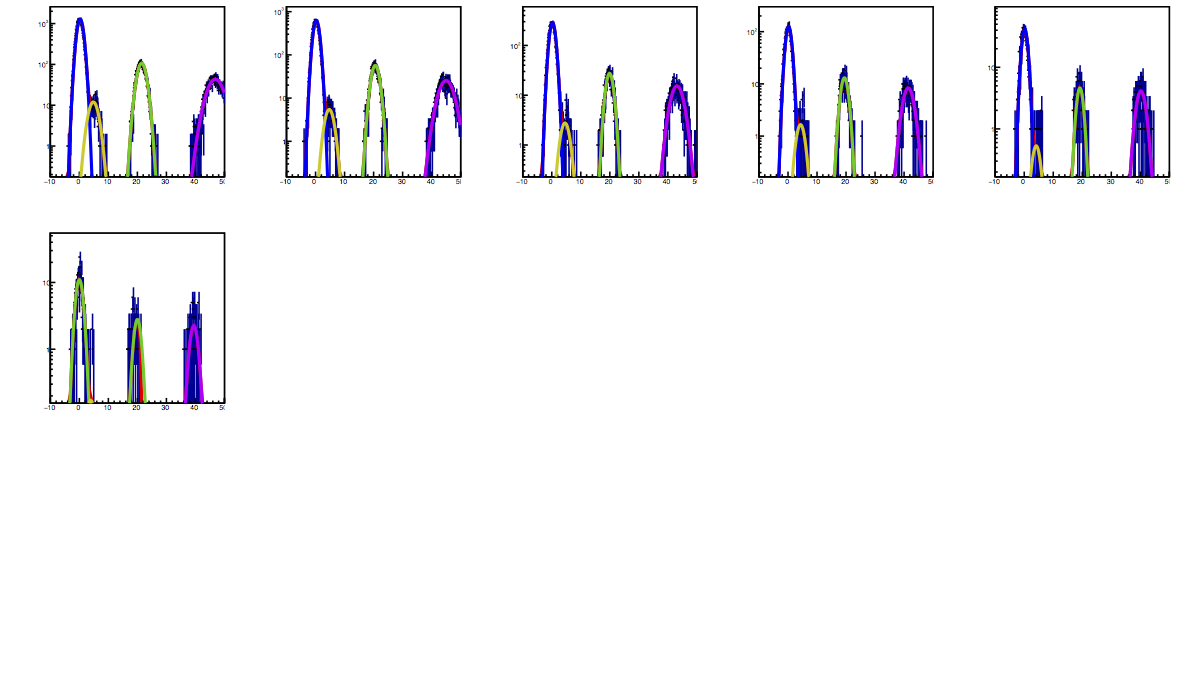
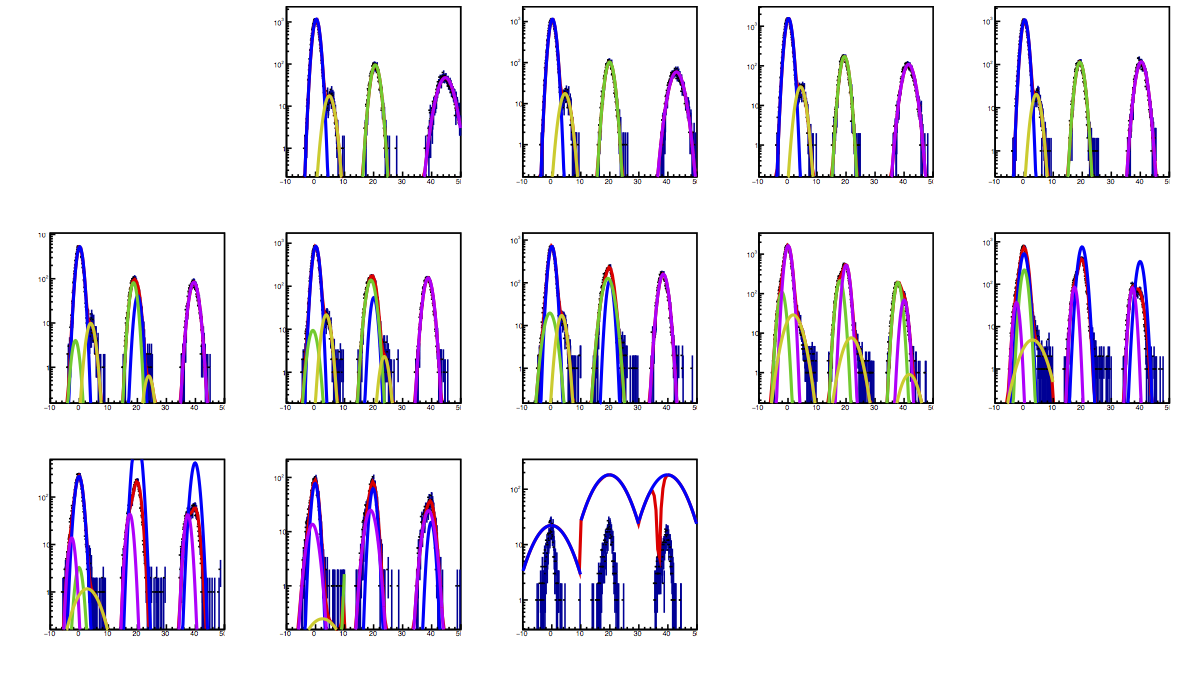
Figure 6 shows the fitted dE/dx distributions for three mass ranges. I have offset the ranges in nsigma, analogous to the above mass plots. For the first 5 bins, I consider the thre ranges to be completely "pure," and only allow the pi&e, K, or p amplitudes to be nonzero, as appropriate. I consider the proton peak to be isolated until the 22 GeV/c bin.
Figure 7: δnσ(π) vs. p/M (Positive Charge)
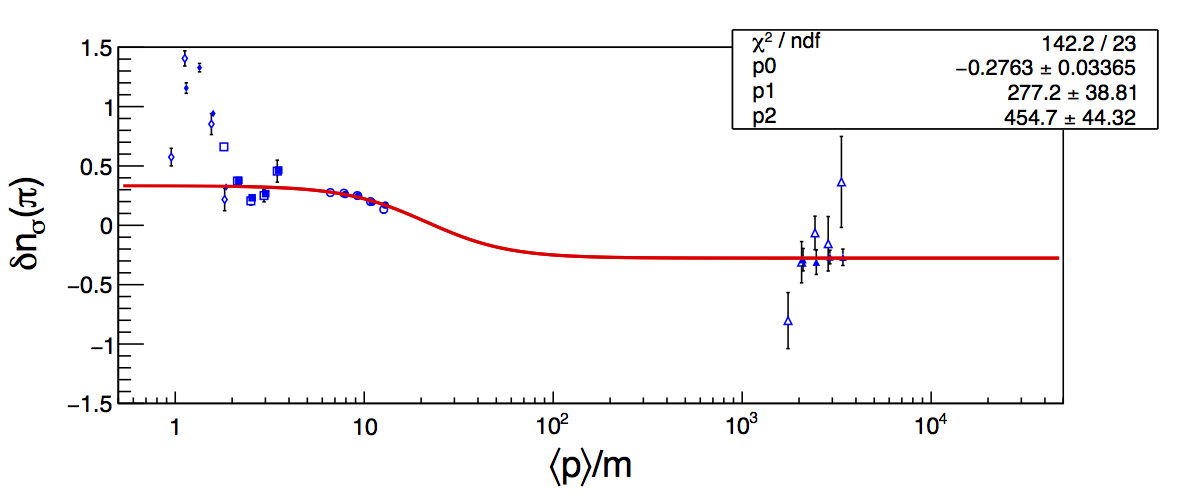
Here, I post the beta*gamma dependence of the Bischel deviations for the first five bins. The fit is consistent with the NIM article modulo a vertical offset.
Figure 8: Full nσ(π) Fits with Fixed Parameters (Positive Charge)
Here, I post the full nsigma fits, using the new beta*gamma numbers and fixing other parameters up to the 8th bin. Above this, the peaks are treated the same as earlier. Extracted fractiosn are included in Table 2.
Table 2: π-rich Fractions for 0.1 < z < 0.15 with Updated dE/dx Fits (Positive Charge)
| pT Range [GeV/c] | dE/dx π+ Fracs | TOF π+ Fracs |
| 6-7.1 | 0.90714±0.00687 | 0.89930±0.00959 |
| 7.1-8.4 | 0.88243±0.00823 | 0.88988±0.00922 |
| 8.4-9.9 | 0.81871±0.00824 | 0.85976±0.01049 |
| 9.9-11.7 | 0.81372±0.01565 | 0.84405±0.01826 |
| 11.7-13.8 | 0.81929±0.01278 | 0.83053±0.00811 |
| 13.8-16.3 | 0.79050±0.01490 | 0.84852±0.01154 |
| 16.3-19.2 | 0.88756±0.03732 | 0.86223±0.00941 |
| 19.2-22.7 | 0.93800±0.04670 | 0.83909±0.01197 |
| 22.7-26.8 | 0.95385±0.00160 | 0.95168±0.00954 |
| 26.8-31.6 | 0.96920±0.00147 | 0.78599±0.05055 |
| 31.6-37.3 | 0.97674±0.00171 | 0.91872±0.01863 |
| 37.3-45 | 0.97682±0.00182 | 0.93565±0.02528 |
| 45-55 | 0.97763±0.00383 | 0.68917±0.03963 |
- drach09's blog
- Login or register to post comments
