Run-11 Transverse Jets: Investigating the PID Systematic
One of the (final) remaining questions concerning the high-pT Collins result is the PID systematic. We estimate there are two contributions:
- The uncertainty in the "absolute" nσ(π) scale
- That in the Bischel model of the dE/dx differences between π, K, p, and e.
I argue that the former is relatively small, due to the fact that our PID fits fix the separation between π, K, p, and e but allow the π centroid to float. Thus, to the extent that the separations are correct, the scale factor mitigated by allowing the data to decide the pion location. This does not, however, address the latter. If the separations are not correct, then our PID fits may be biased in one direction over another. To investigate this, I turn to the expertise of our colleagues, as seen in this very nice PID NIM paper. In their paper, they present a "recalibration" method, investigating the deviations of centroids from the Bischel expectation. They find that the deviation dependance on βγ (approximately pT/m) is independent of particle species. They are able to examine this for various samples, including K, p, and e enriched samples and fit the resulting distribution with a functional form. The centroids can then be set by correcting the Bischel expectations with values from the fit. While generating the enriched samples would take considerable effort, I can quickly give an estimate by looking at the pion centroids from the different bins of pT and z.
Figure 1
| Positive | Negative |
 |
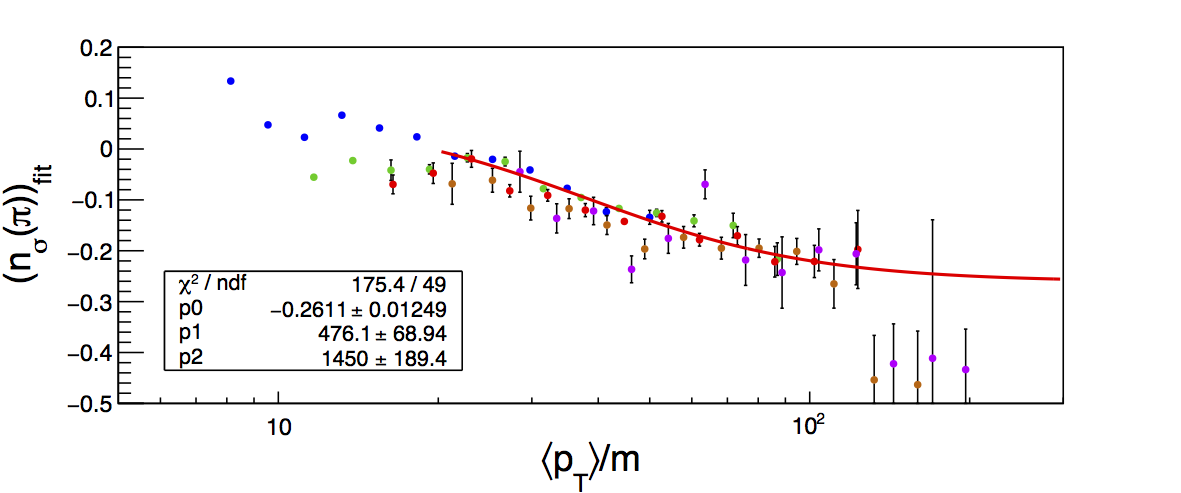 |
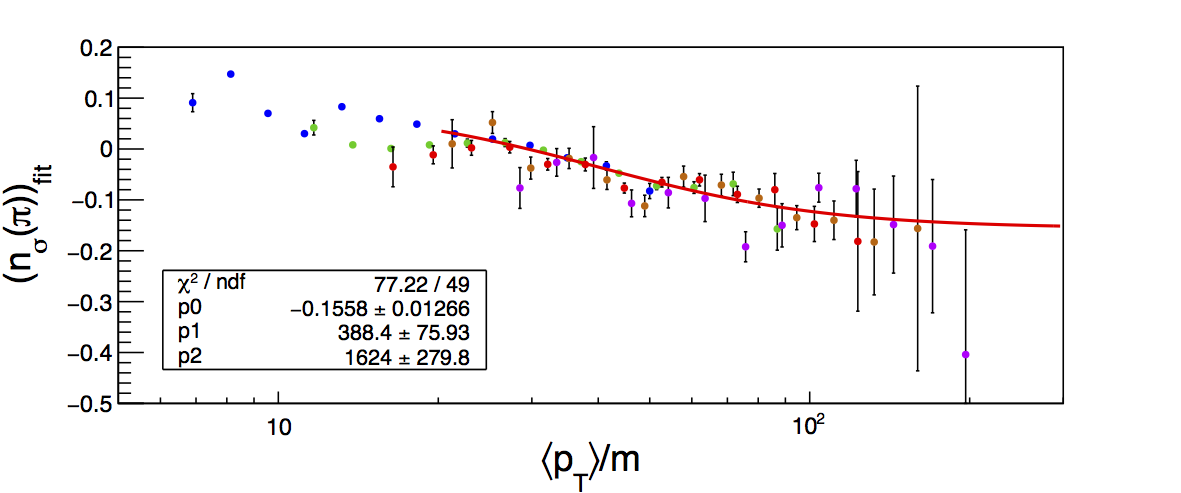
The NIM article sets the two pion charge states to have the same centroid location. I fit each separately, so I will investigate the devations separately for each. My assumption is that the Bischel expectation is for pions to center at 0. Thus, I plot simply the fit centroids. I do not store the histrograms in bins of pion pT, however, I can estimate it from the average values of jet pT and pion z for each bin. This is done at the detector level. All of this may introduce a small horizontal shift, but it should be close enough for our purposes. Figure 1 shows the centroids for π+ and π-. The different colors represent the different z-bins: blue, green, red, orange, and violet in order of increasing z. The plots are fit with a function of the same form as the NIM article. I have restricted the fit range to pion pT > 2.7 GeV/c. This is because below this, the PID fits are less reliable with the dE/dx bands overlapping for the various species. The remaining bins are left to give a sense of things (one can note that a few bins tend to fluctuate pretty wildly in this region). In the high-pT region, the centroids overlap nicely. The fits are relatively sensible to the eye, although the χ2 values are a bit large. Comparing to the NIM article, the horizontal position appears a bit shifted ~20 which is likely a result of my approximation of the pion pT (a shift of ~20 corresponds to a pT shift of ~3 GeV/c). Interestingly, the scale of the pT/m dependence seems to be smaller than that of the NIM article and also somewhat dependent on charge-sign. That the overall scale is different is perhaps a result of changes in instrumentation, calibration, tracking, etc. since 2005. The charge-sign dependence may require a bit more thought.
Figure 2
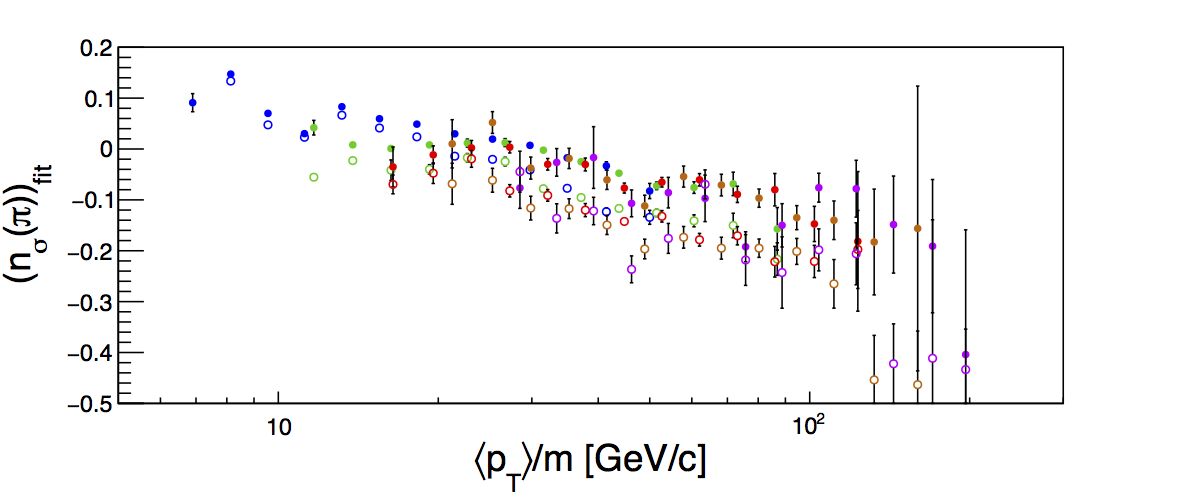
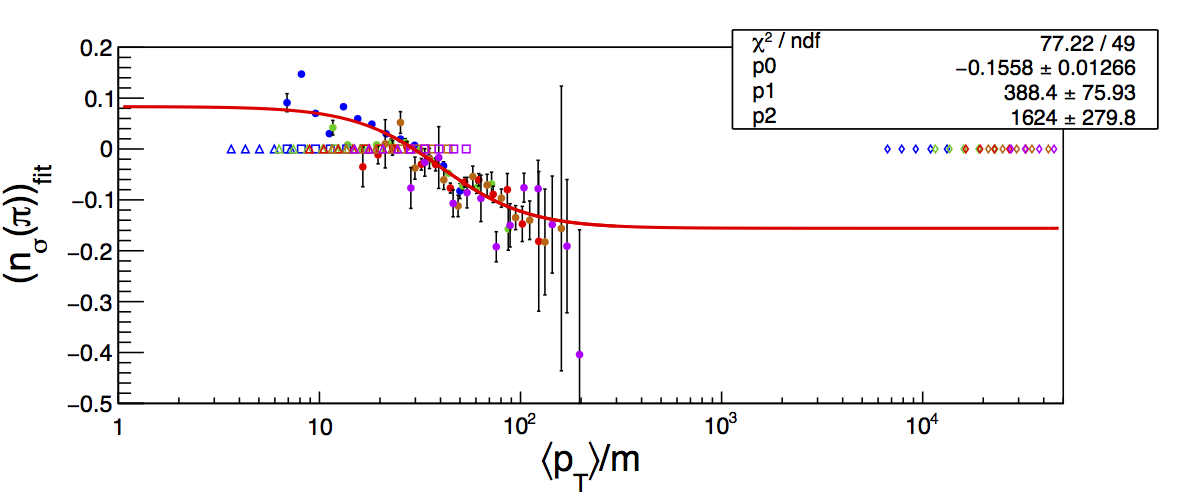
NOTE: The x-axis units label is obviously incorrect. Mea culpa. Same for Fig. 3. To get a sense for the size of the charge-sign dependence, I plot the centroid locations together. Closed circles are π+; open circles are π-. The difference is not so large, perhaps ~0.1σ. This could be related to imperfections in the space charge correction. One thing to check is that it is not a result of fixing the π-K, π-p, and π-e separations based upon the Bischel expectation, which be off by approximately that amount. Seeing how the pion centroids change when the K, p, and e centroids are allowed to float may give a sense for how this influences the pion centroids.
Figure 3
| Positive | Negative |
 |
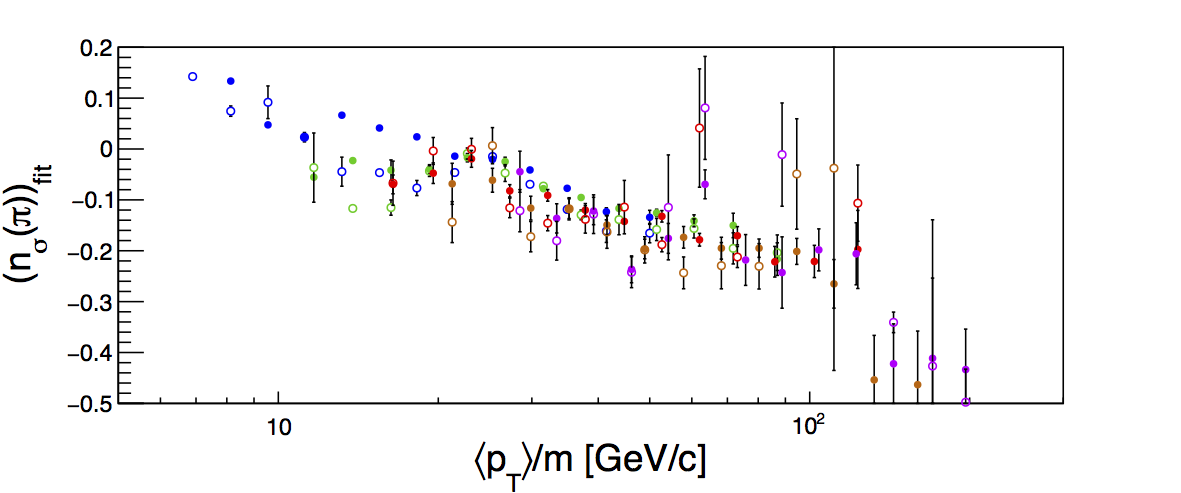 |
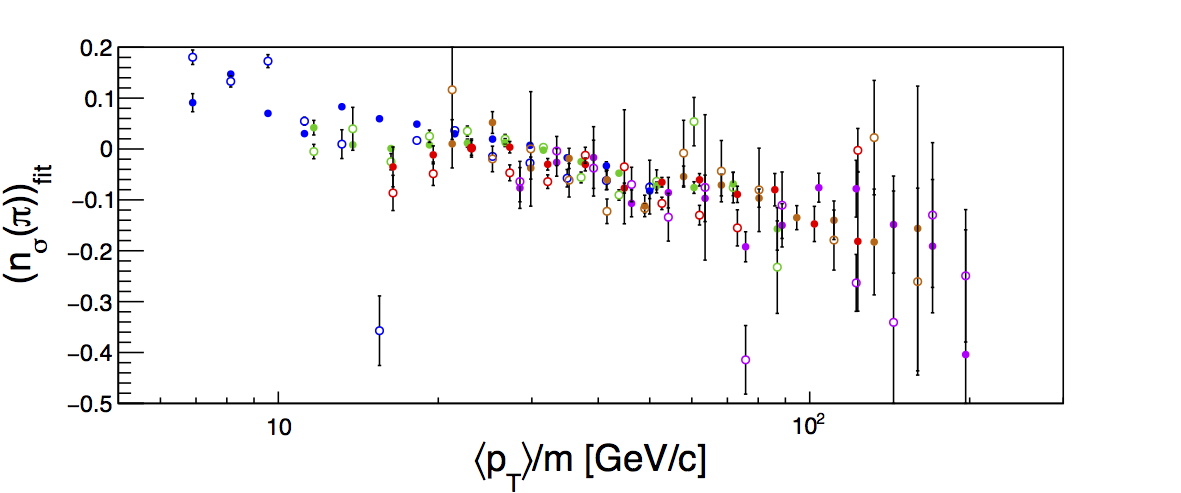
Figure 3 shows the comparison of the fixed separations (closed circles) vs. floating separations (open circles) for pi+ and pi-. There does not appear to be much difference in the centroid locations. One must realize that in particular for the higher z-bins, allowing all centroids to float introduces pretty significant instability in the fits. So, I would not trust them so much, but it seems worth noting that even given the potential for wild shifts in the peak locations, on average, there does not seem to be enough systematic shifting to explain the charge-sign dependence.
Figure 4
| Positive | Negative |
 |
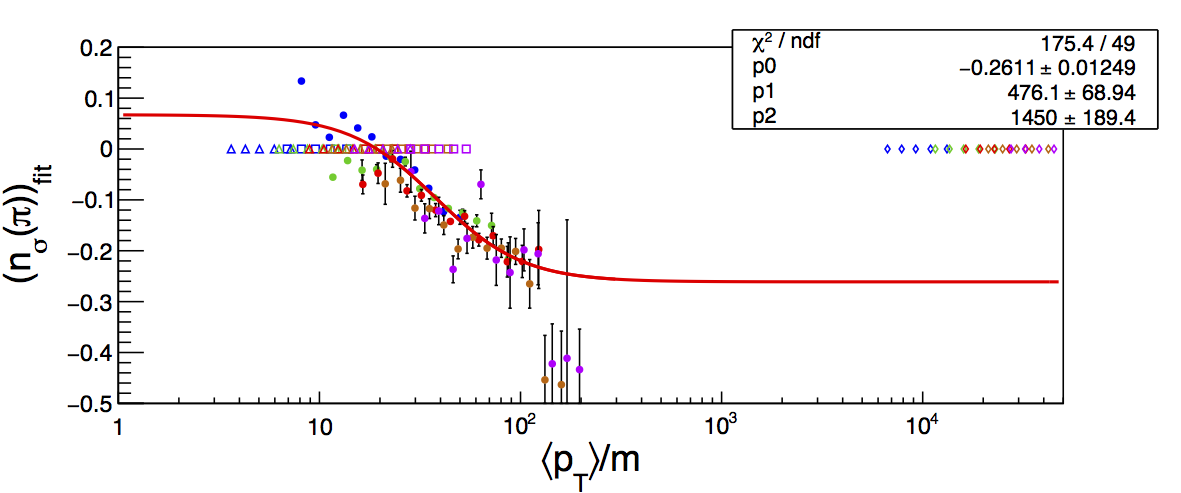 |
In principle, one would expect that the fitted curve should allow an estimation of the deviations for all species. We obviously suffer a bit in terms of the range over which we can constrain the fit. However, we can get a sense for the size of the devations by extrapolating the fit curve over the pT/m range covered by kaons, protons, and electrons. In Fig. 4 I expand the horizontal axis range to show the extrapolation of the fit. Note that the fit is exactly the same as in Fig. 1, i.e. it is done only over the high-pT pions. On the horizontal, I plot pionts representing the pT/m locations of the high-pT kaons (open circles), protons (open triangles), and electrons (open diamonds). If the curve is to be believed, one could use it to estimate corrections to the current fixed K, p, and e separations. For that matter, we can also use it to fix the locations of the pion centroids. The differences between the signal fractions from the fits with corrected and uncorrected centroids could then function as the systematic uncertainties for the high-pT background corrections.
- drach09's blog
- Login or register to post comments