- drach09's home page
- Posts
- 2022
- 2020
- June (1)
- 2019
- 2018
- 2017
- 2016
- 2015
- 2014
- December (13)
- November (2)
- October (5)
- September (2)
- August (8)
- July (9)
- June (7)
- May (5)
- April (4)
- March (4)
- February (1)
- January (2)
- 2013
- December (2)
- November (8)
- October (5)
- September (12)
- August (5)
- July (2)
- June (3)
- May (4)
- April (8)
- March (10)
- February (9)
- January (11)
- 2012
- 2011
- October (1)
- My blog
- Post new blog entry
- All blogs
Run-11 Transverse Jets: Updated PID Systematic Proposal
I have folded the previously discussed PID systematic proposal into the high-pT Collins analysis. Here, I will lead with the bottom-line. If the proposal is deemed robust, we have obliterated the PID systematic, which was in most cases the leading systematic in the previous analysis. The cost is about 0.2σ of precision; but, since I believe the new technique is more accurate, I consider this a winning trade. Money plots follow with a discussion of gorey details below.
Figure 1: Pion Asymmetries
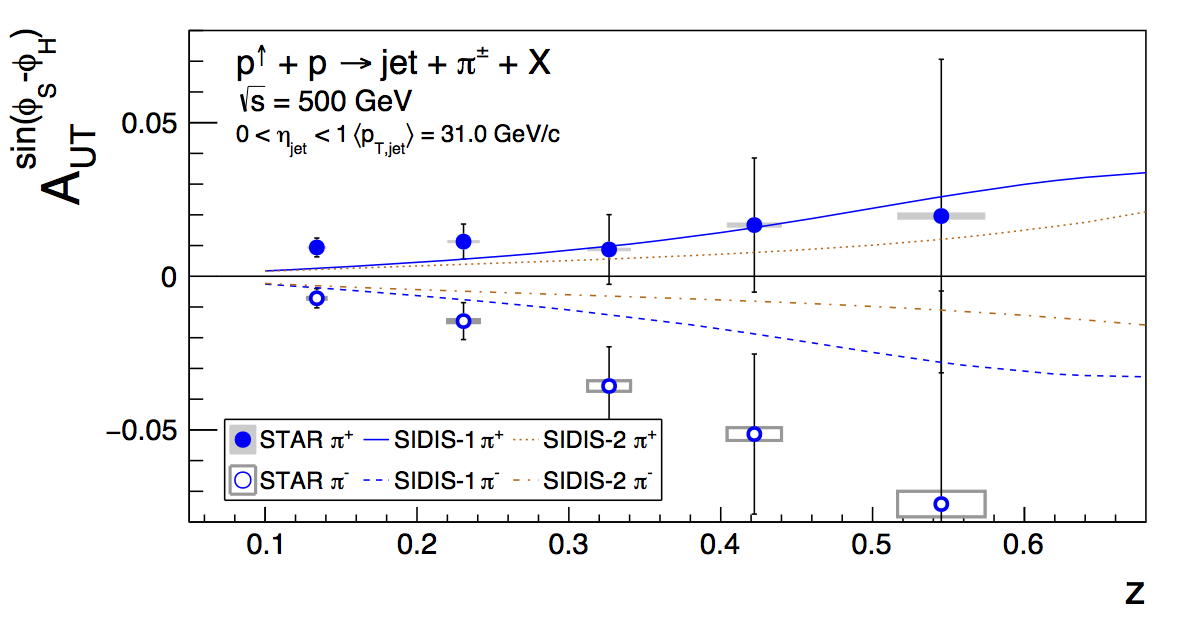
Figure 1 shows another rough draft of a proposed money plot for the PRL version of the 2011 jet paper. I still need to add the latest curve from Zhongbo. This figure does include the proposed PID systematic. It is everwhere subdominant, in some cases negligible, and at most 6.9% of the overall systematic of a given datapoint. The effects are further reduced, now, because the systematic is uncorrelated across charge states. The current asymmetry difference between π+ and π- is 0.0206±0.0039, i.e. a 5.31σ effect.
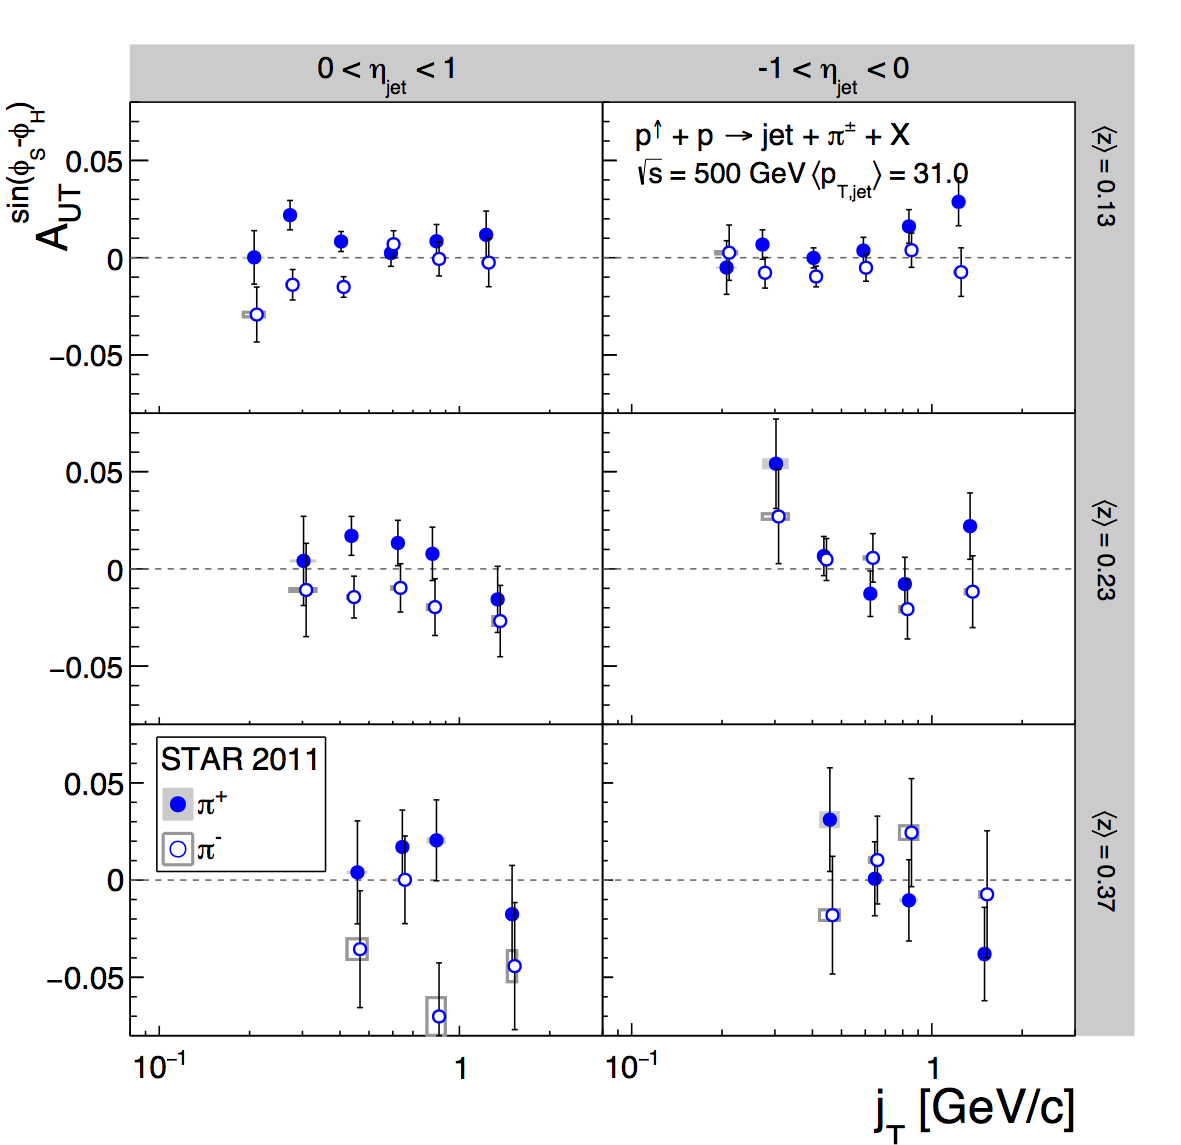
Figure 2: Pion Asymmetries (jT Dependence)
| New | Old |
 |
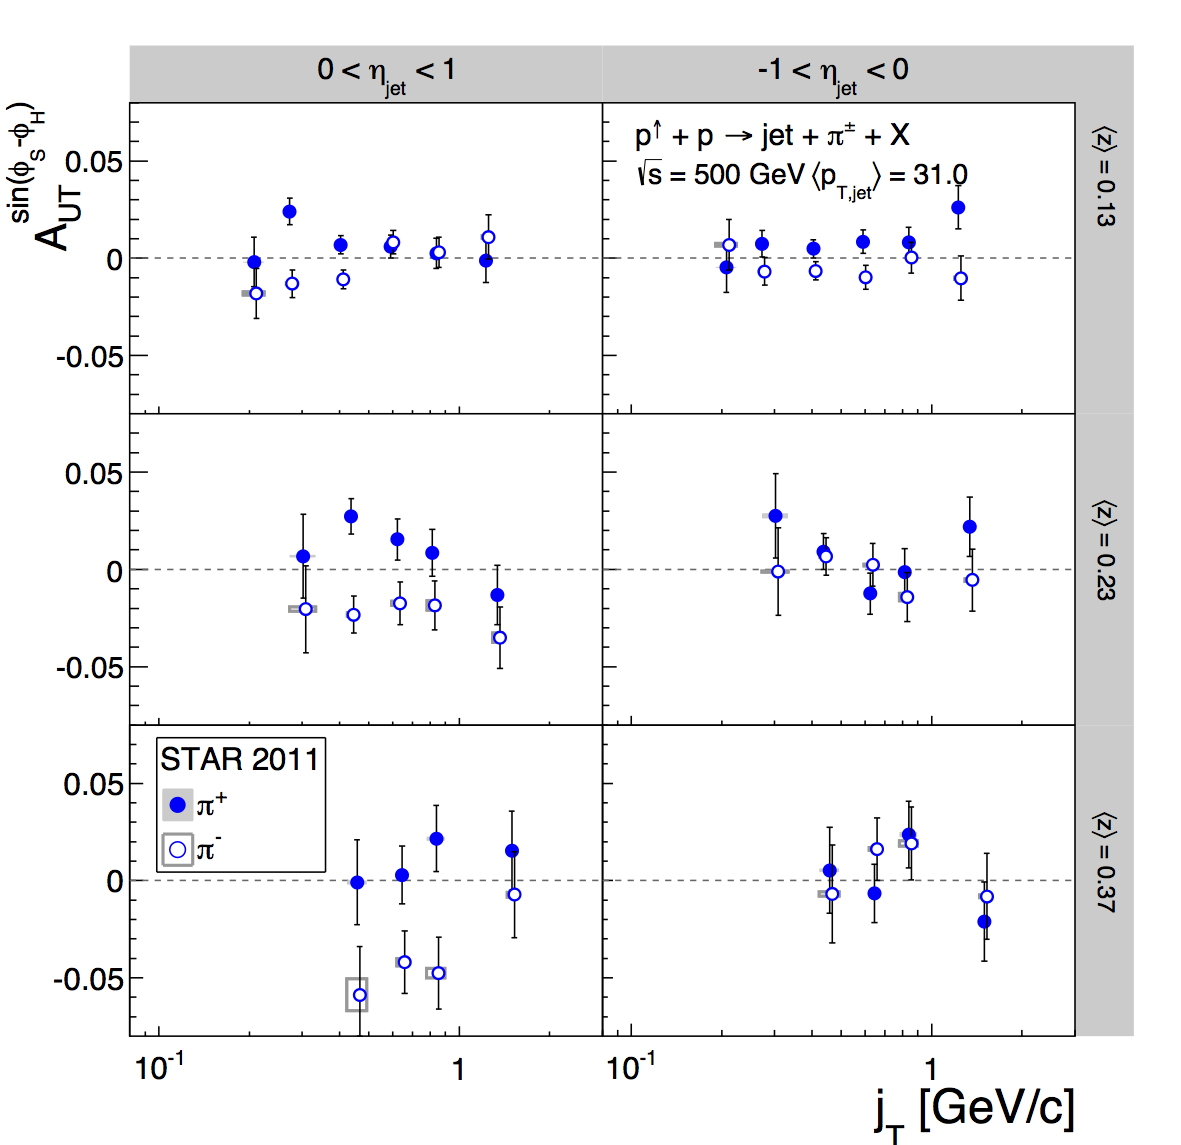 |
Figure 2 shows the asymmetries binned in terms of jT (pion pT relative to the jet axis). The signal fractions are again calculated by binning in z and pT. At this point, the binning is so fine that the statistics are really stretched. The dE/dx depends upon momentum, a lab-frame quanitity, but at first order should not depend on jT, which is a jet-frame quantity. To ensure the stability of the PID fits, I fixed the K/p widths to the values from the corresponding (pT,z) bins, irrespective of jT bin. For the systematics estimate, I allowed the widths to float. Since the systematics estimate uses the Bischel expectation for the centroid locations, the K and p peaks are more separated, thus, the fits are a bit more stable, anyway. As with the other results, the PID systematic is now quite small in the jT dependence. The results are shown side-by-side with the previous results. For the most part, the changes are fairly small.
Figure 3: Kaon Asymmetries
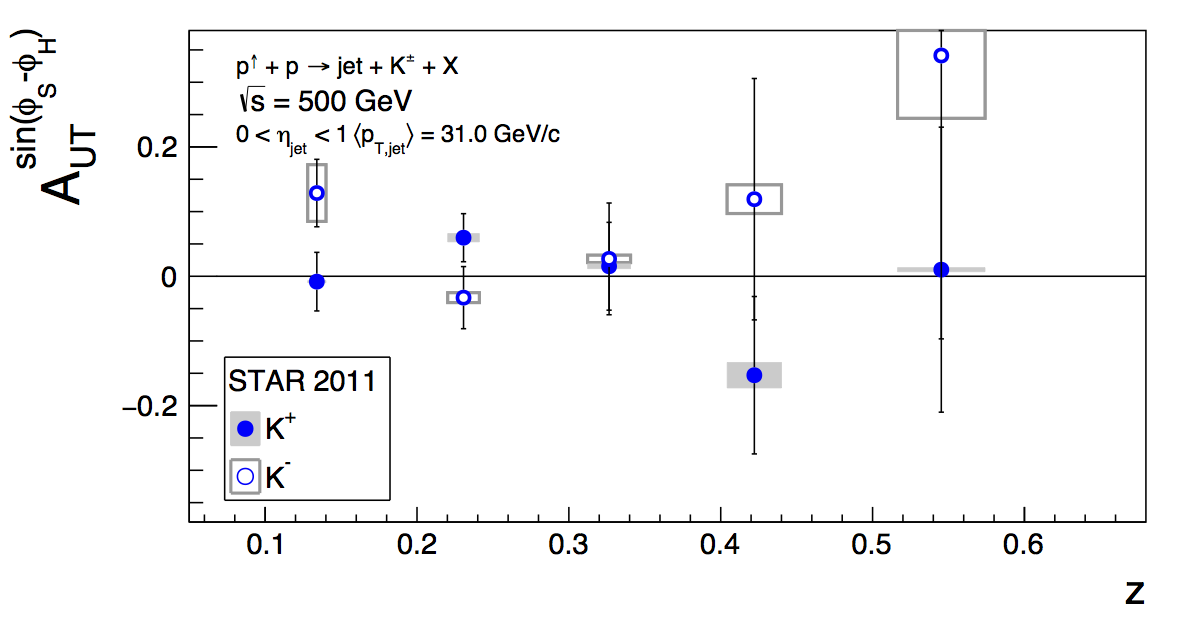
Figure 2 shows the kaon asymmetries, extracted along with the pion asymmetries. They are consistent with zero. The size of the error bars suggests that our best bet for kaon asymmetries going forward is in the 200 GeV data. Note that the PID systematic included here is probably not correct and needs a bit more thought.
Figure 4: Proton Asymmetries
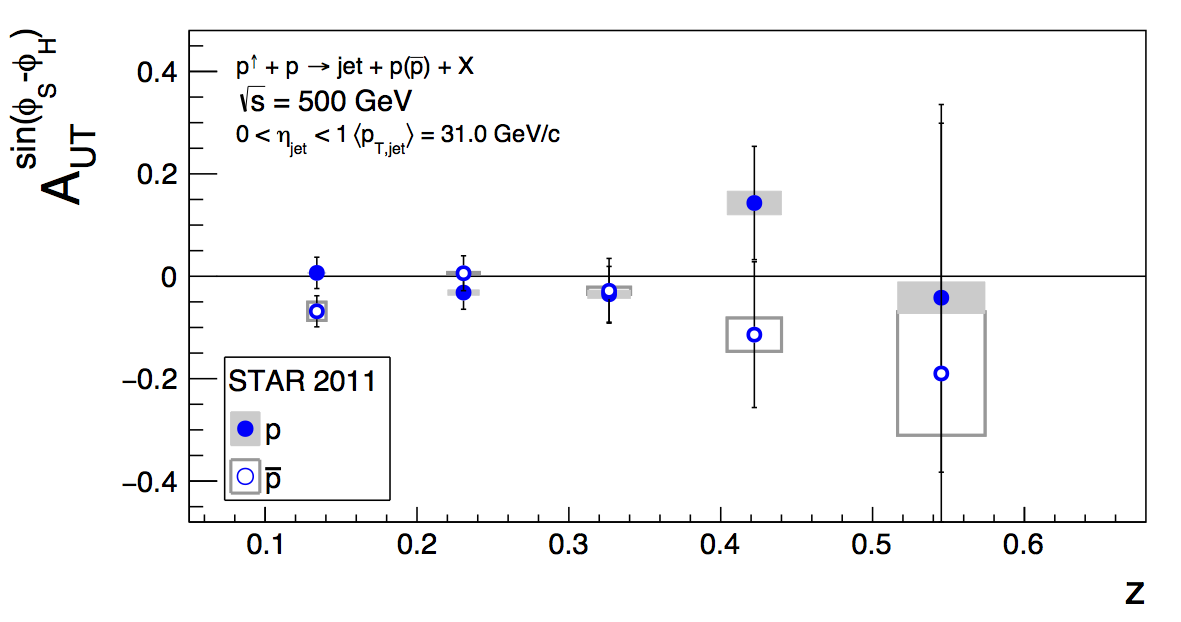
Figure 3 shows the proton asymetries, which are also consistent with zero.
Systematic Proposal
For the proposed systematic, I use the βγ studies to fix the pion peak centroids and correct the K, p, and e separations. The differences in the pion fractions extracted by the "correction" method from those using the "uncorrected" method are taken as the systematic uncertainty, σ = (δf/f)×AUT. One detail that I did not appreciate was that the corrections are actually a bit larger for the pions than for the kaons. The effect is to bring the kaon and proton peaks closer together. At lower particle pT, this is not an issue, but it does render the fits at high pion pT a bit less stable. To introduce a bit more stability, I studied the pT dependence of the fitted K/p widths (the kaon and proton peaks are forced to have the same width).
Figure 5: Width Fits
| Positive Charge | Negative Charge |
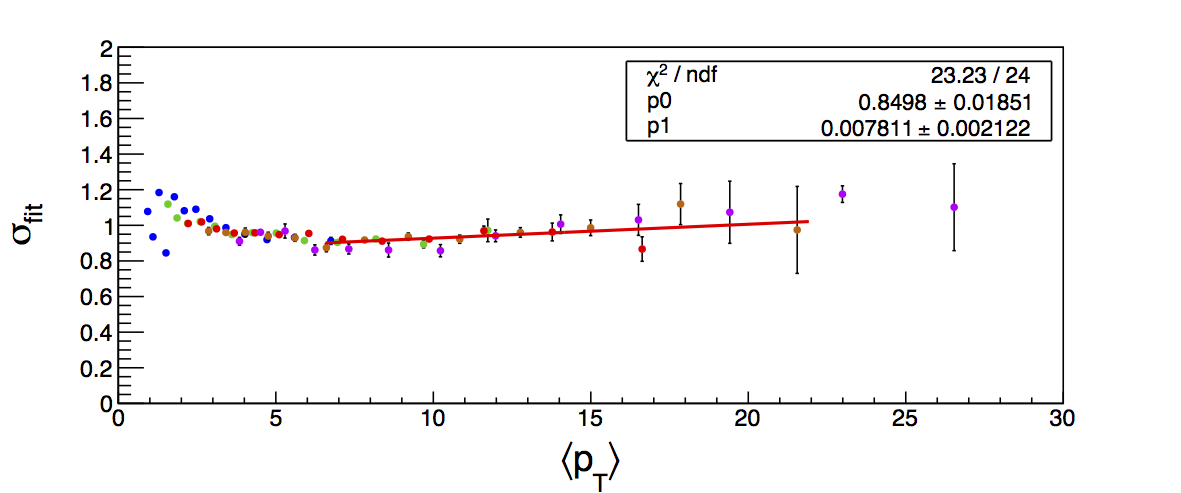 |
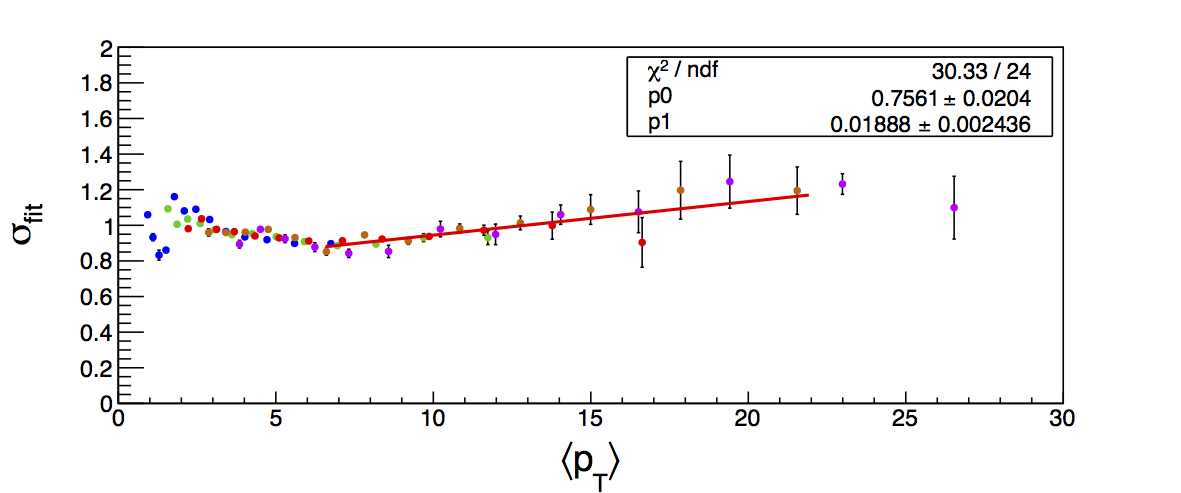 |
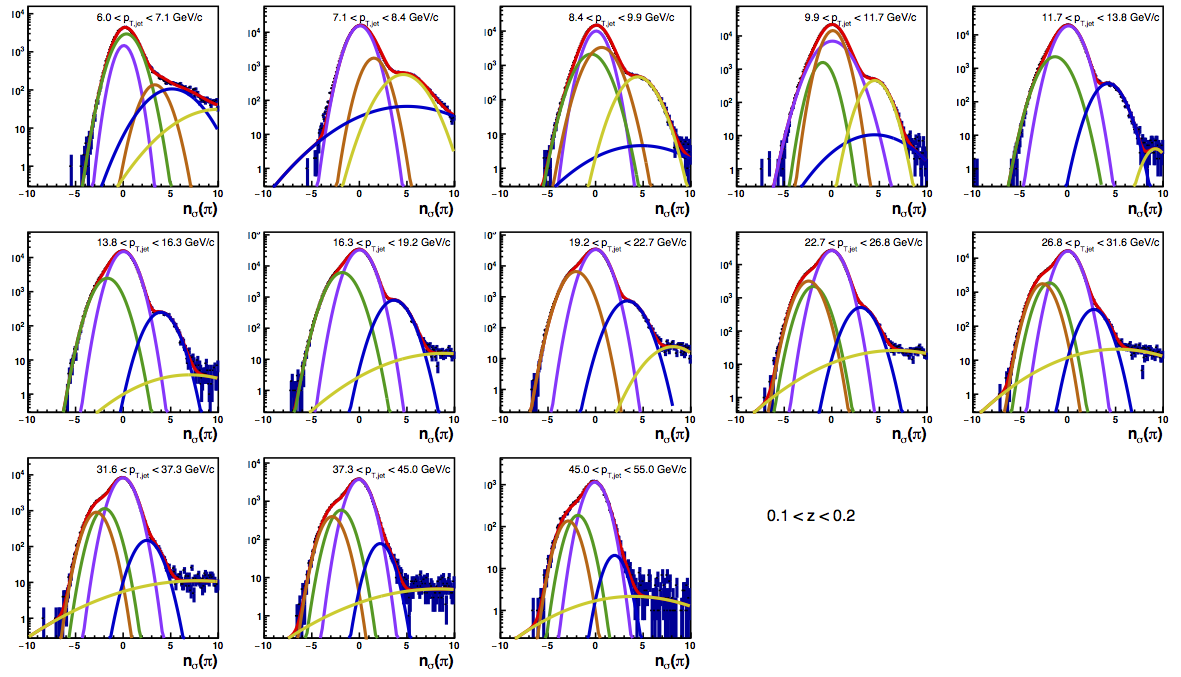
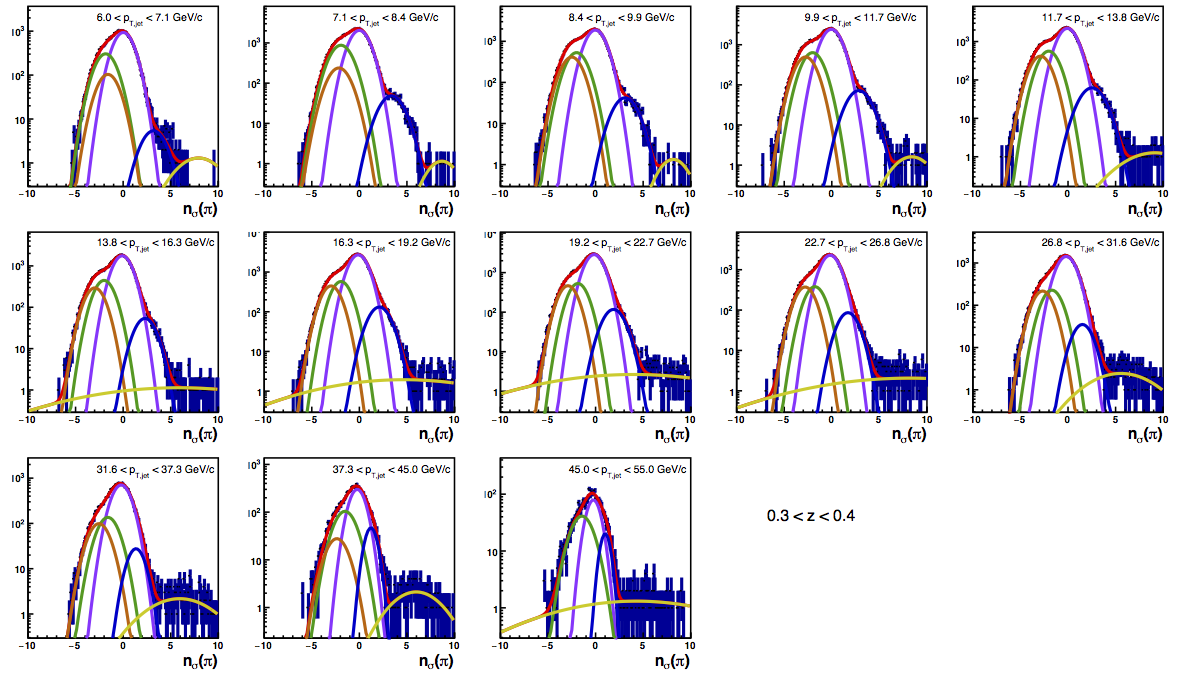
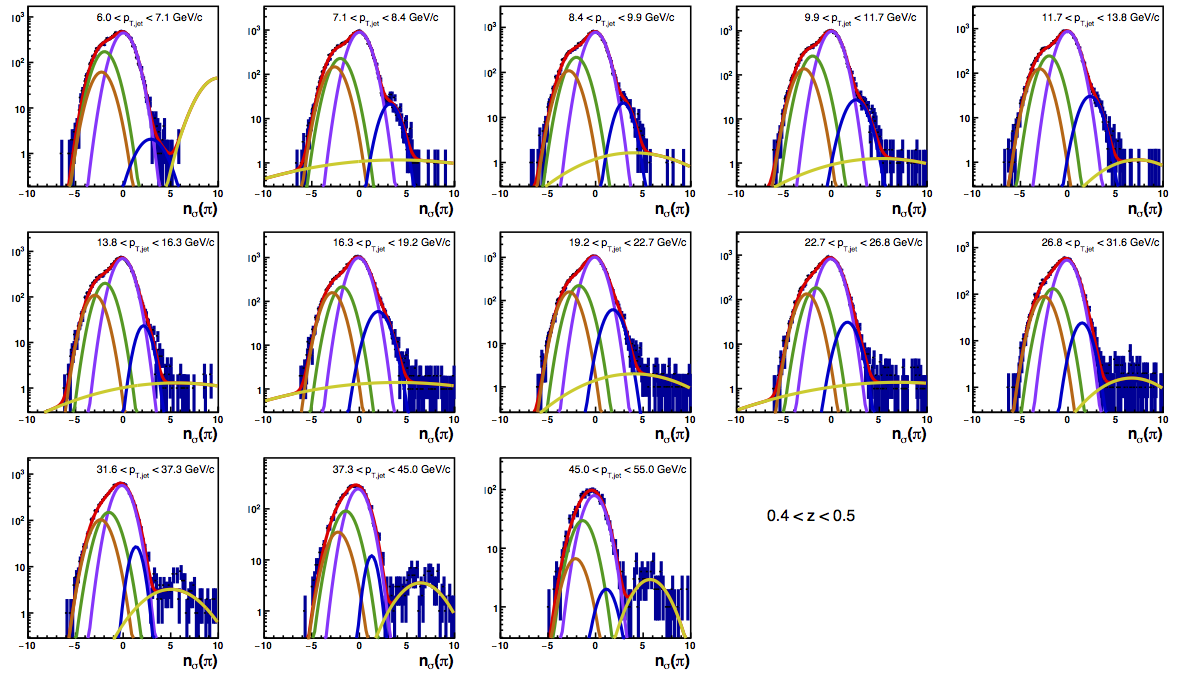
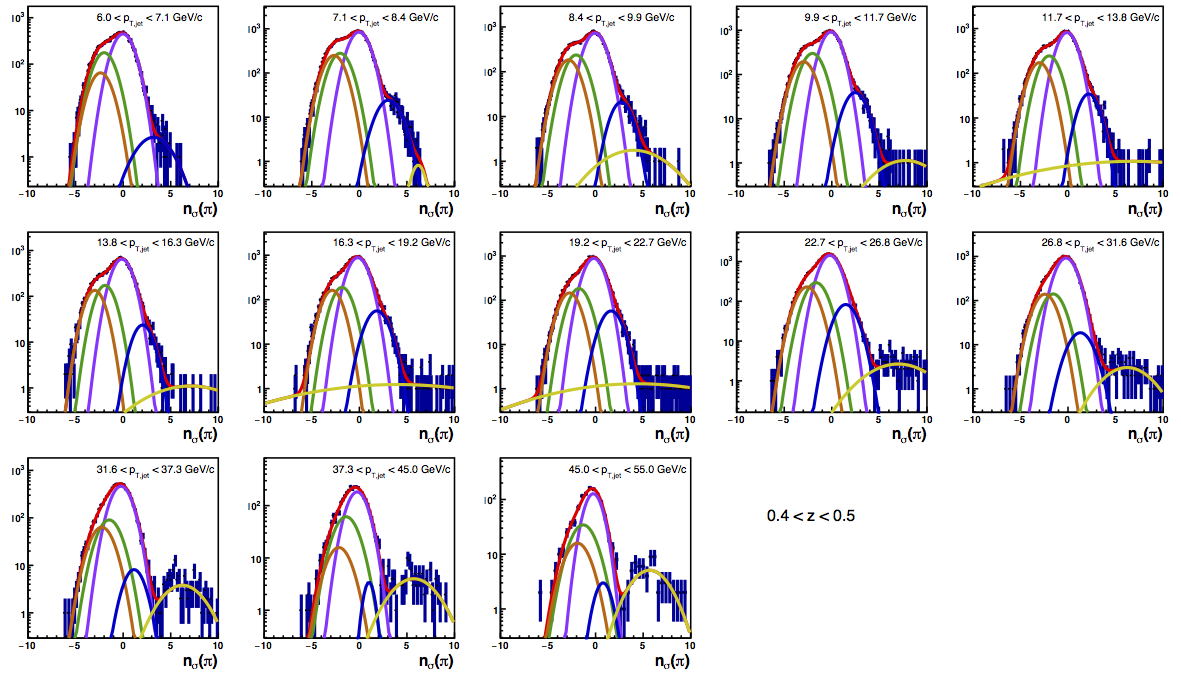
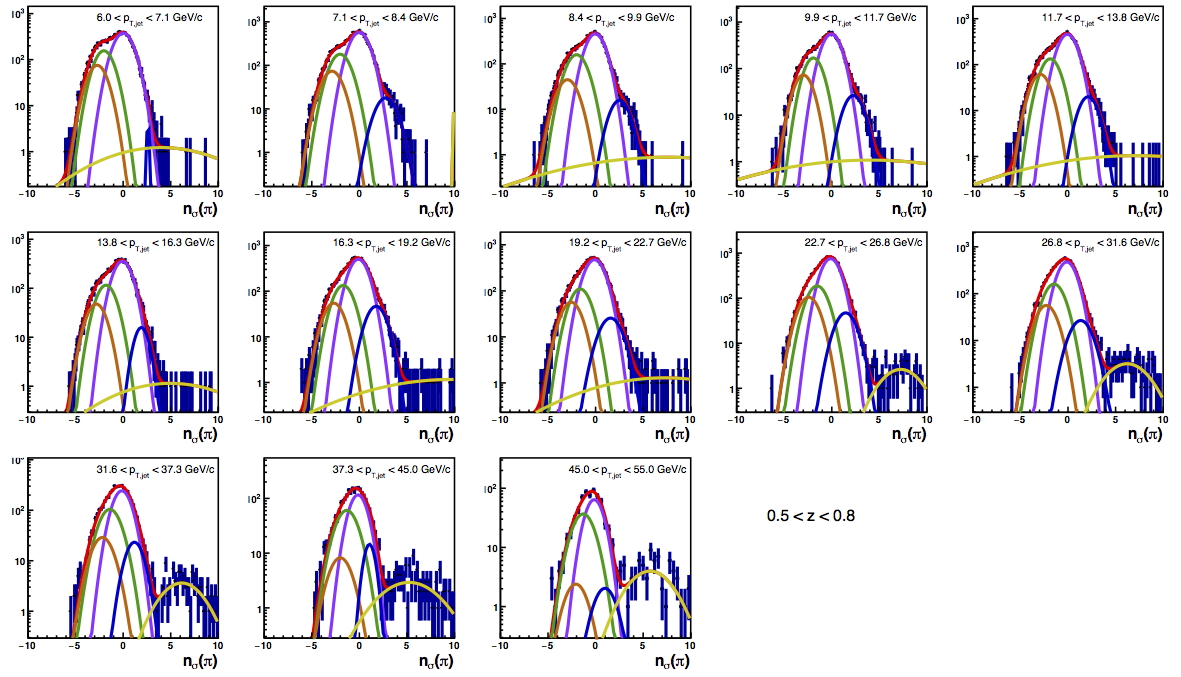
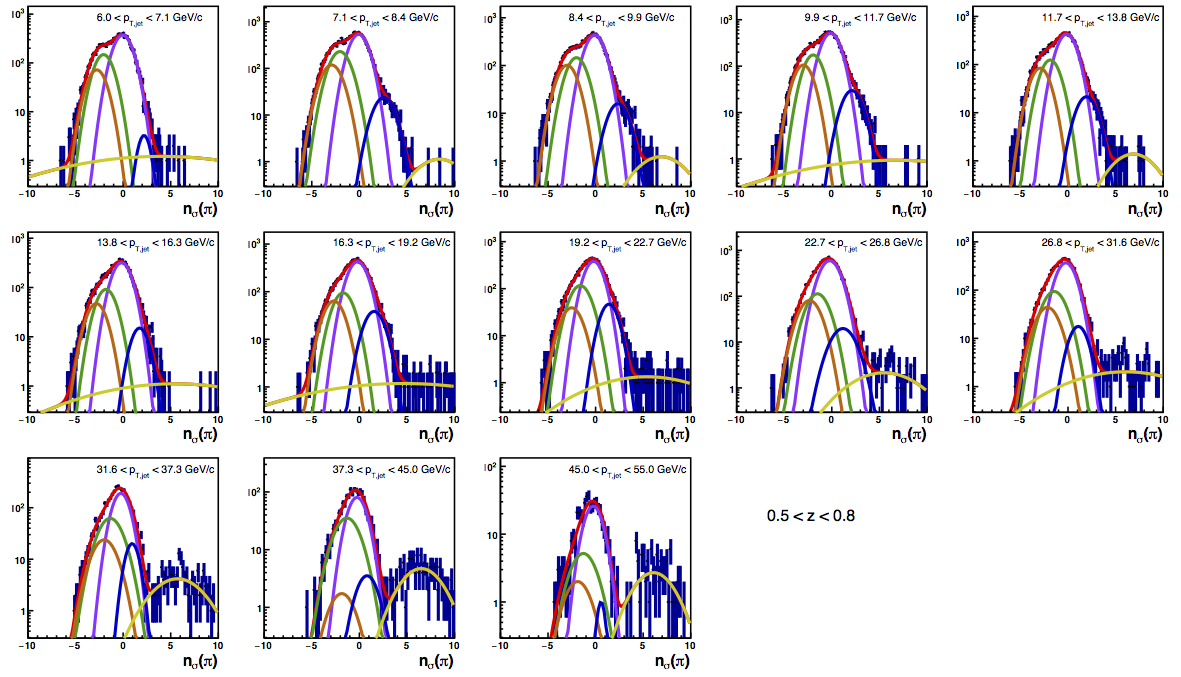
Figure 4 shows the K/p widths as a function of particle (in this case, kaon/proton) pT. One can see that in the region where the dE/dx bands overlap, the peak widths are a bit unstable. Once there is more clear separation between the peaks, the widths dip a bit below unity, consistent with the PID NIM article. Then, the widths begin to increase as a function of pT. The fits are really only unstable at the highest bins. I fit the widths with a line across the range 6.5-22 GeV/c. I use the line to extract a value for the widths in each bin above 6.5 GeV/c. I then fix the K/p widths in the PID fits to these values for the bins with particle pT > 6.5 GeV/c. This seems to stablize the fits a bit, as well as reducing the statistical uncertainty in the signal fraction extractions. There are two bins where I have some trouble getting the fits to converge without a parameter pegged to an edge of a range limit: the 45 < pT,jet < 55 GeV/c, 0.4 < z < 0.5 bin and the 45 < pT,jet < 55 GeV/c, 0.5 < z < 0.8 bin, both negative charge. The yield in these bins is so small compared to the rest of the bins that it is really of no consequence. So, I leave it, for now. The proposed final high-pT PID fits are posted below. Note that I have added in yellow a curve for the "merged" tracks. The fits need considerable work below 22.7 GeV/c, but I leave them for now for the sake of time. I will update them later. For now, it makes no difference for the high-pT Collins asymmetries.
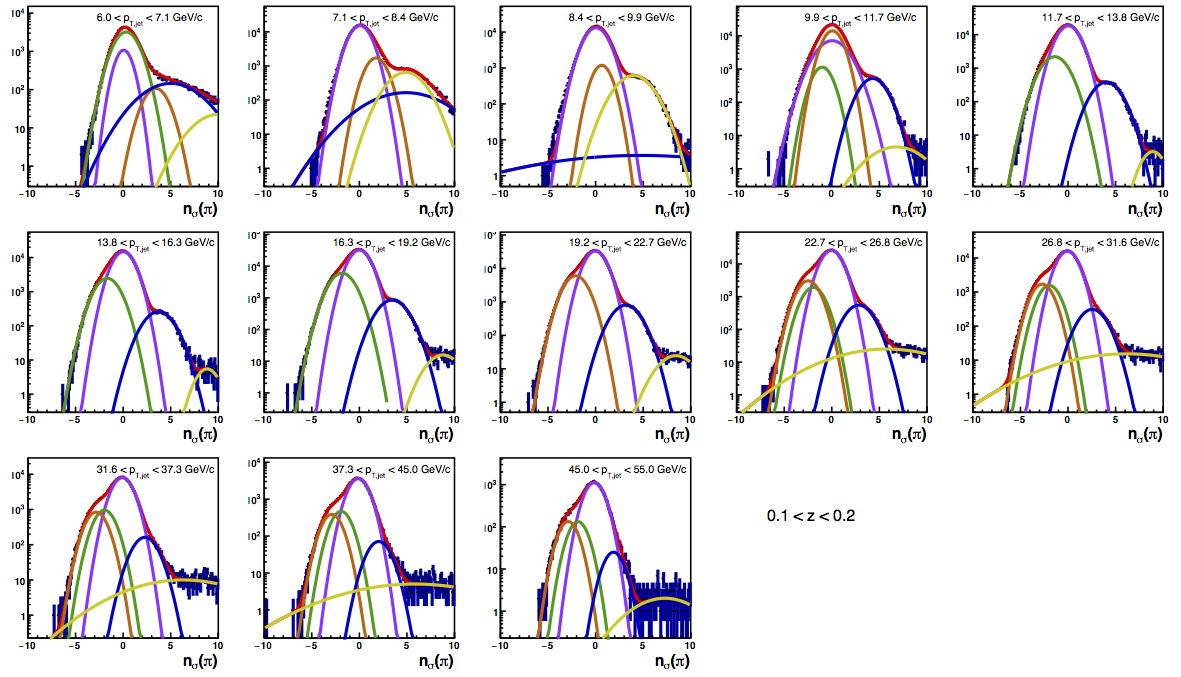
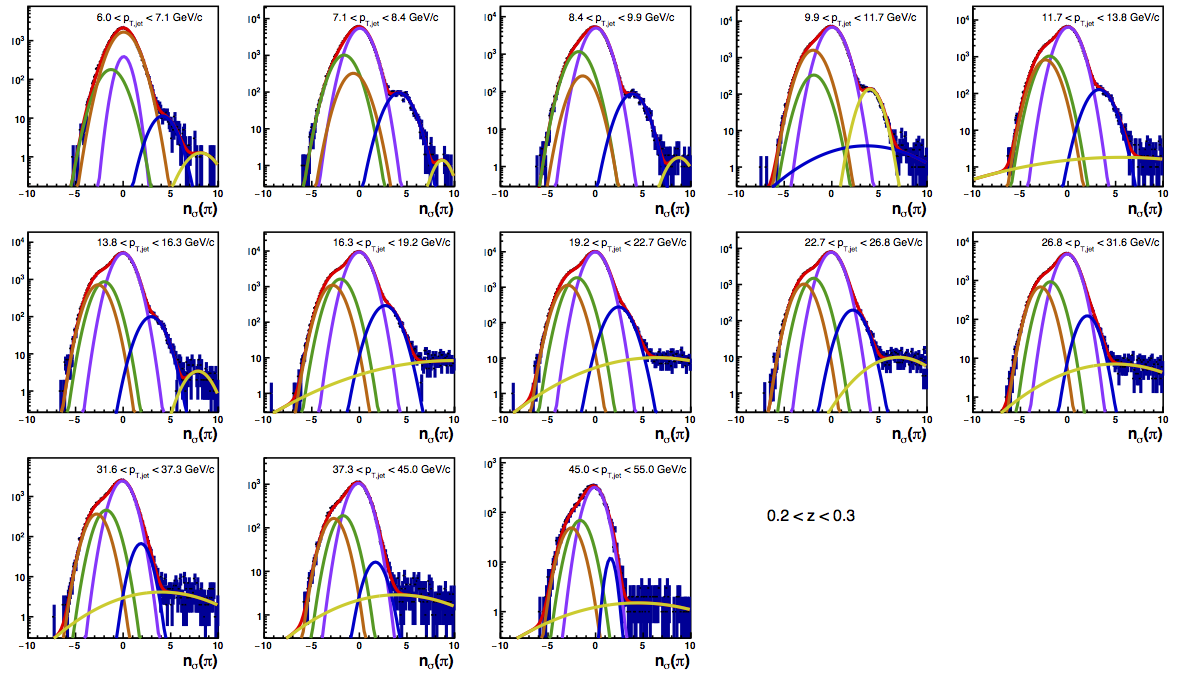
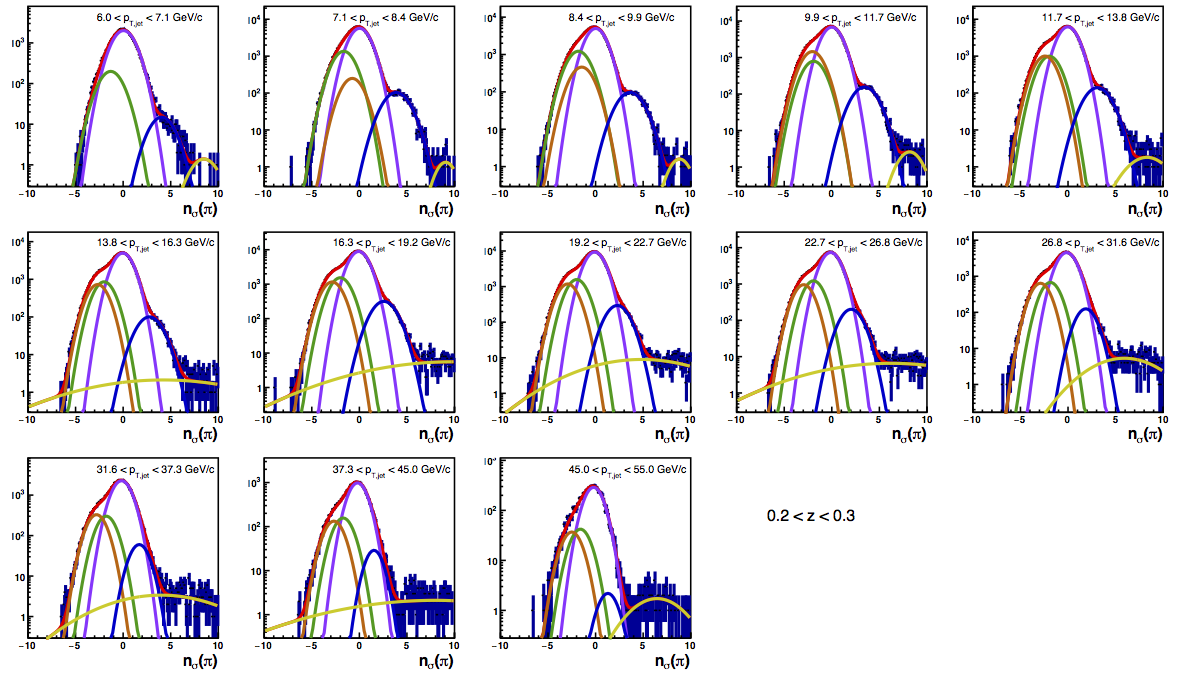
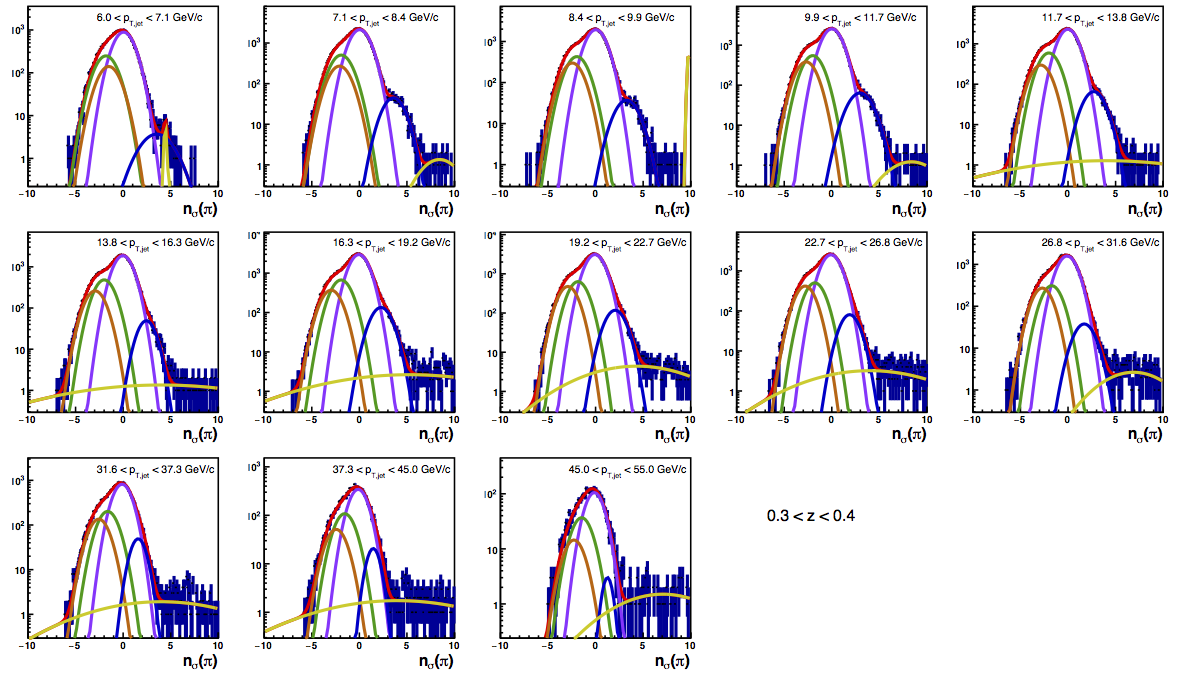
Figure 6: PID Fits
| Positive Charge | Negative Charge |
 |
 |
 |
 |
 |
 |
 |
 |
 |
 |
Groups:
- drach09's blog
- Login or register to post comments