The last remaining obstacle for the low-pT results is to fold in TOF information to the PID estimates. The general idea is that in the momentum regions where the dE/dx bands overlap, the invariant masses from TOF information can provide sufficient information to estimate the yield fractions. The following outlines a proposal for implementing this technique.
Figure 1
| Positive Charge |
Negative Charge |
 |
 |
 |
 |
 |
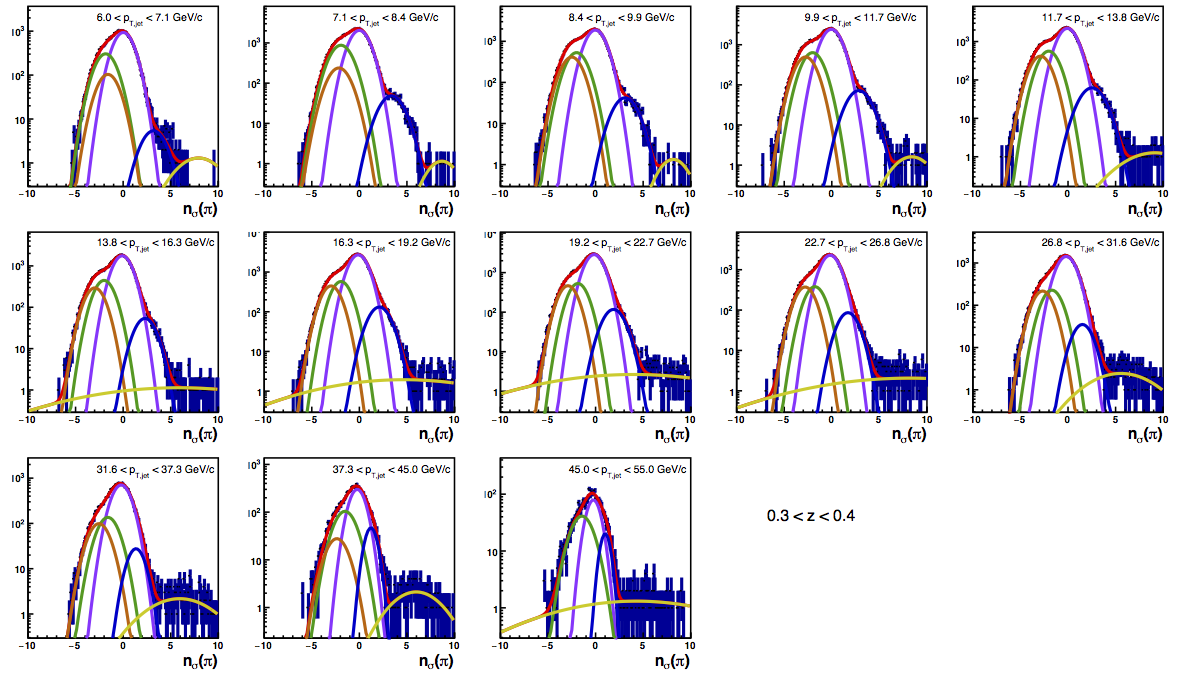 |
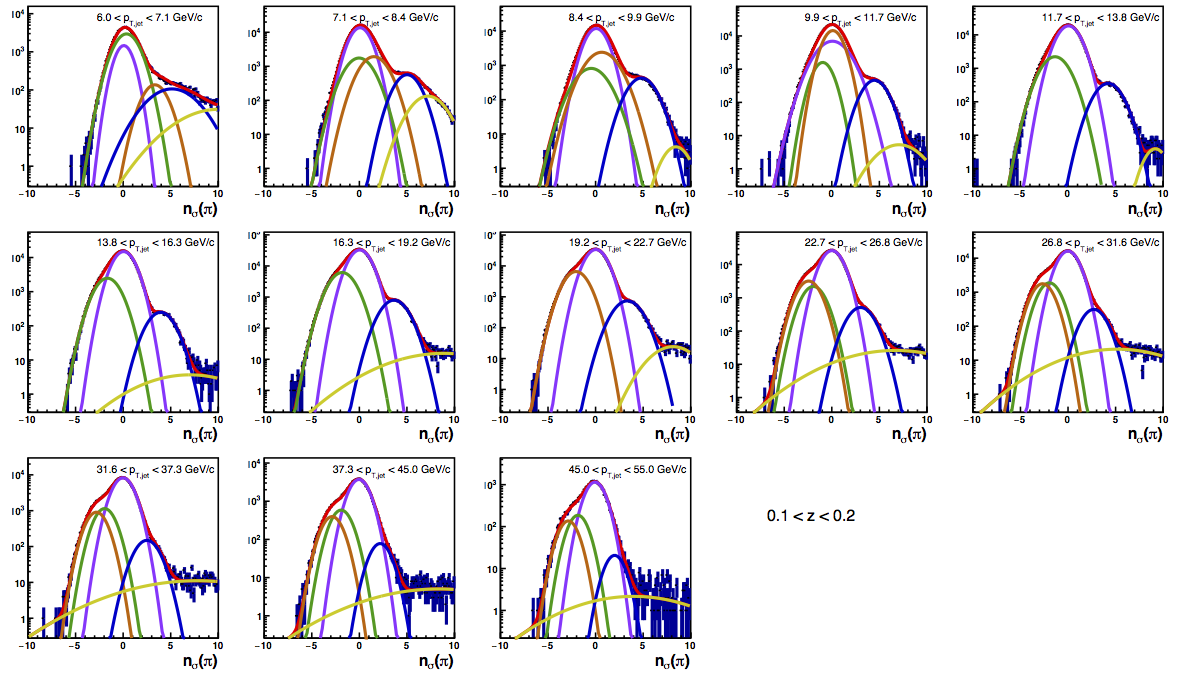
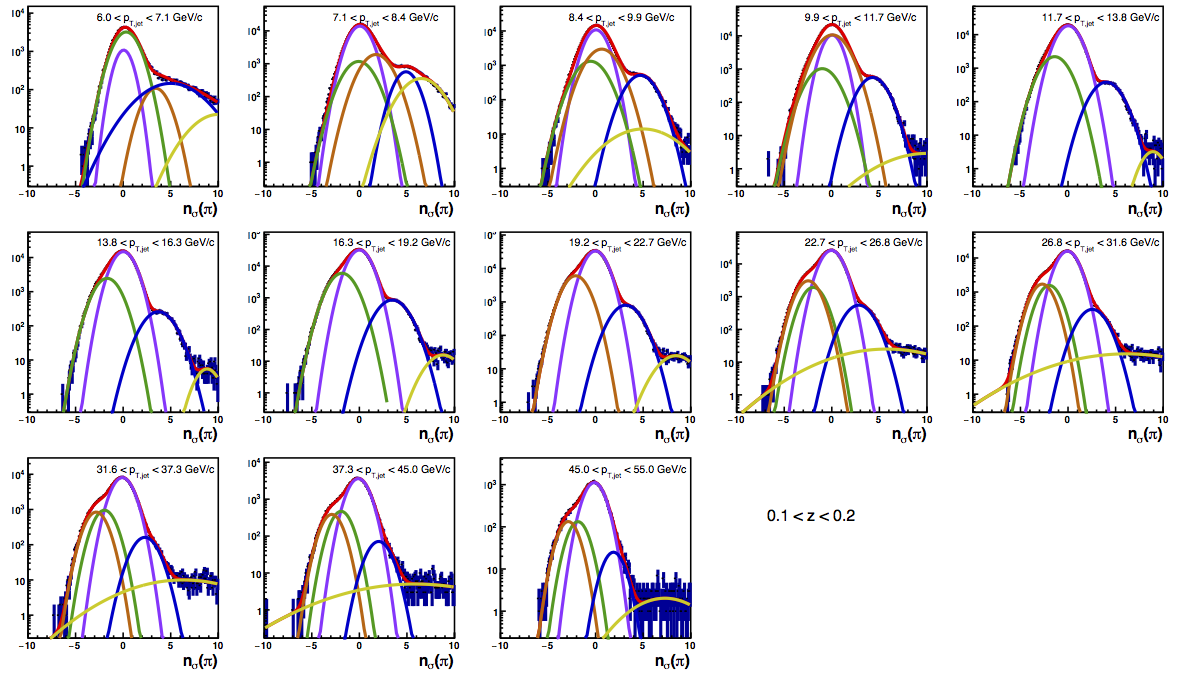
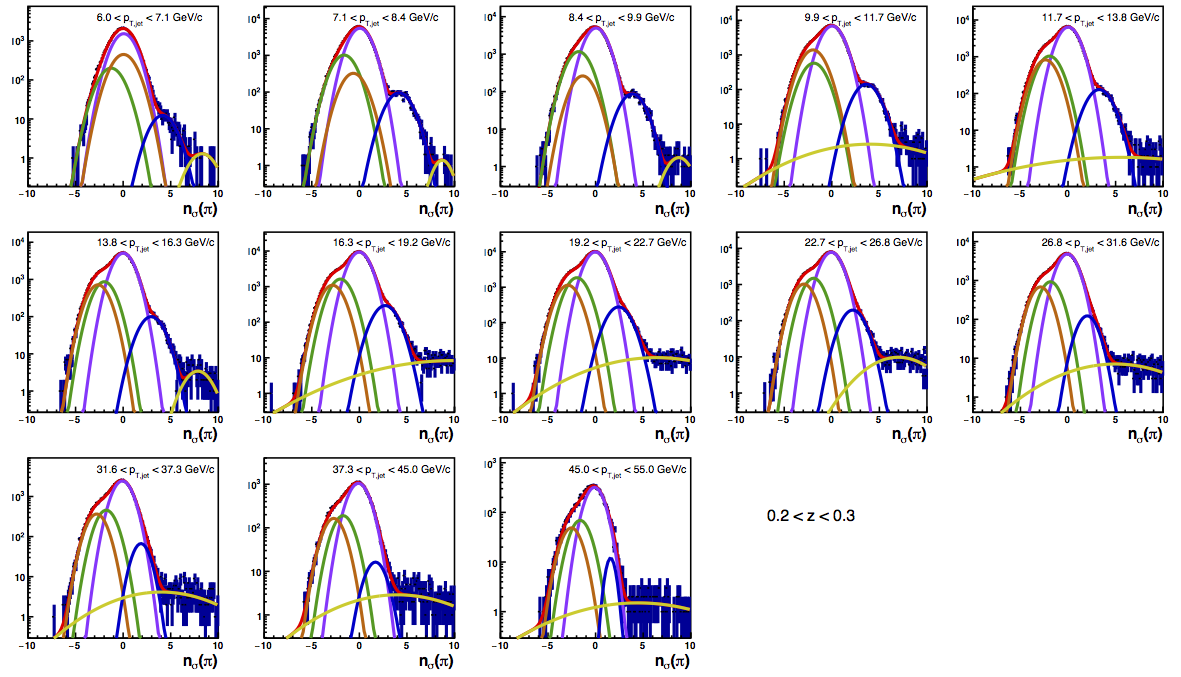
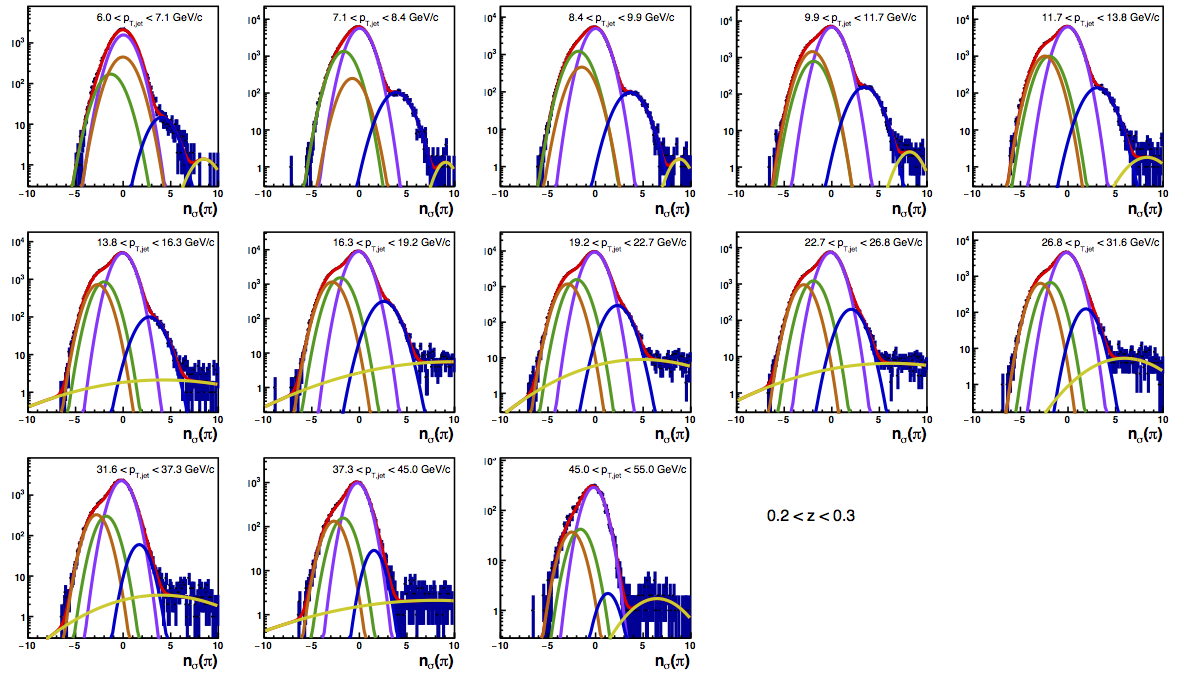
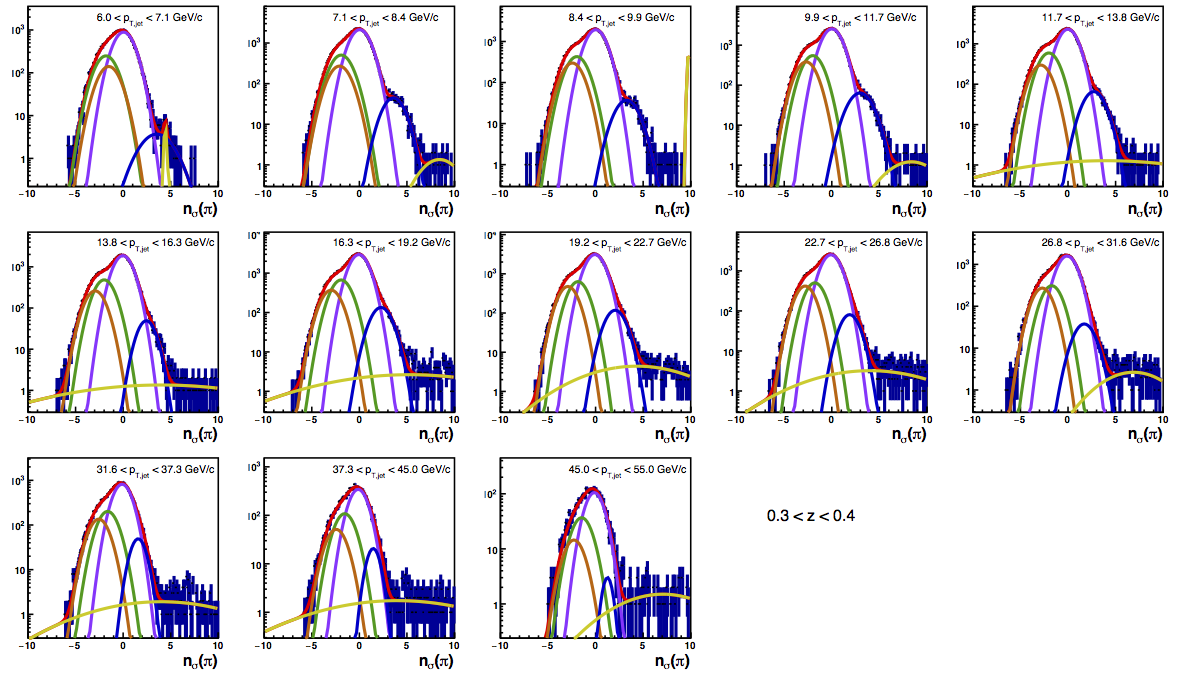
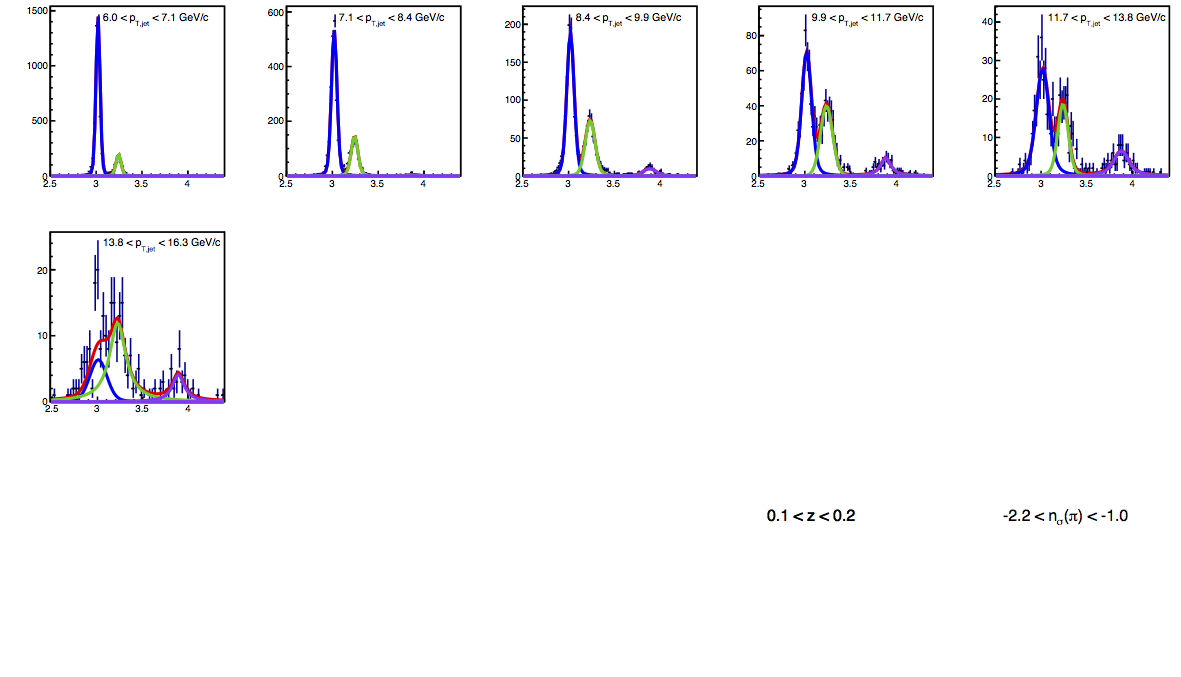
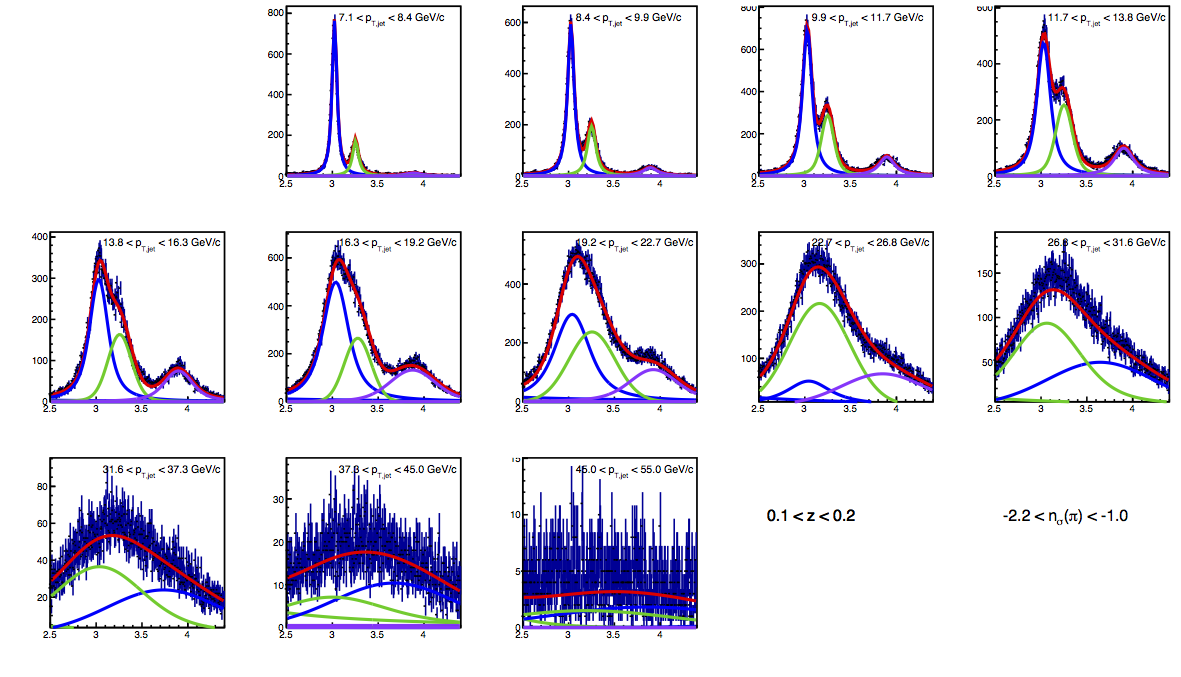
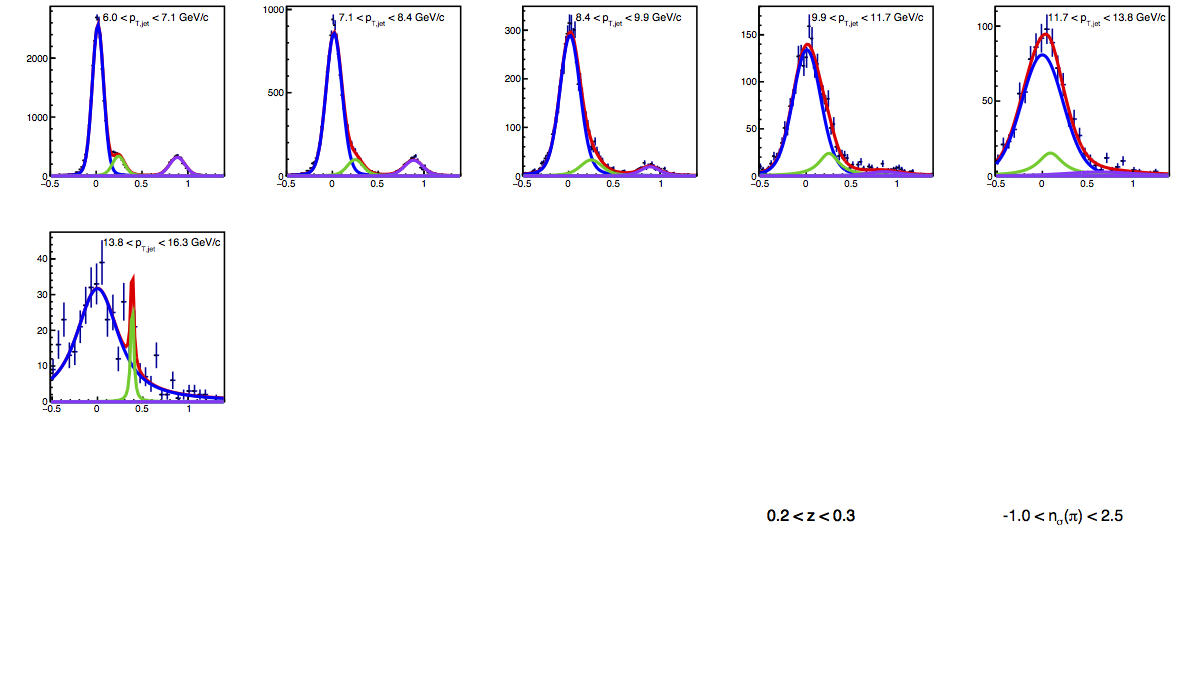
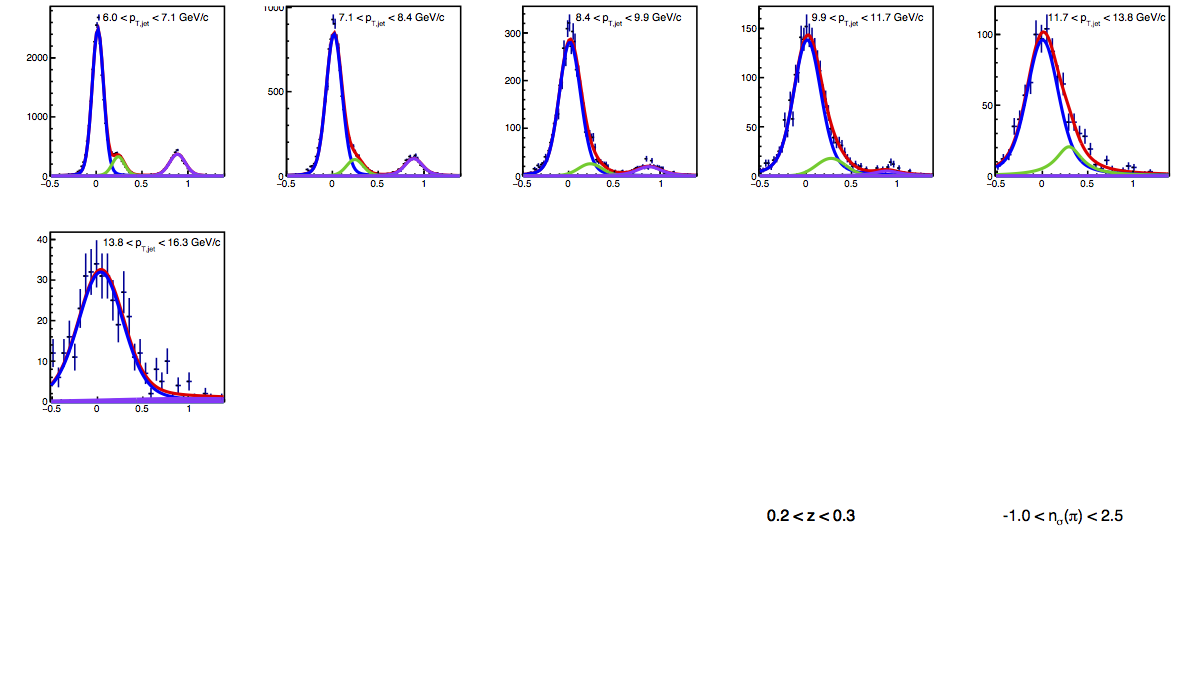
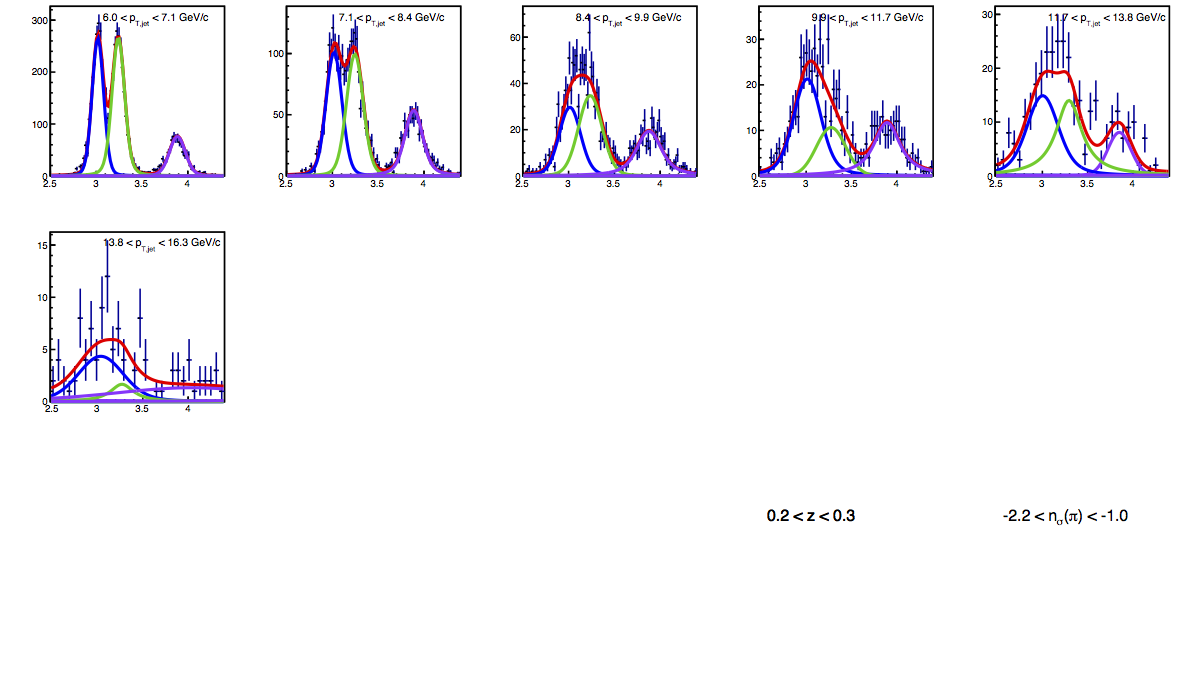
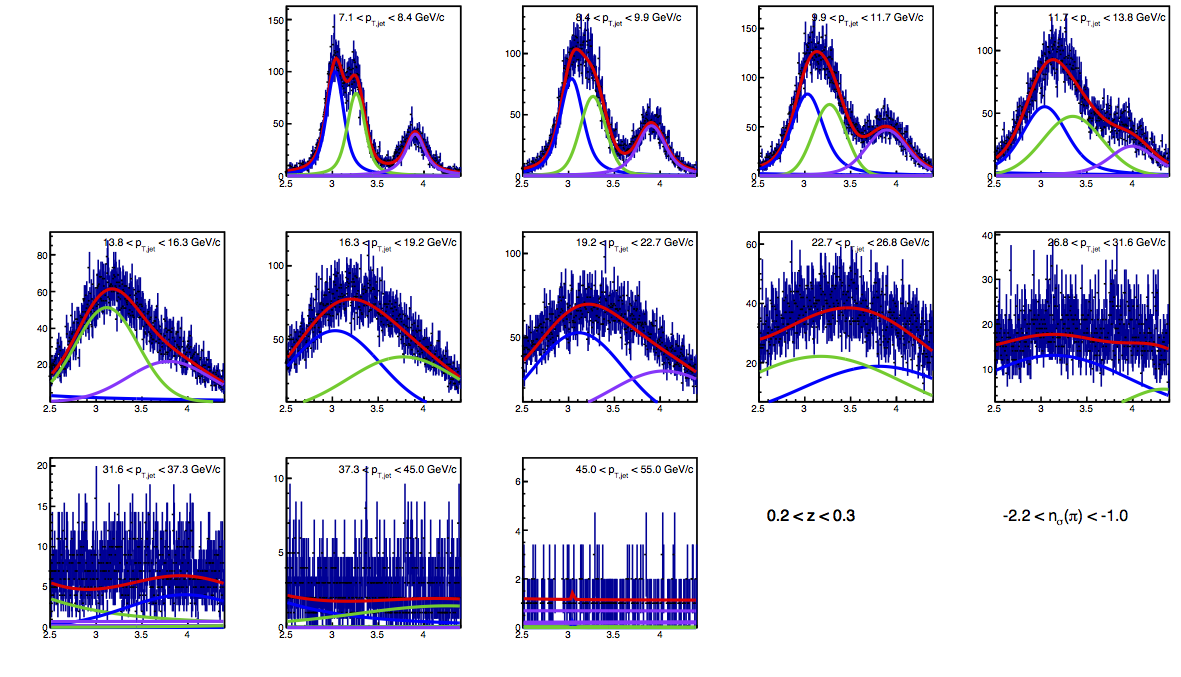
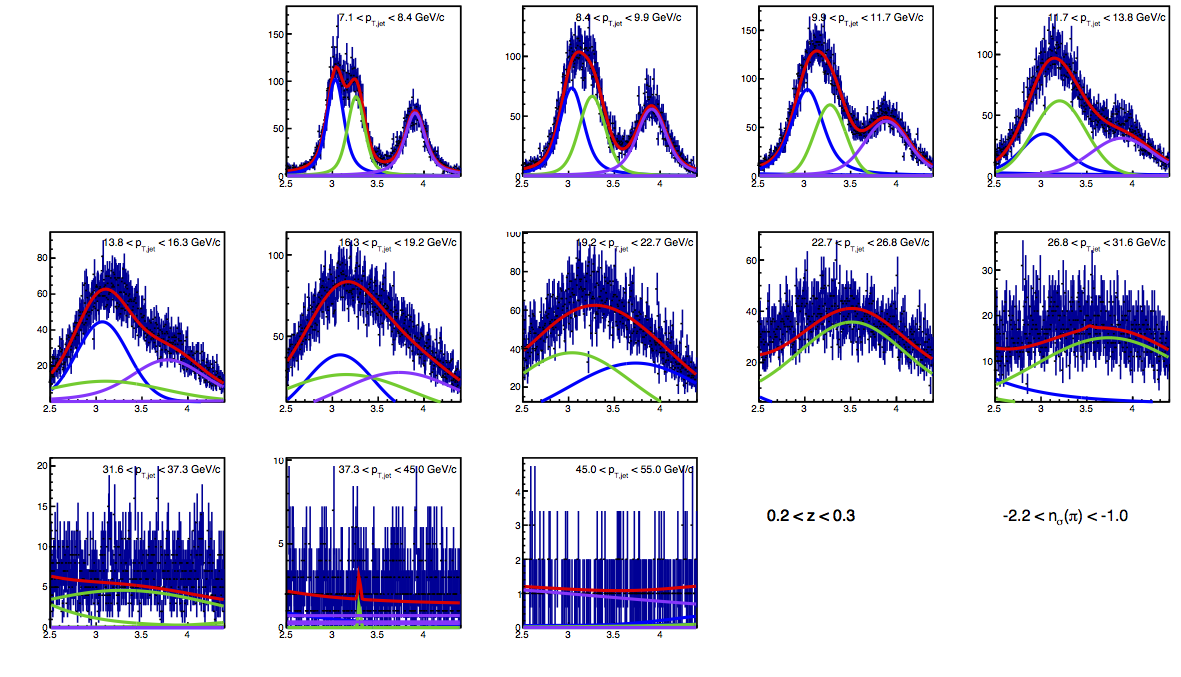
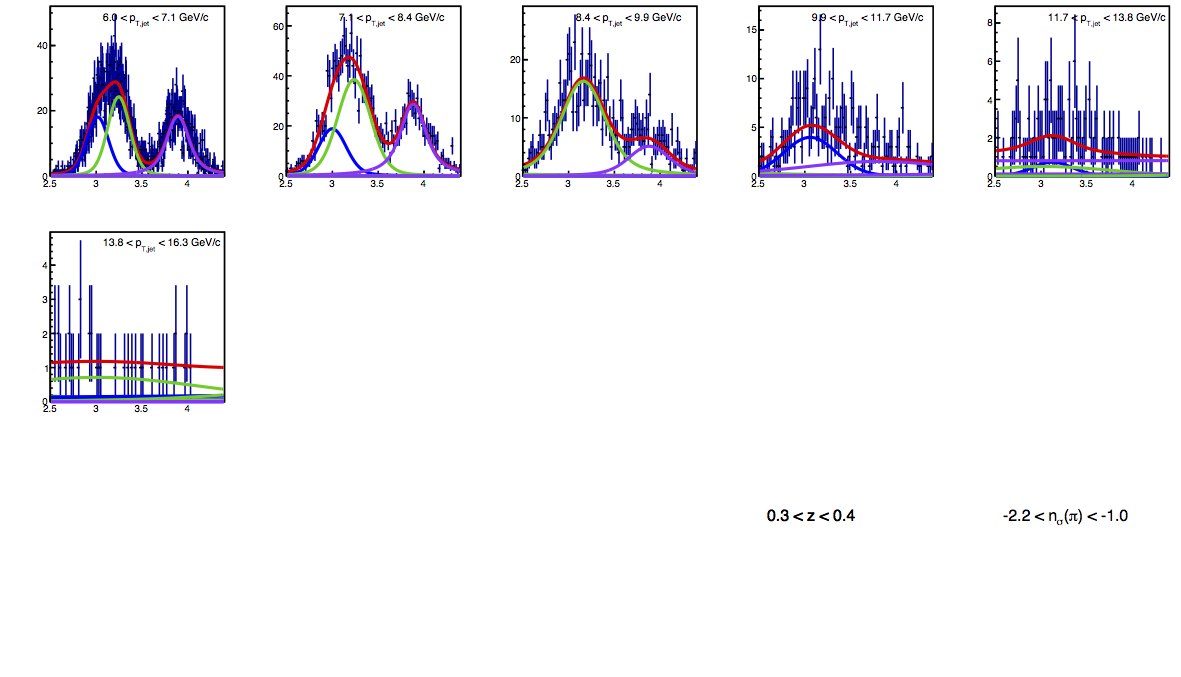
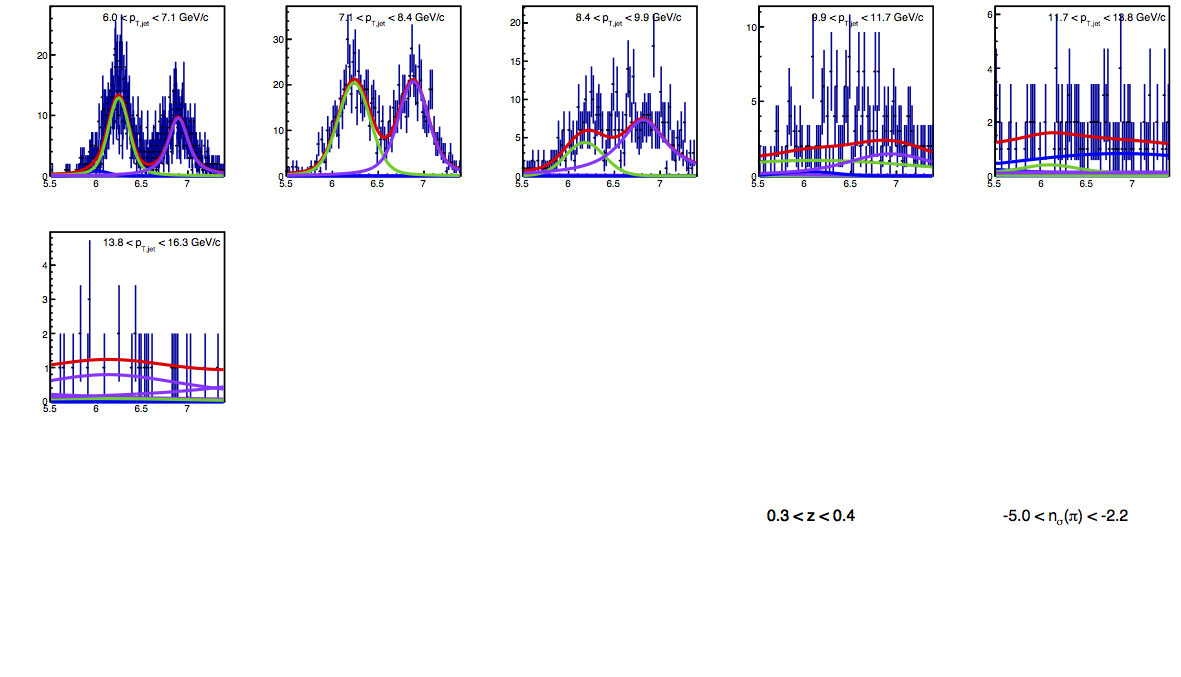
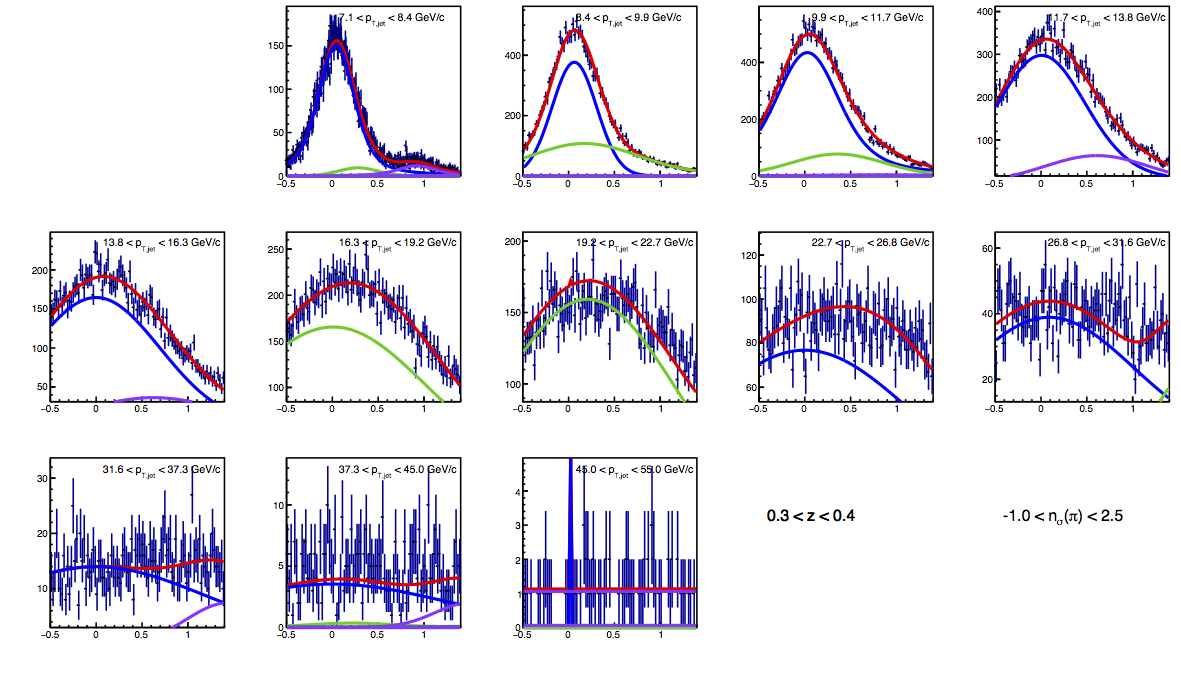
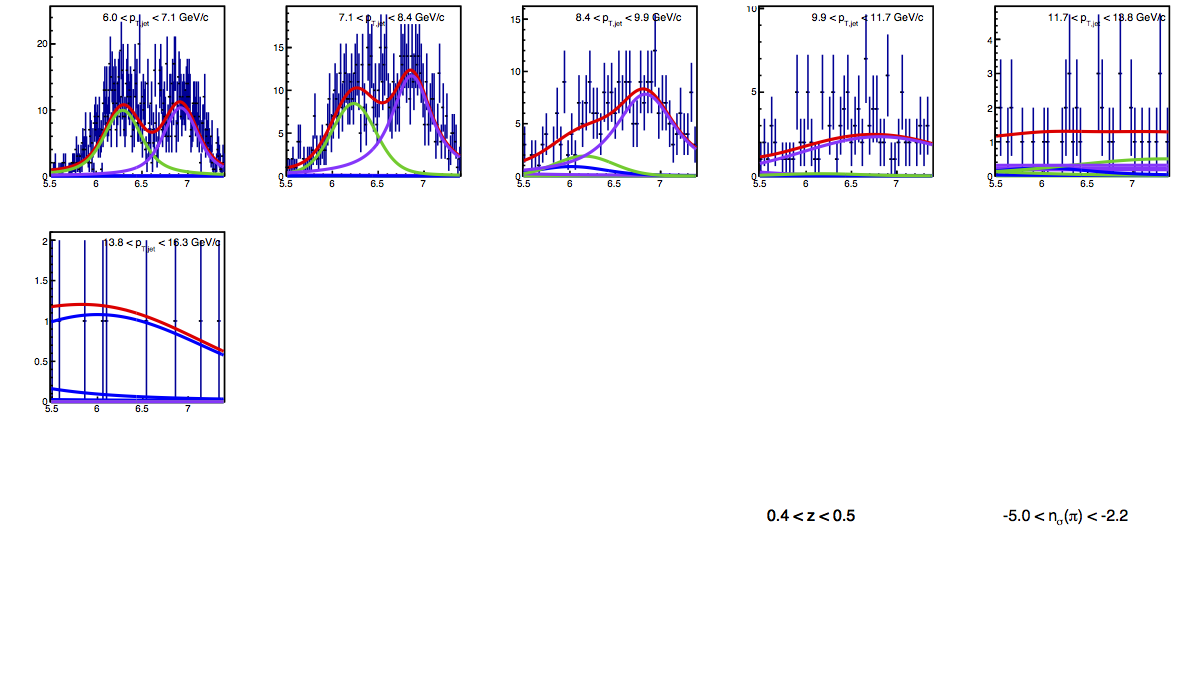
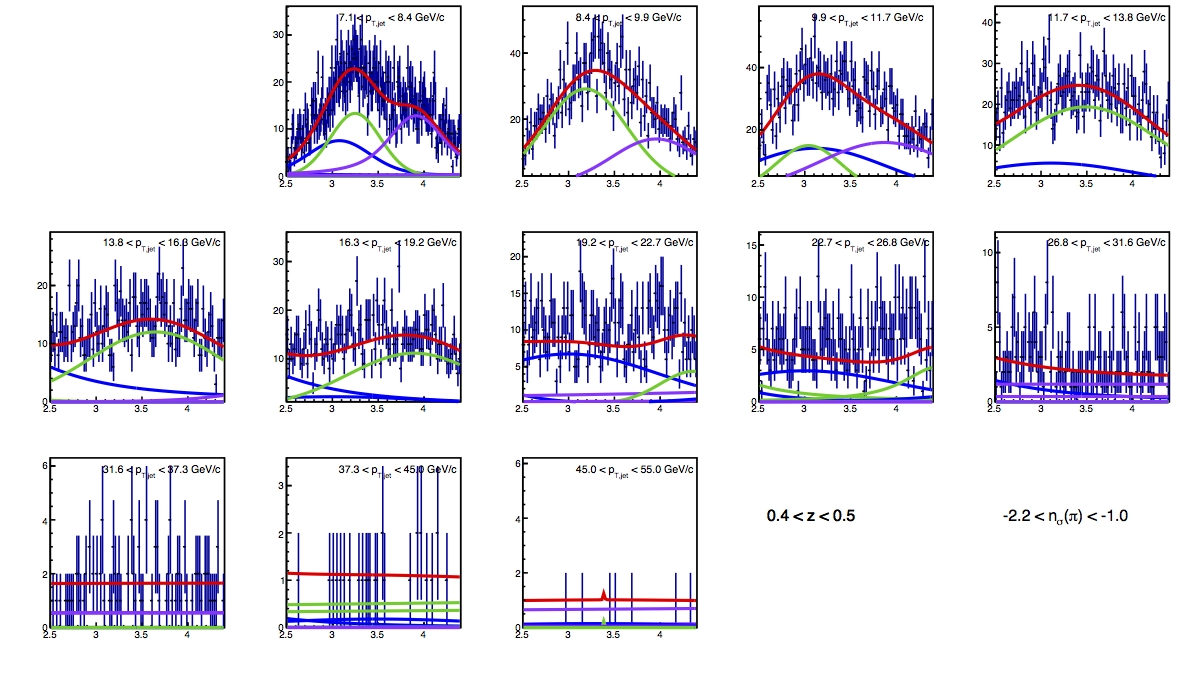
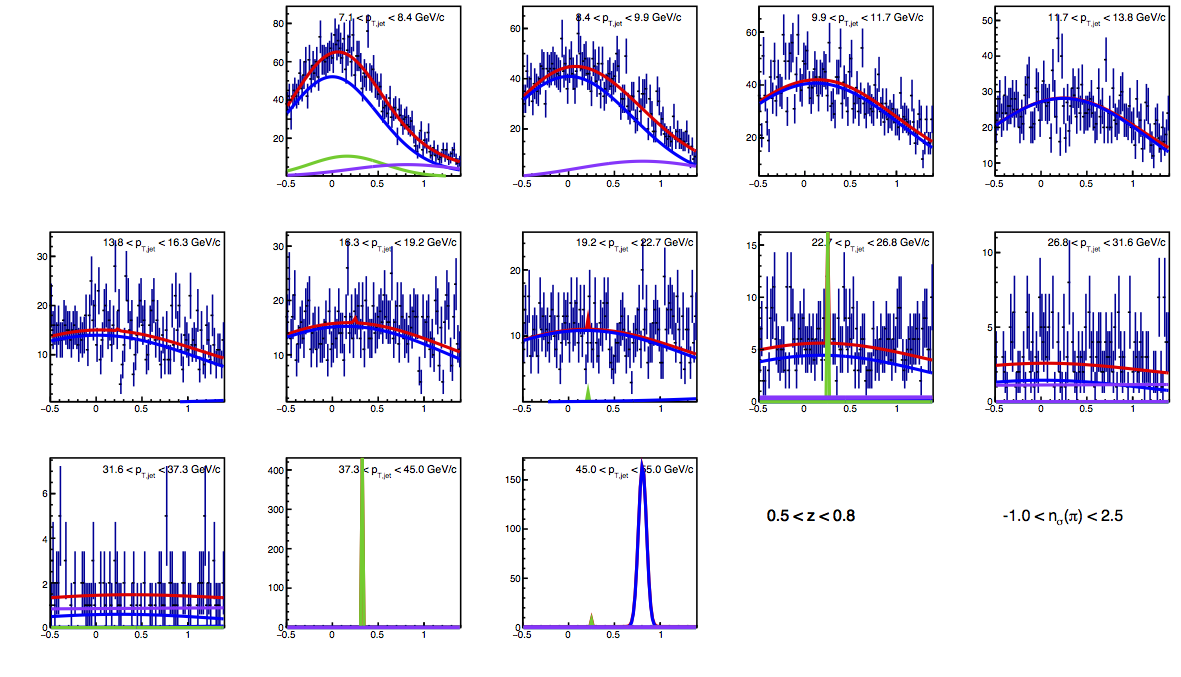
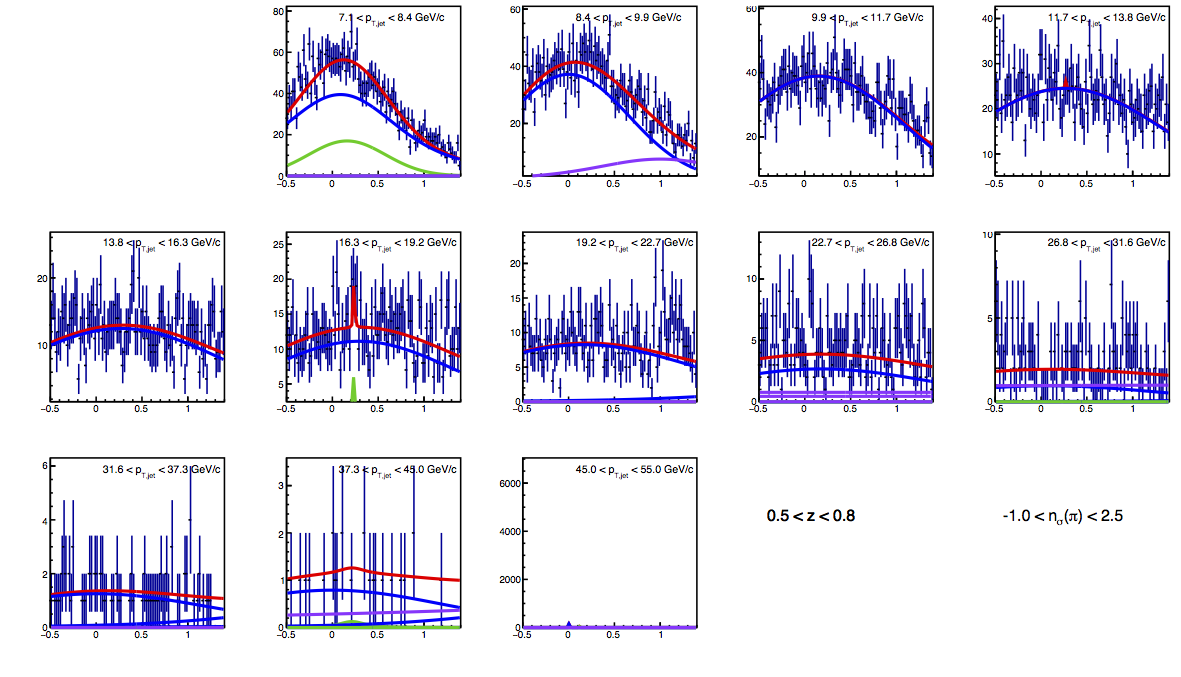
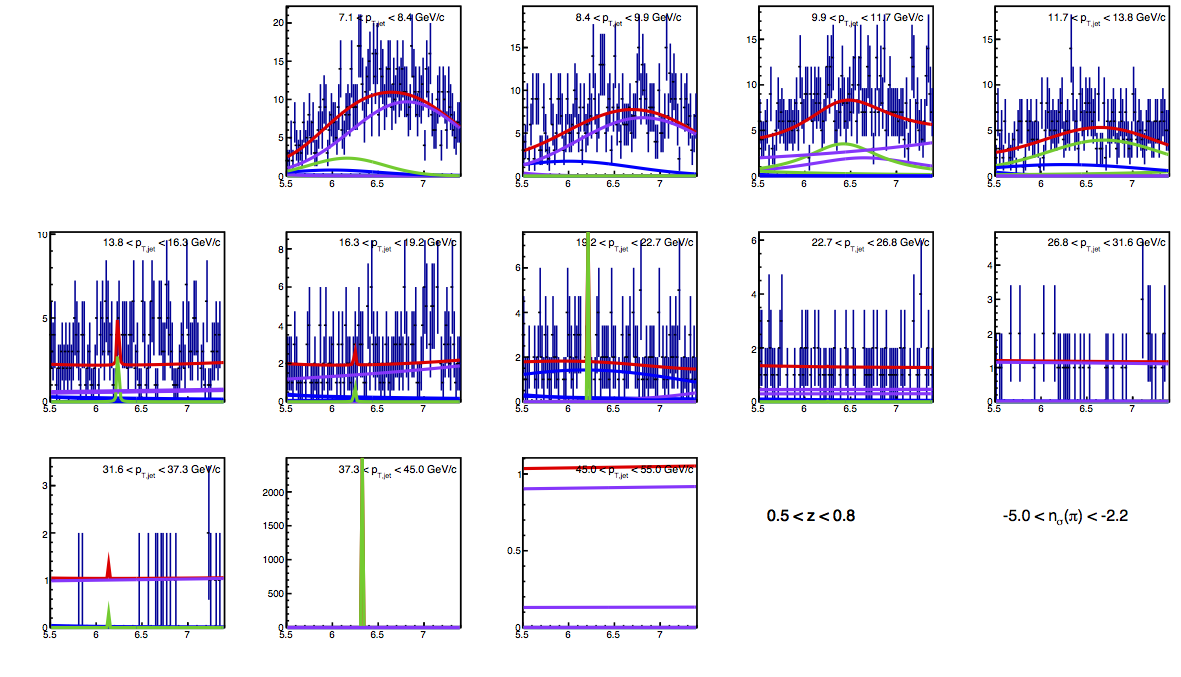
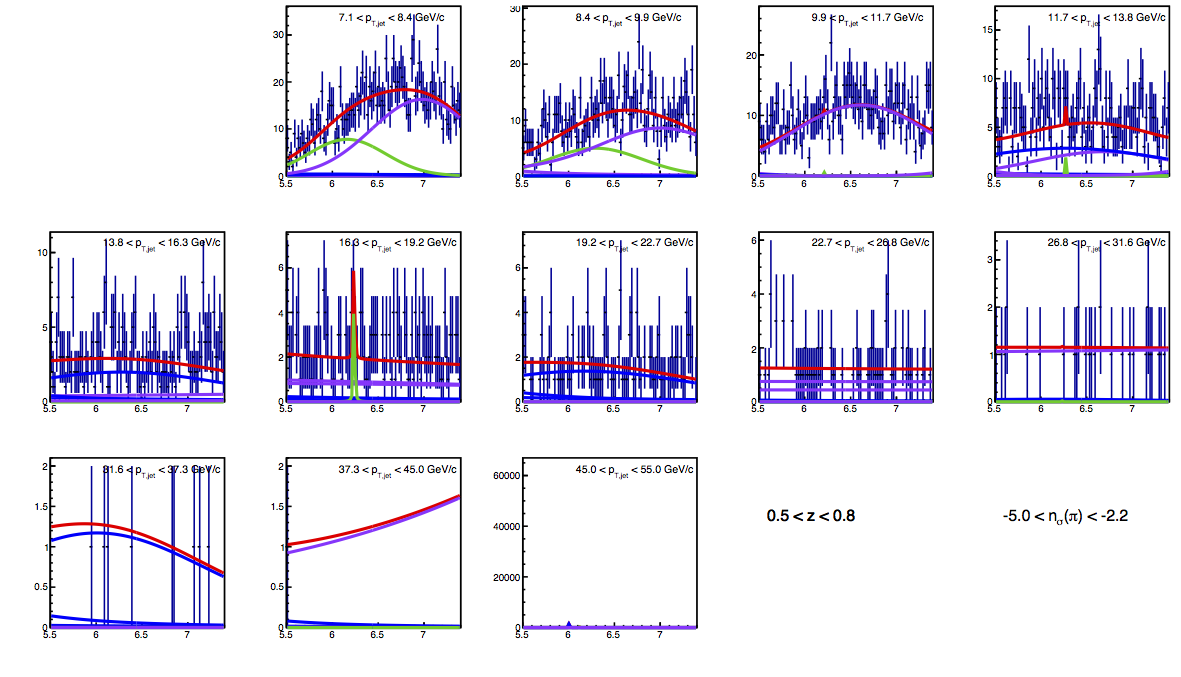
Figure 1 shows the standard dE/dx fits for the first three z-bins (0.1-0.2, 0.2-0.3, and 0.3-0.4) in bins of jet pT. The fits are clearly unreliable for 0.1 < z < 0.2 and 6 < pT < 22.7 GeV/c, what I've termed "low-pT" and "mid-pT." For the 0.2 < z < 0.3 bin, the fits are relatively stable for most pT bins, but clearly the proton band is traversing the pion band for the first few bins. By the time one gets to the 0.3 < z < 0.4 bin, the fits are relatively reliable. In most cases, the electron band is well-defined. In those instances where the peak is a bit ambiguous, the electron contribution is so small as to be practically negligible (note: the relavant region is -5 < nσ(π) < 2.5). The proposal, here, is as follows:
- Use dE/dx fits to set the electron fractions for all bins.
- Where possibly, e.g. for the "low" and "mid" pT region for 0.1 < z < 0.2 and the "low" region for 0.2 < z < 0.3, the TOF fits will set the π, K, and p fractions.
- For all other bins, the dE/dx fits will set the π, K, and p fractions.
To be more precise, the TOF fits can set the combined π+e fraction, and subtracting the e-fraction from the dE/dx fits can give the "corrected" π-fraction. In reality, this is a very minor correction, on the order of the statistical uncertainty of the combined fraction.
Fitting the TOF Mass Peaks
Investigation of the TOF mass distributions suggests that the peaks are not Gaussian but rather closer to Lorentzian. While neither function seems to fit the distributions very well, a Voigt profile (Lorentzian convoluted with a Gaussian) appears to do rather adequately. Thus, each peak will require parameters for the integral, centroid, Gaussian σ, and Lorentzian Γ. In principle, the centroids and widths of the TOF mass distributions should not depend upon the nσ(π) range, but rather only on momentum. Thus, the current proposal is to fit the mass distributions simultaneously for all three of the nσ(π) ranges, assuming a single set of centroids and widths for pions, kaons, and protons.
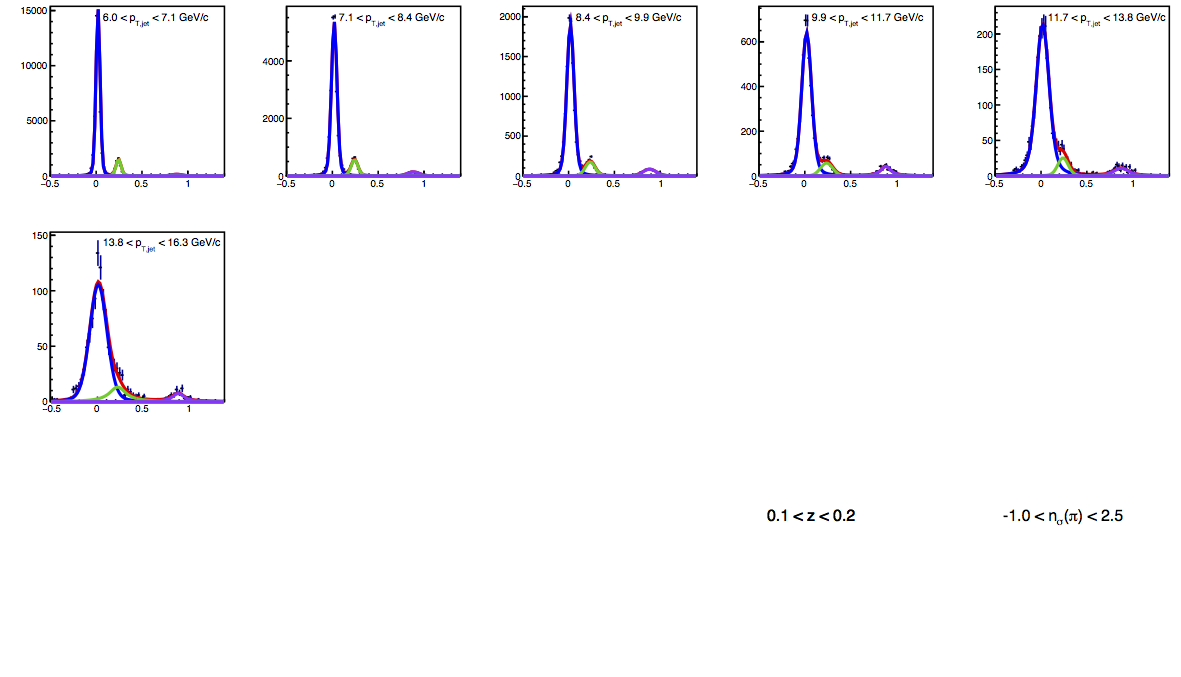
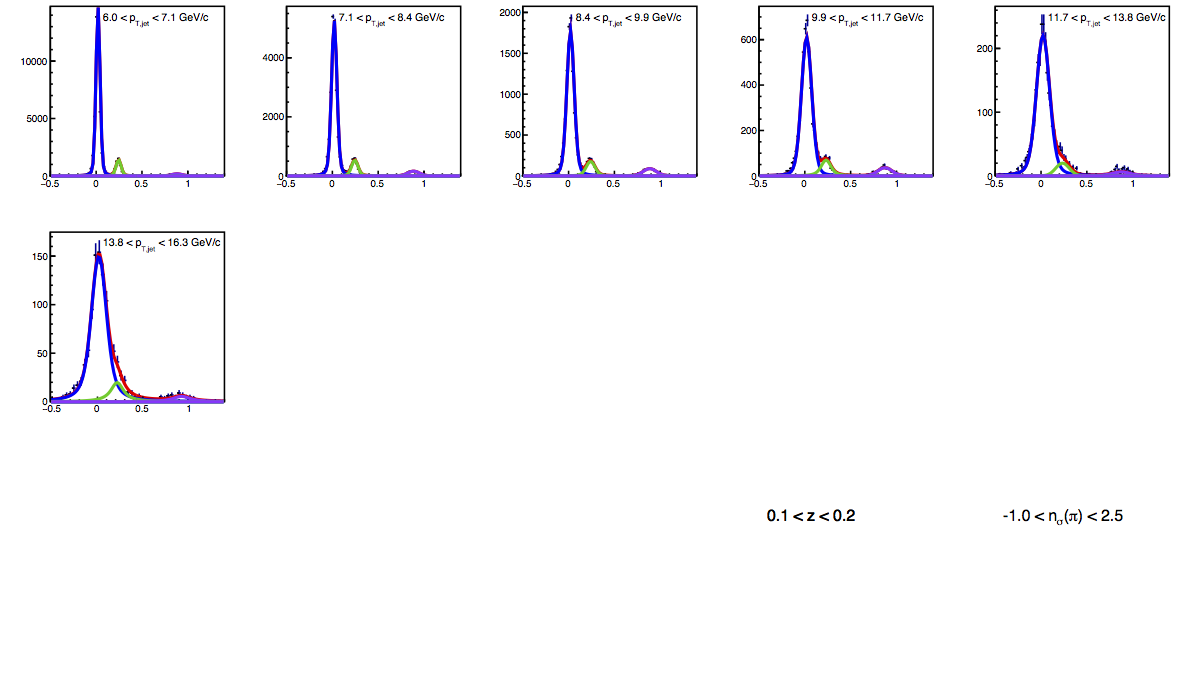
Distributions for the VPDMB events appear qualitatively different than those for jet-patch triggers. This is not such a surprise, since the jet-patch triggers do not necessarily satisify the VPD coincidence requirements and often rely on less-reliable timing information, introducing larger resolution effects. To account for trigger-dependent effects, I calculate the signal fractions separately for VPDMB and the combination of JP0+JP1+JP2 before determining the total signal fractions through the weighted average over the two trigger sets. The fits for the relevant z-bins (0.1 < z < 0.3) are shown in the figures, below.
At this point, my main concern for systematic uncertainties is a tendency to overestimate the kaon contributions in the pion-rich dE/dx region. This appears to occur in bins where the widths increase enough to cause significant overlap in all dE/dx regions. The fits in these bins tend to push the pion and kaon centroids closer to each other and enhance the kaon amplitude to smooth out the events in the pion high-mass tail. My suggestion is that we avoid using the TOF fits at these kinematics (p ≈ 3.5 GeV/c) and instead use the dE/dx fits, which appear sensible and are presently well-studied (or at least better studied than the TOF fits, at this point). These distributions can be revisited for future analyses and may be recoverable with better statitsics and more targeted analysis than is practical, here.
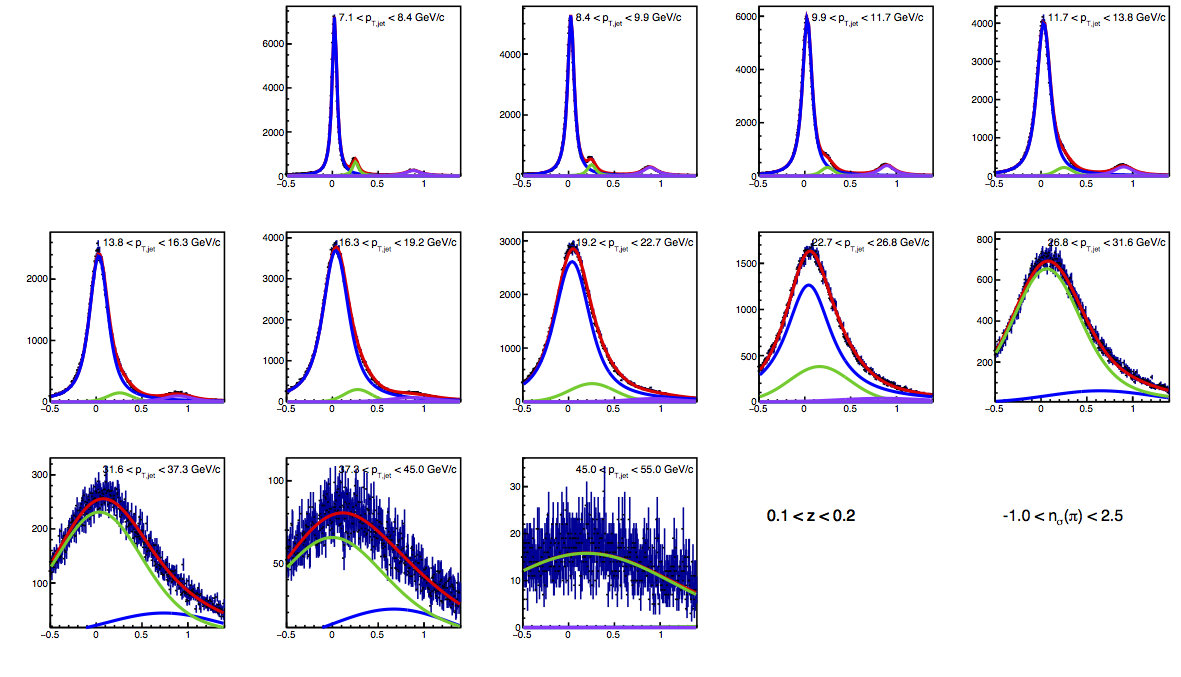
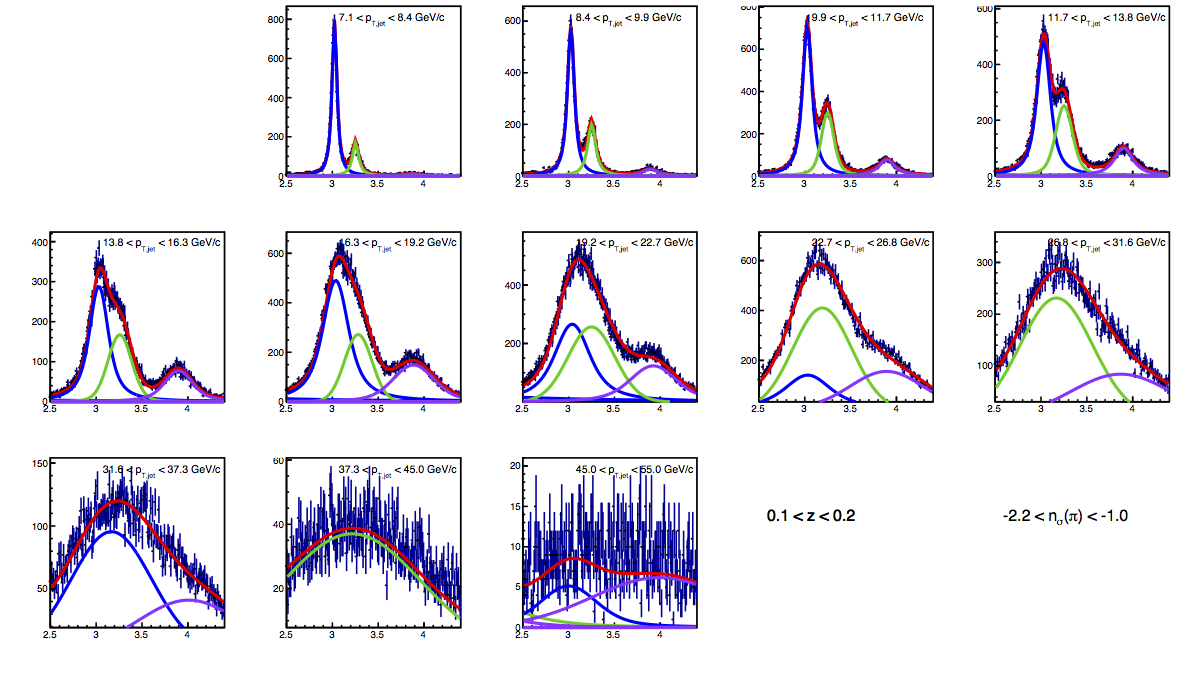
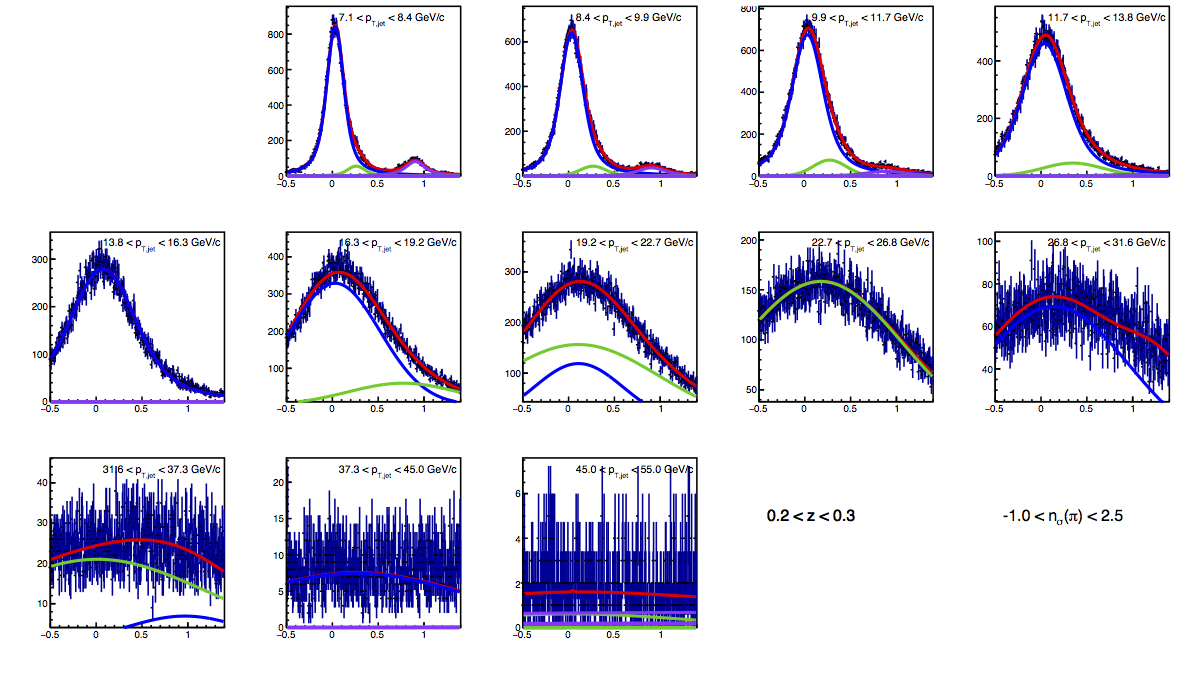
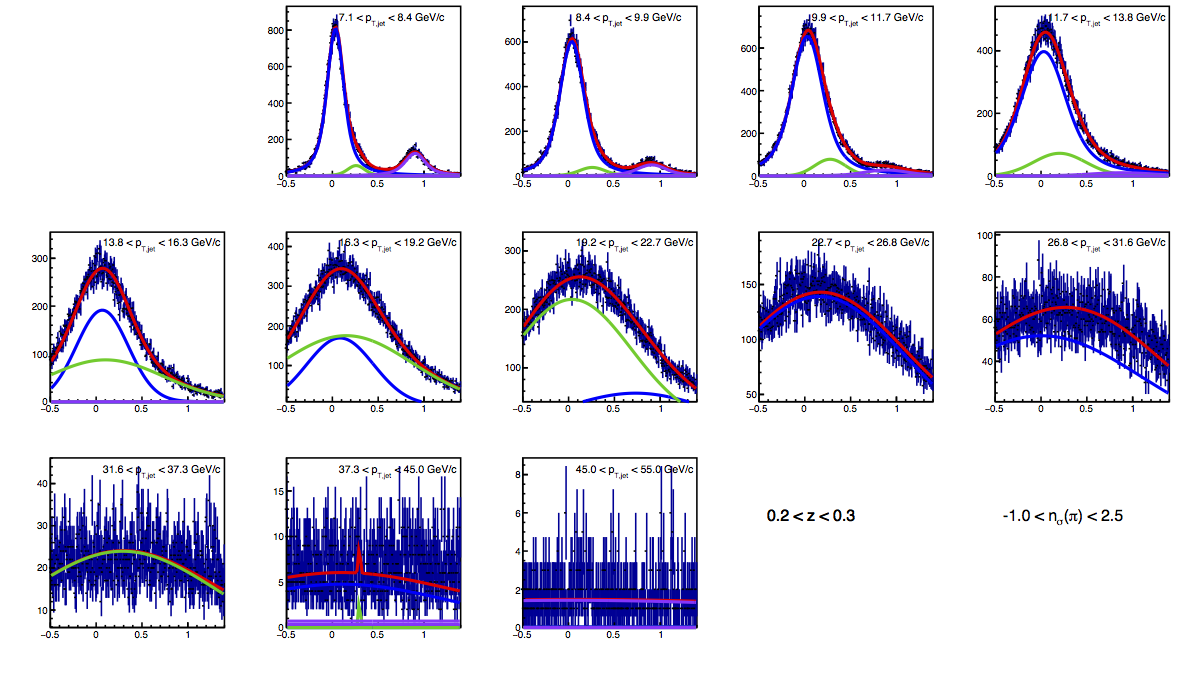
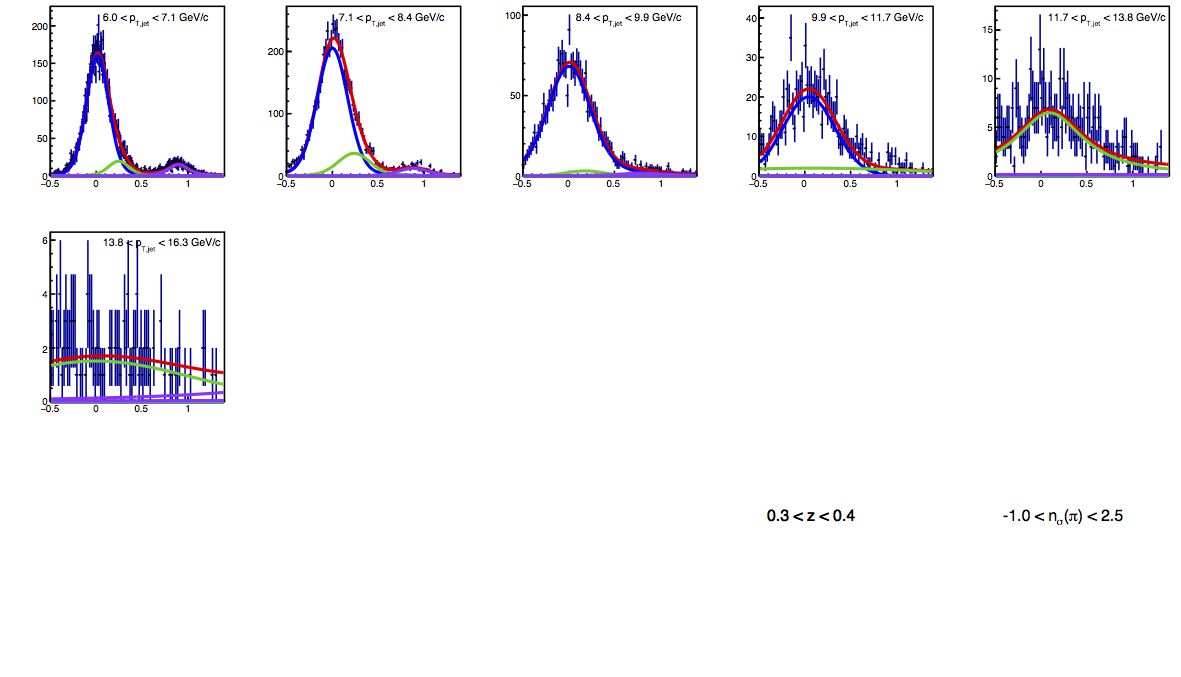
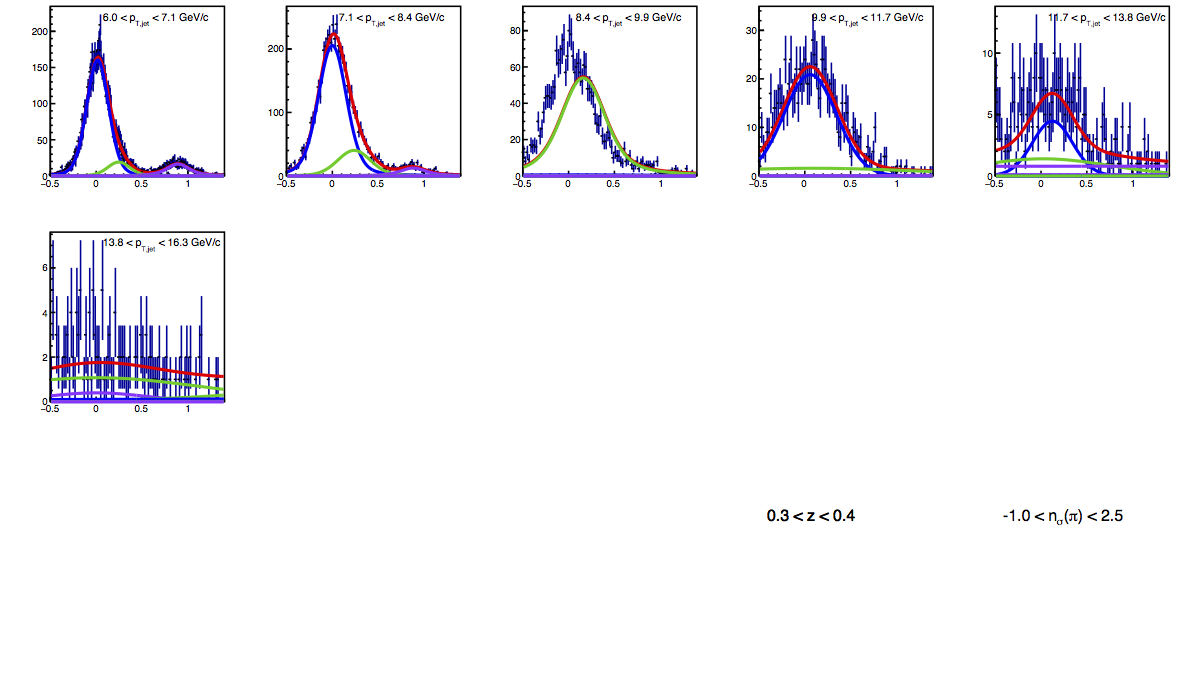
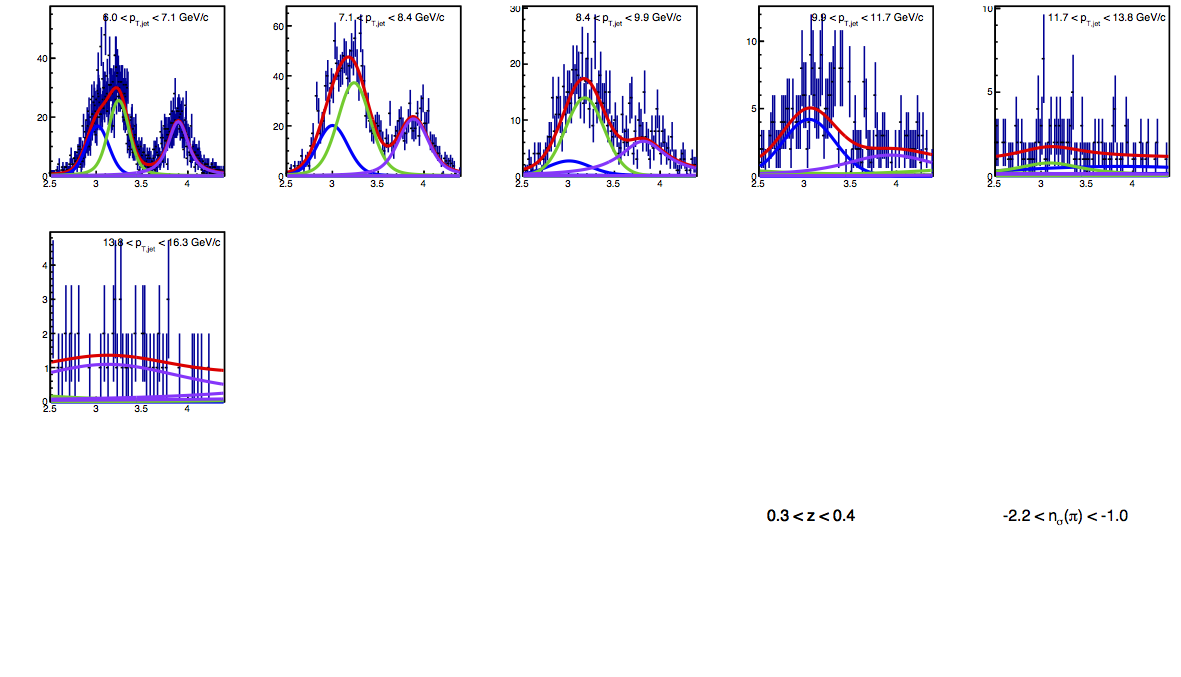
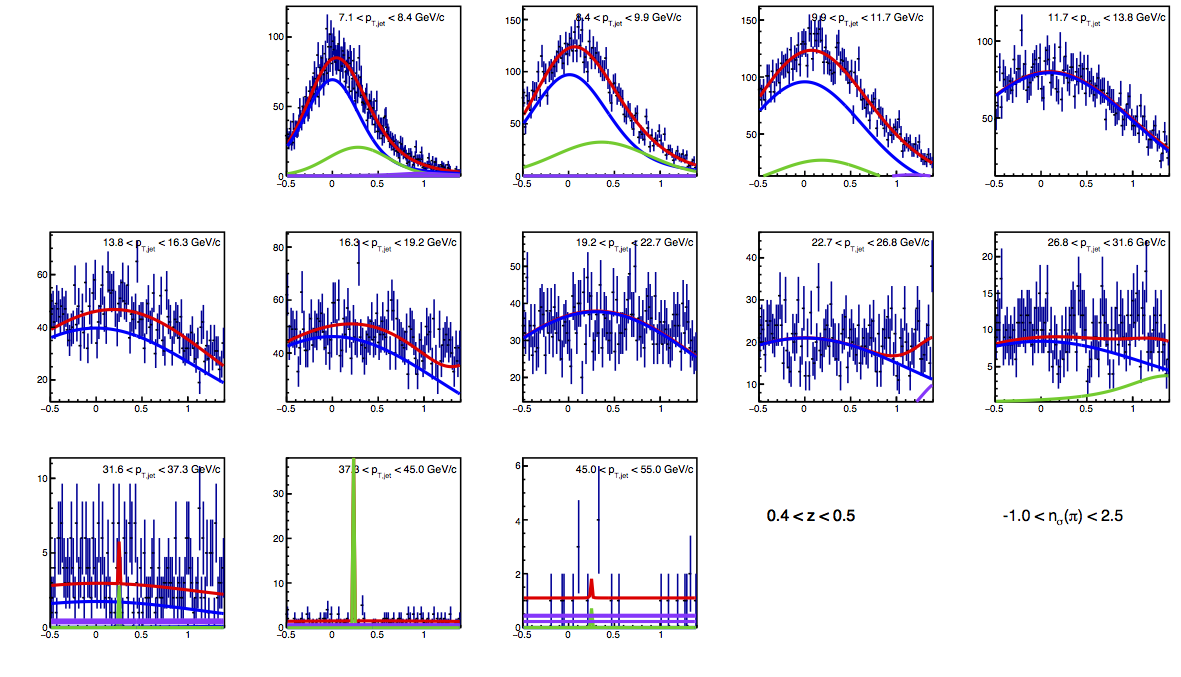
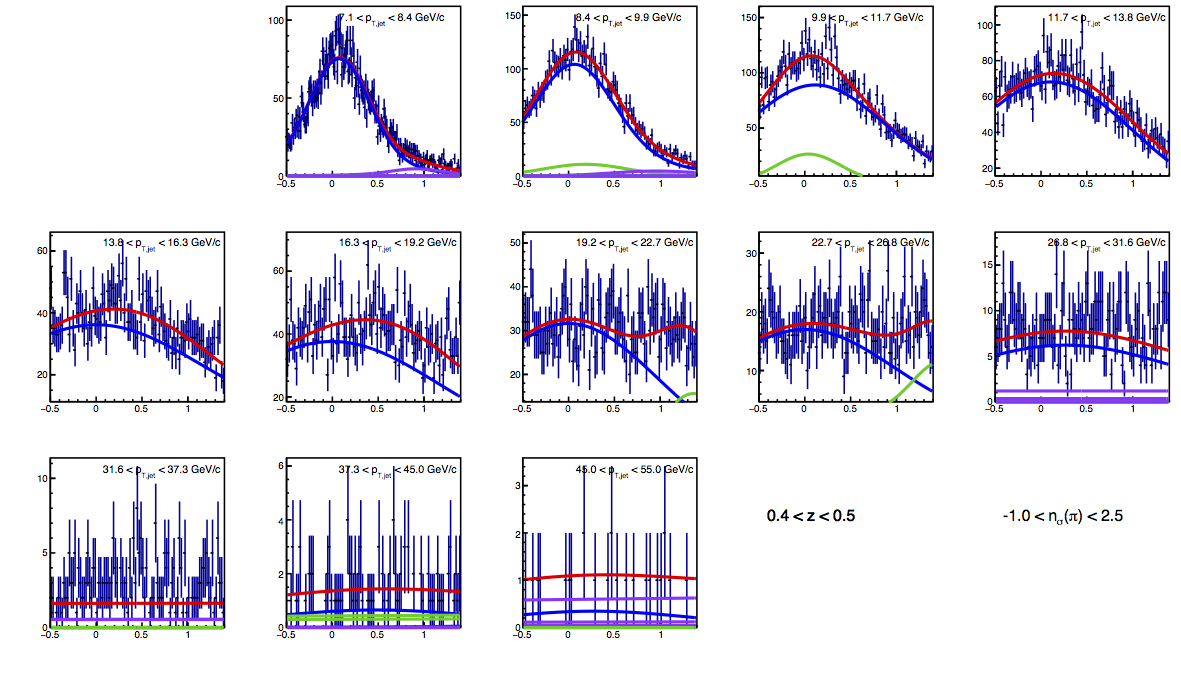
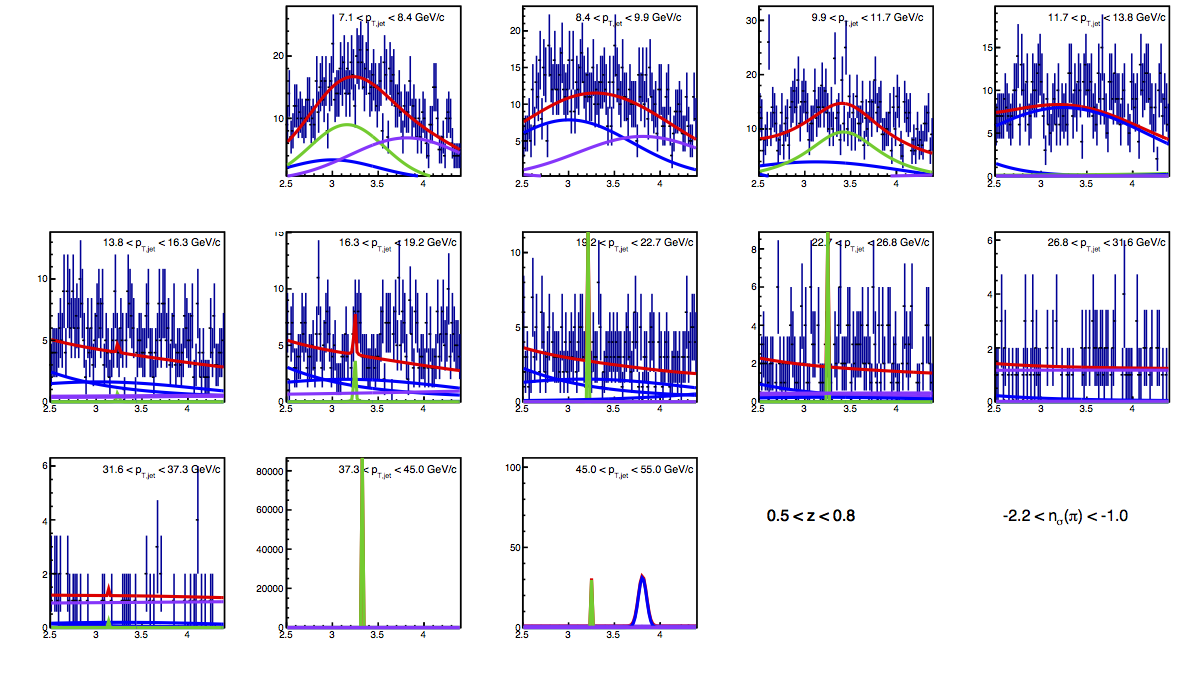
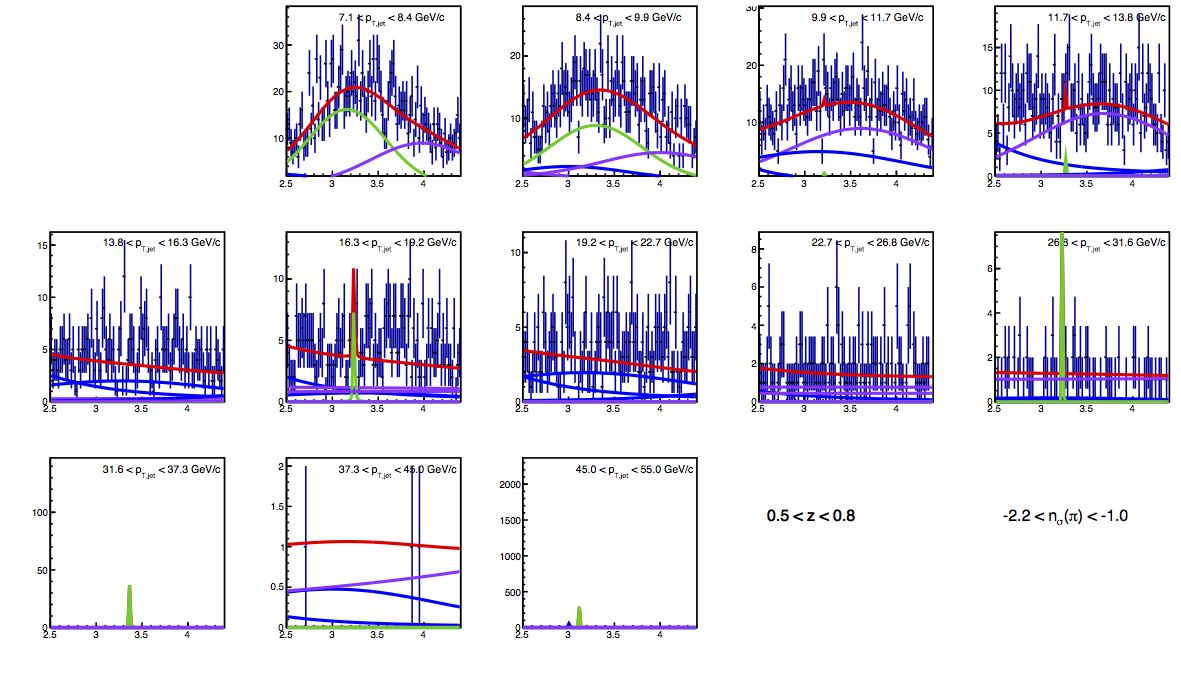
TOF Fits
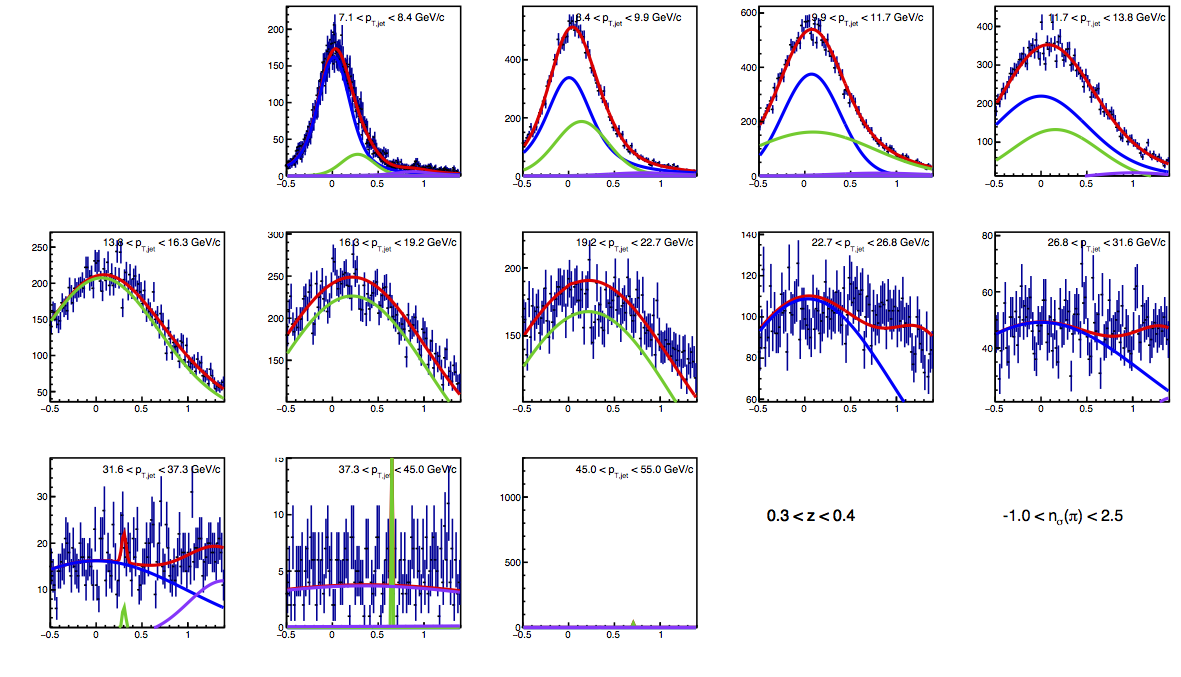
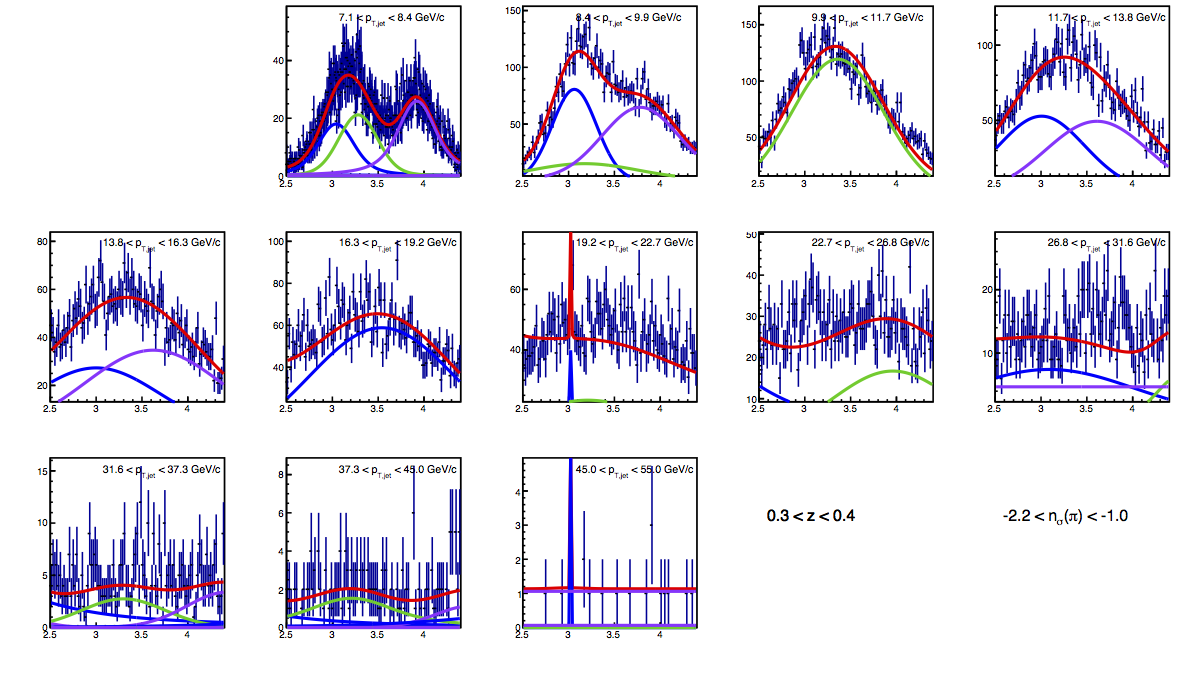
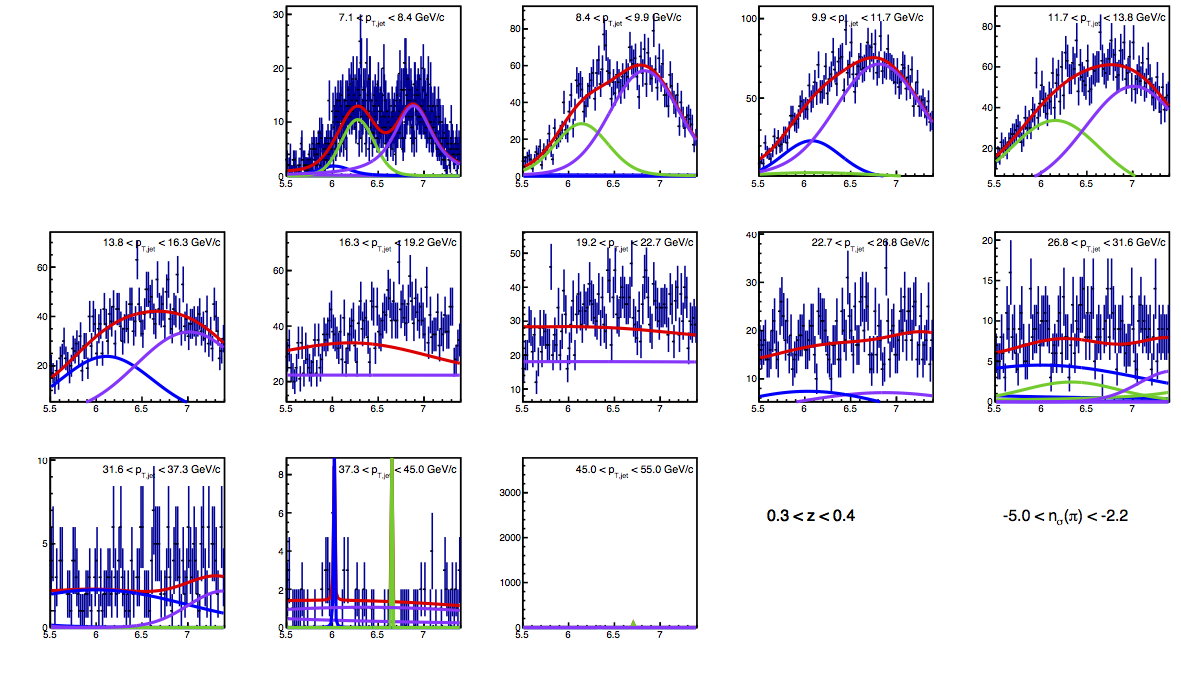
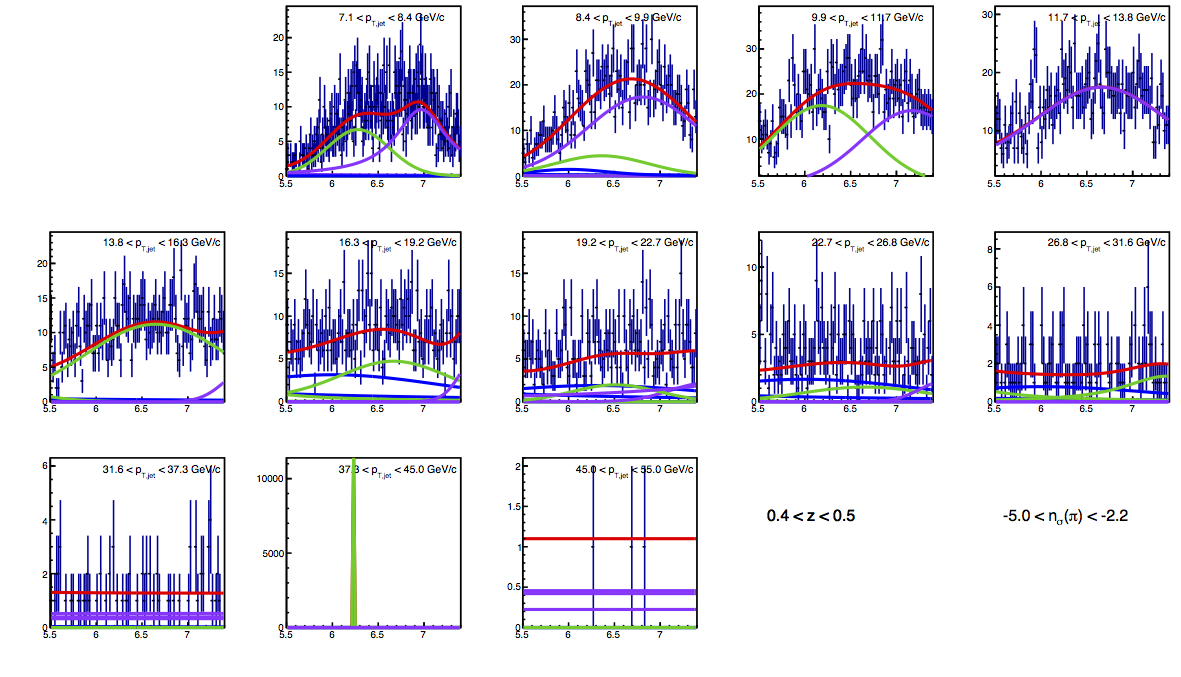
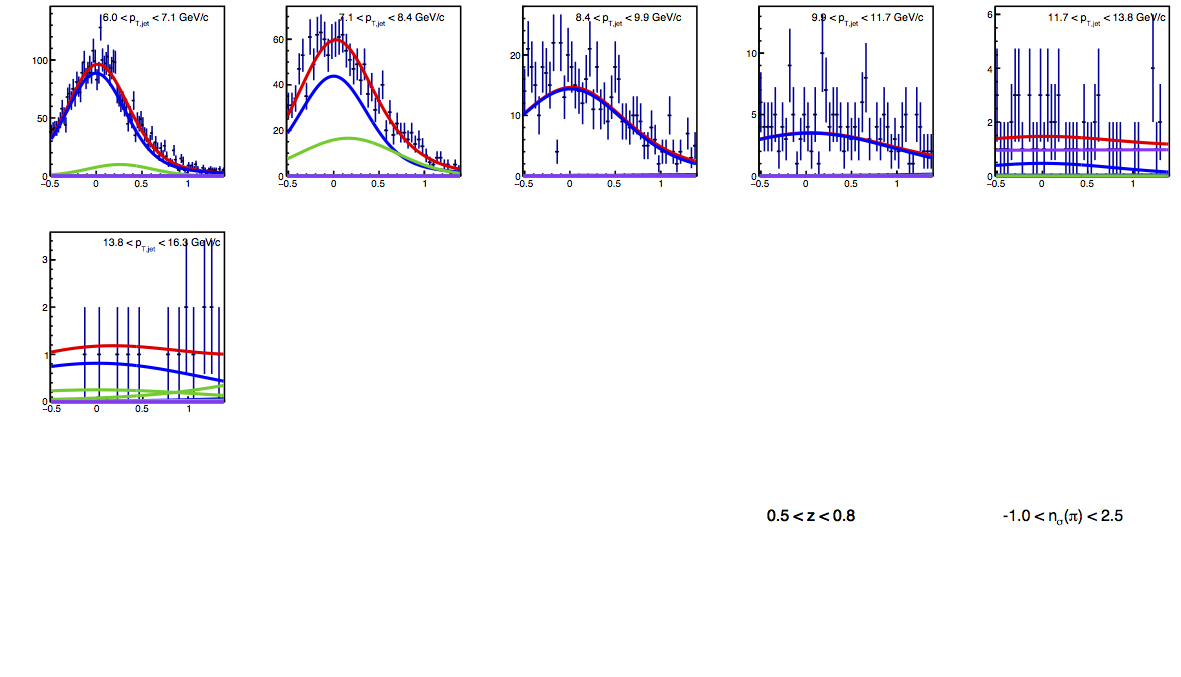
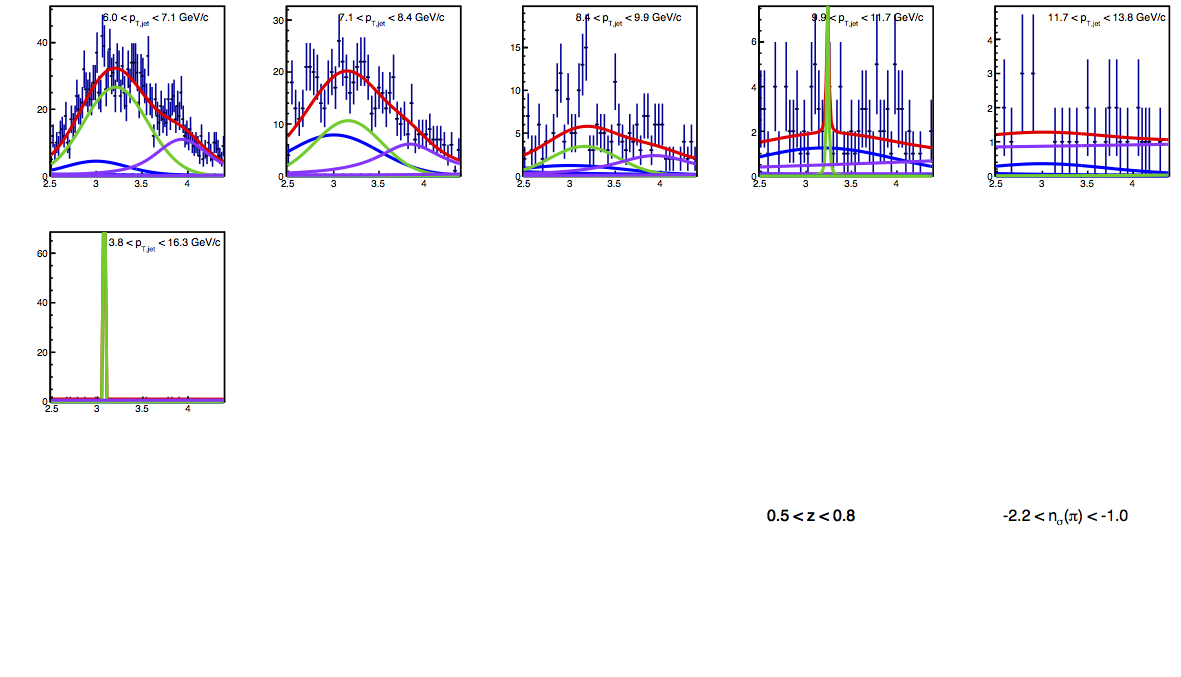
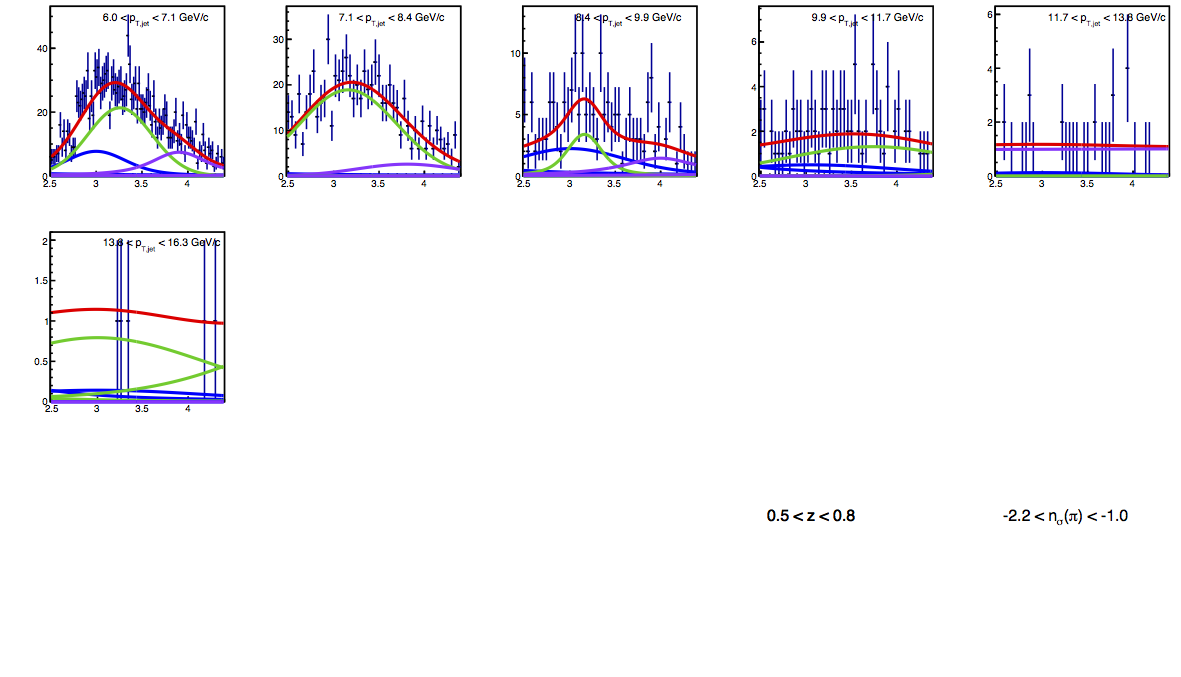
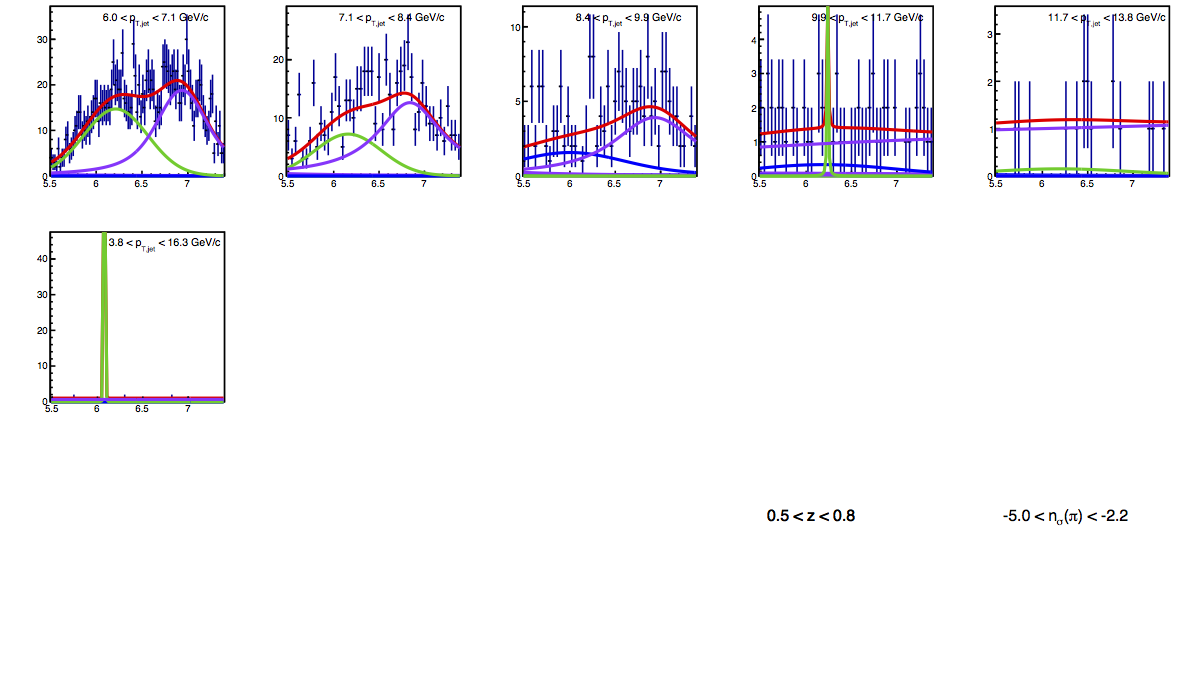
The figures below show the fits to the TOF mass distributions for VPDMB and JP events in the range 0.1 < z < 0.8. The curves are as follows:
- The red curves reflect the total fits.
- The blue curves reflect the pion peaks.
- The green curves reflect the kaon peaks.
- The violet curves reflect the protons.
The fits are shown separately for the different nσ(π) ranges. The fit function is constructed so that the particle centroids and widths do not depend upon the nσ(π) range. Note that the horizontal scale shifts by 3 (GeV/c2)2 for each iteration in nσ(π). This is simply an artifact of the fitting procedure.
One can see that as the momentum increases, the overlap of the peaks also increases. Below about 3.5 GeV/c, the overlap is typically small enough in the K or p-rich dE/dx regions that the fits converge relatively sensibly. However, above this momenta, the overlap is too much to constrain the fit reliably. For example, I made fairly involved efforts to tweak the p and K parameters in hopes of improving the fit in the 22.7-26.8 GeV/c bin of 0.1 < z < 0.2, but it simply will not converge sensibly without pegging parameter aginst the limits. Furthermore, the fit returns kaon fractions that seem much larger than what I would expect based upon the analogous dE/dx fits. I interpret this to be a combination of ambiguity in the fitted K and p widths from the K/p-rich regions and significant overlap of all peaks in the π-rich region. This bin contributes significantly to the high-pT Collins analysis (e.g. the AUT vs. z plot), so extracting reliable fractions is acutely important for this bin. I would advocate using the dE/dx fits for bins such as this one. However, for future analyses with better statistics, I would revisit these issues with more targeted data samples, e.g. through V0 decays as in the high-pT dE/dx NIM analysis.
The following outline my current estimates for bins where the TOF fits could be used for extracting signal fractions:
- 0.1 < z < 0.2
- 0.2 < z < 0.3
- 0.3 < z < 0.4
- 6 < pT < 8.4 GeV/c (Note: The VPDMB fit converges relatively sensibly for the 8.4-9.9 GeV/c bin and could potentially be used. However, the JP events are the majority of the statistics in this bin.)
- 0.4 < z < 0.5
- 6 < pT < 7.1 GeV/c (Note: the JP fit converges relatively sensibly for the 7.1-8.4 GeV/c bin, however, the kaon fractions appear overestimated for the π-rich region; so I am nervous about using it.)
- 0.5 < z < 0.8
A look at how the centroids and widths vary as a function of momentum or βγ is posted below.
Figure 2: VPDMB Distributions for 0.1 < z < 0.2
| Positive Charge |
Negative Charge |
 |
 |
 |
 |
 |
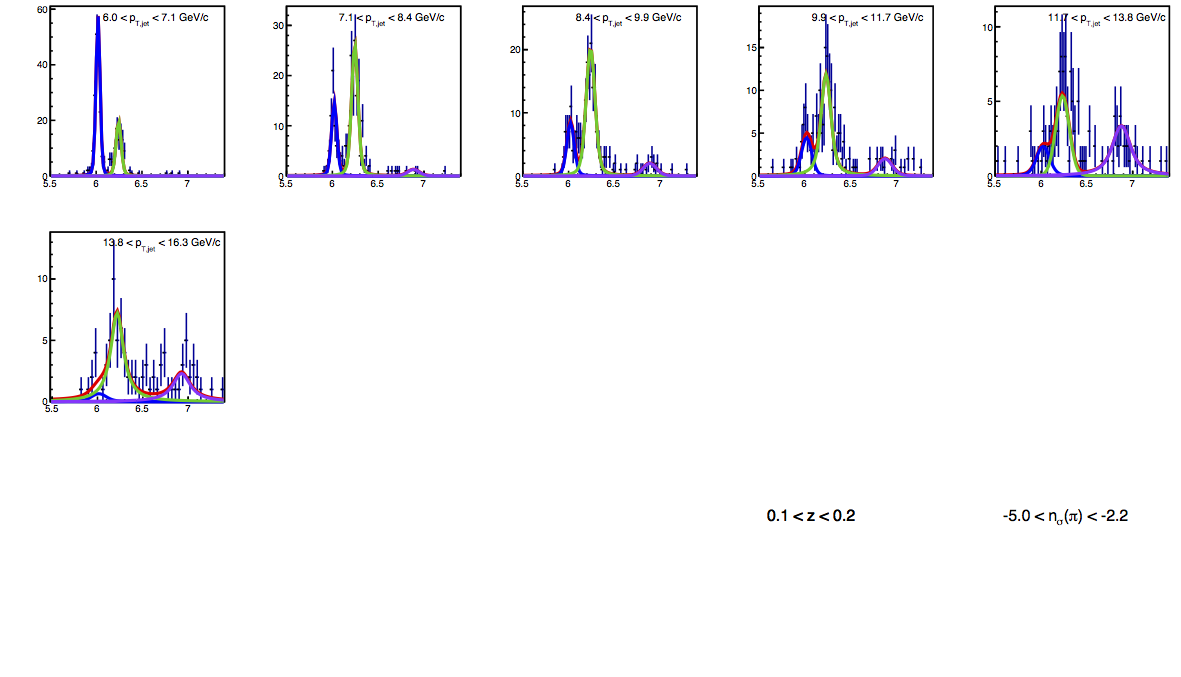 |
Figure 3: JP Distributions for 0.1 < z < 0.2
| Positive Charge |
Negative Charge |
 |
 |
 |
 |
 |
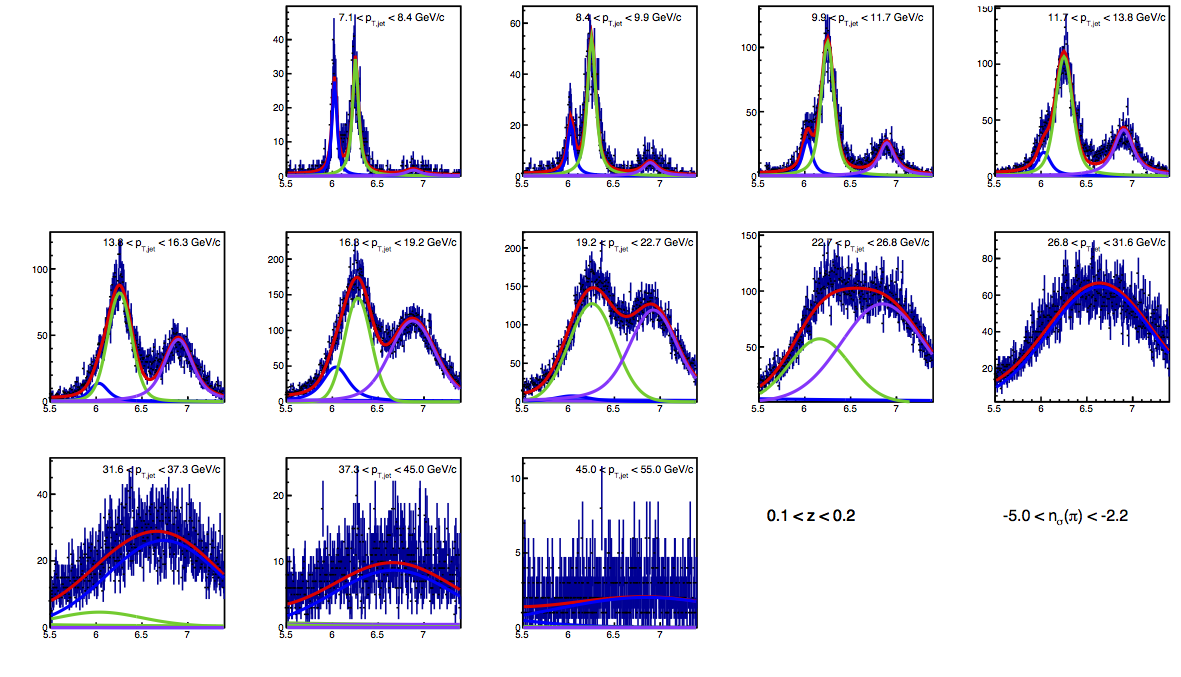 |
Figure 4: VPDMB Distributions for 0.2 < z < 0.3
| Positive Charge |
Negative Charge |
 |
 |
 |
 |
 |
 |
Figure 5: JP Distributions for 0.2 < z < 0.3
| Positive Charge |
Negative Charge |
 |
 |
 |
 |
 |
 |
Figure 6: VPDMB Distributions for 0.3 < z < 0.4
| Positive Charge |
Negative Charge |
 |
 |
 |
 |
 |
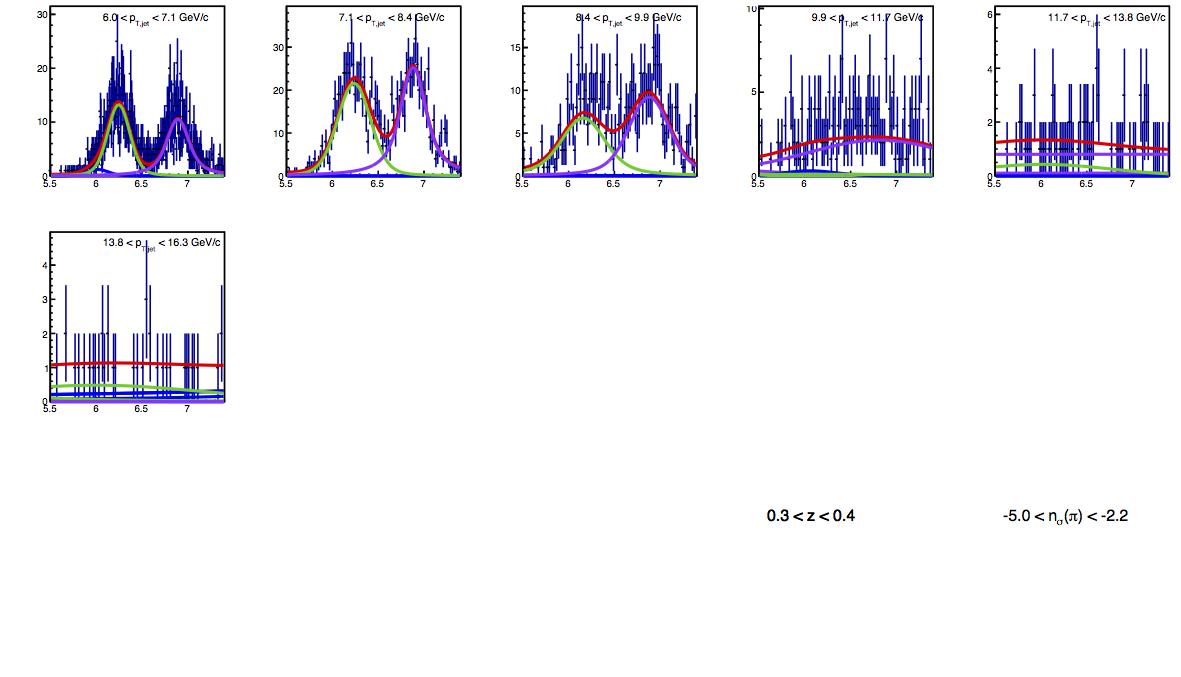 |
Figure 7: JP Distributions for 0.3 < z < 0.4
| Positive Charge |
Negative Charge |
 |
 |
 |
 |
 |
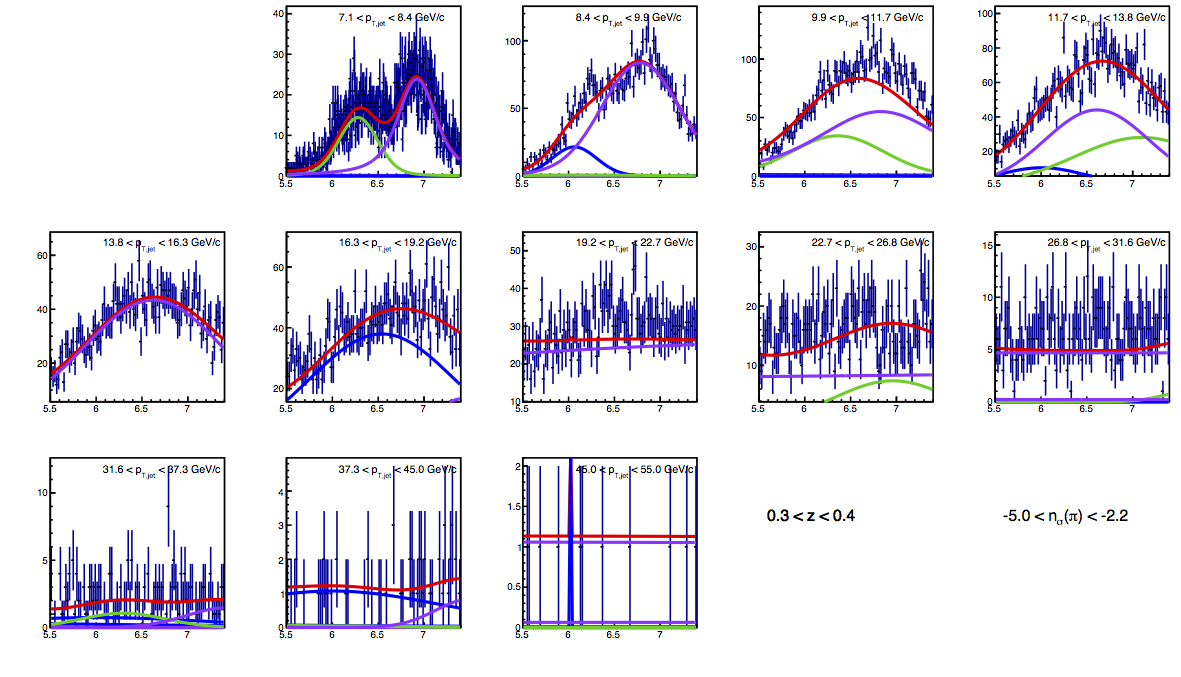 |
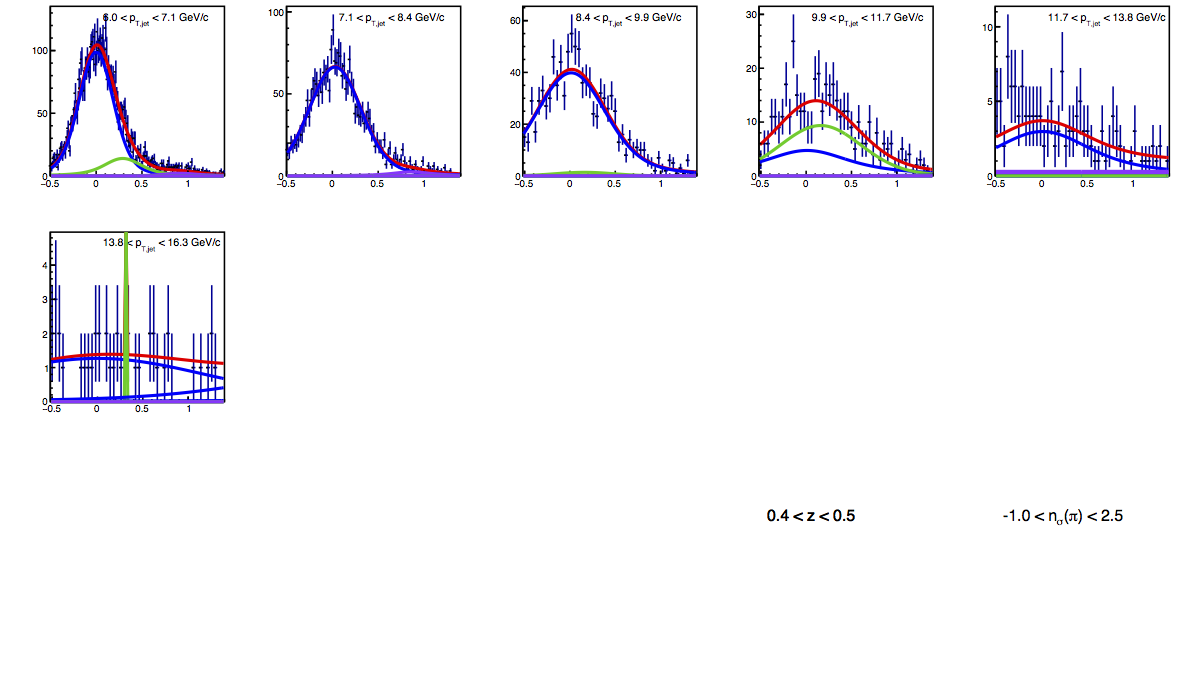
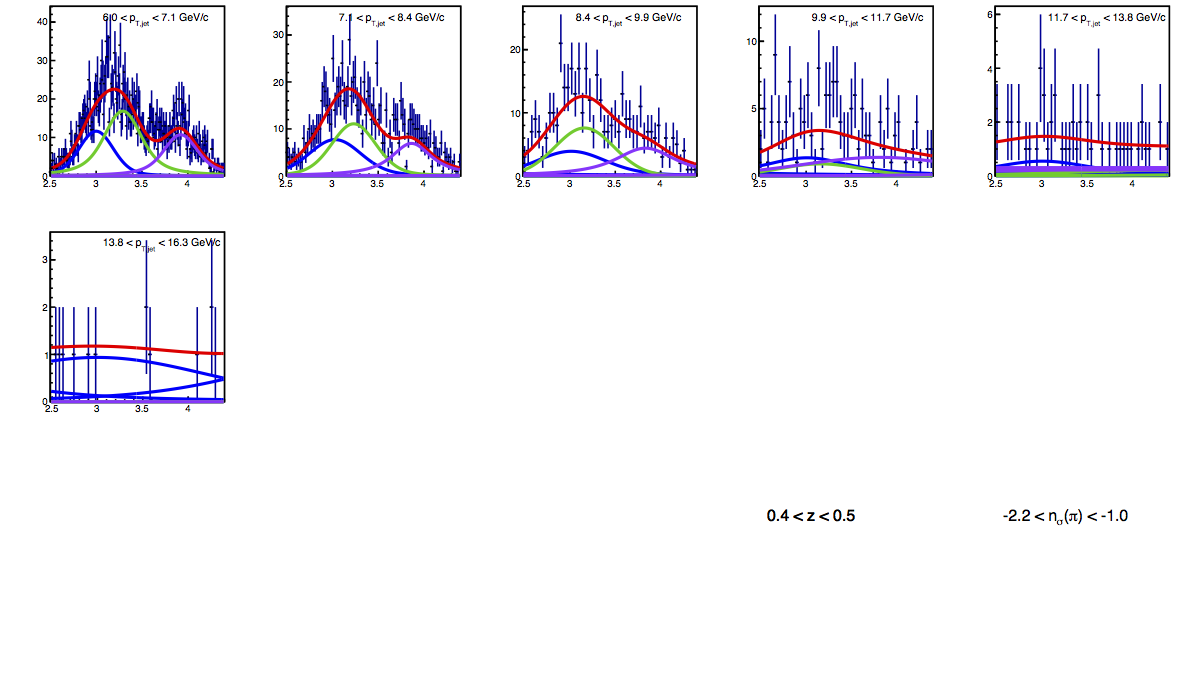
Figure 8: VPDMB Distributions for 0.4 < z < 0.5
| Positive Charge |
Negative Charge |
 |
 |
 |
 |
 |
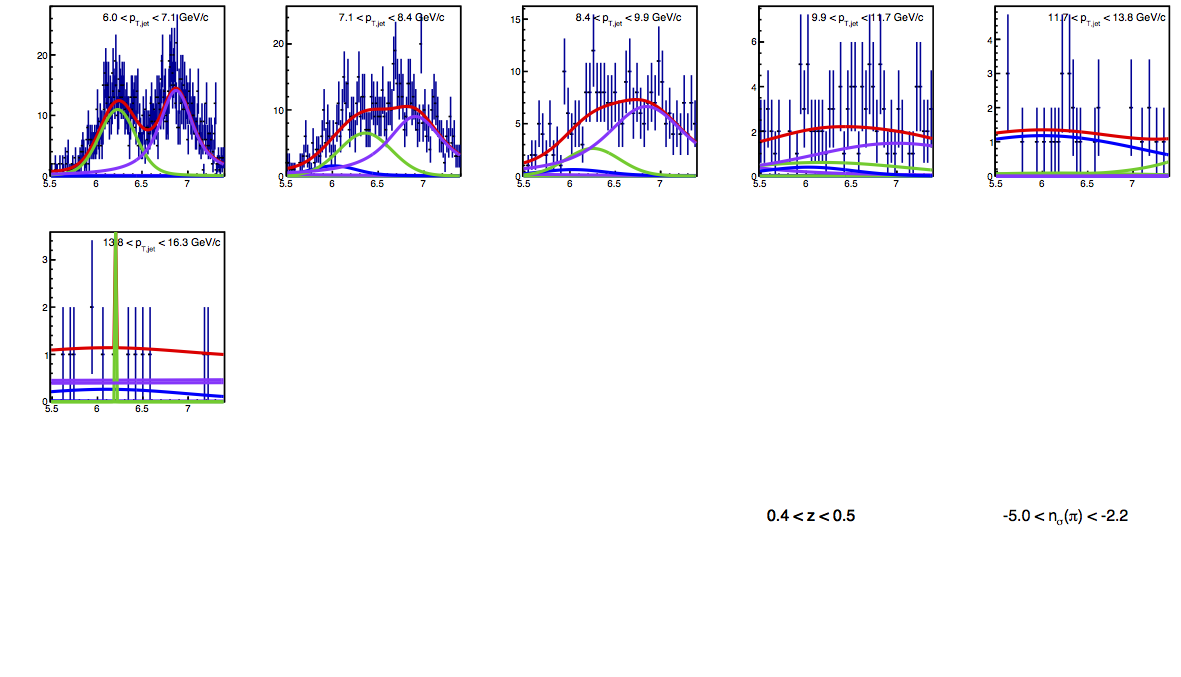 |
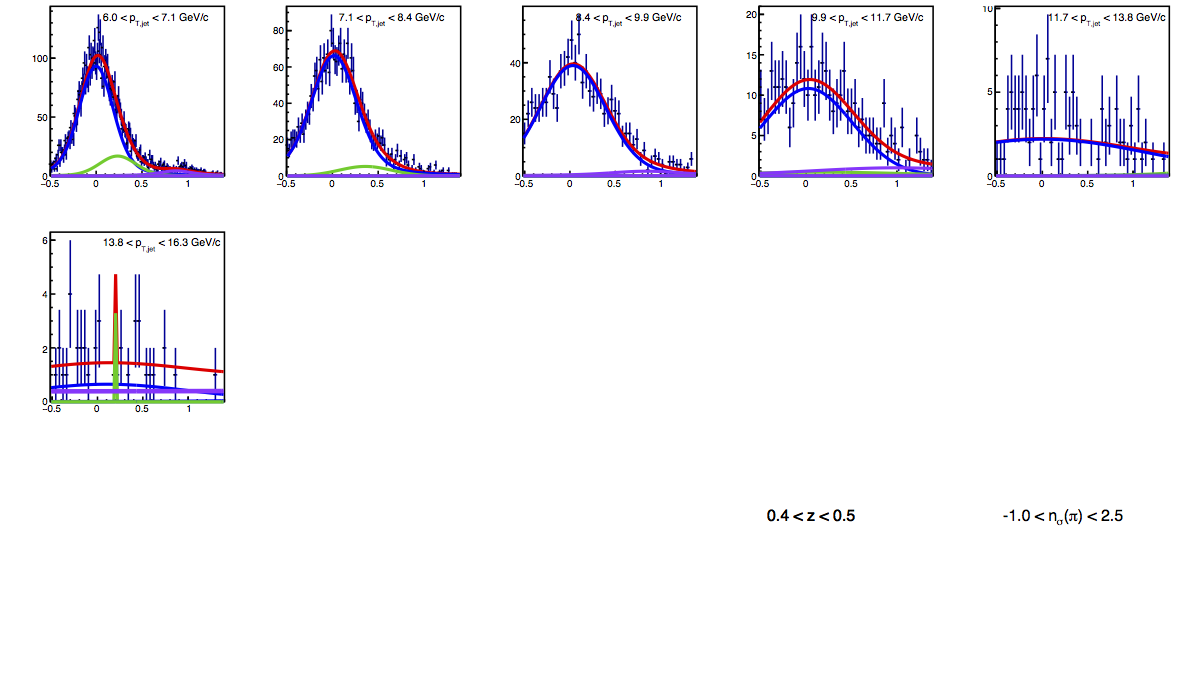
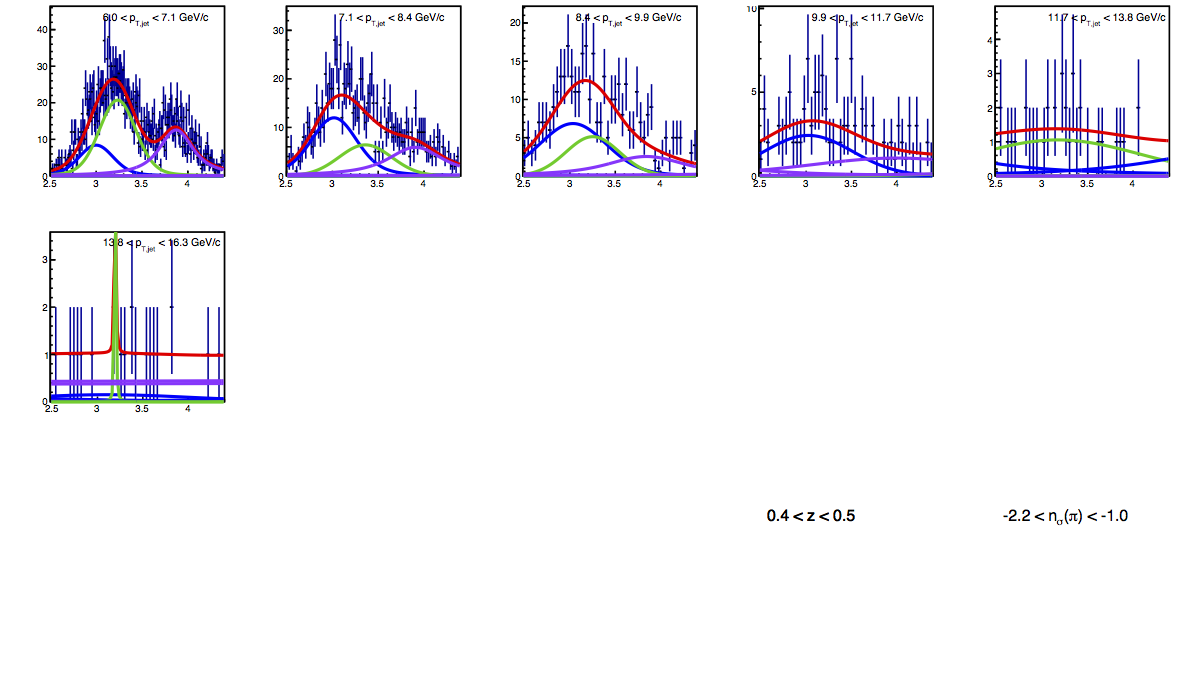
Figure 9: JP Distributions for 0.4 < z < 0.5
| Positive Charge |
Negative Charge |
 |
 |
 |
 |
 |
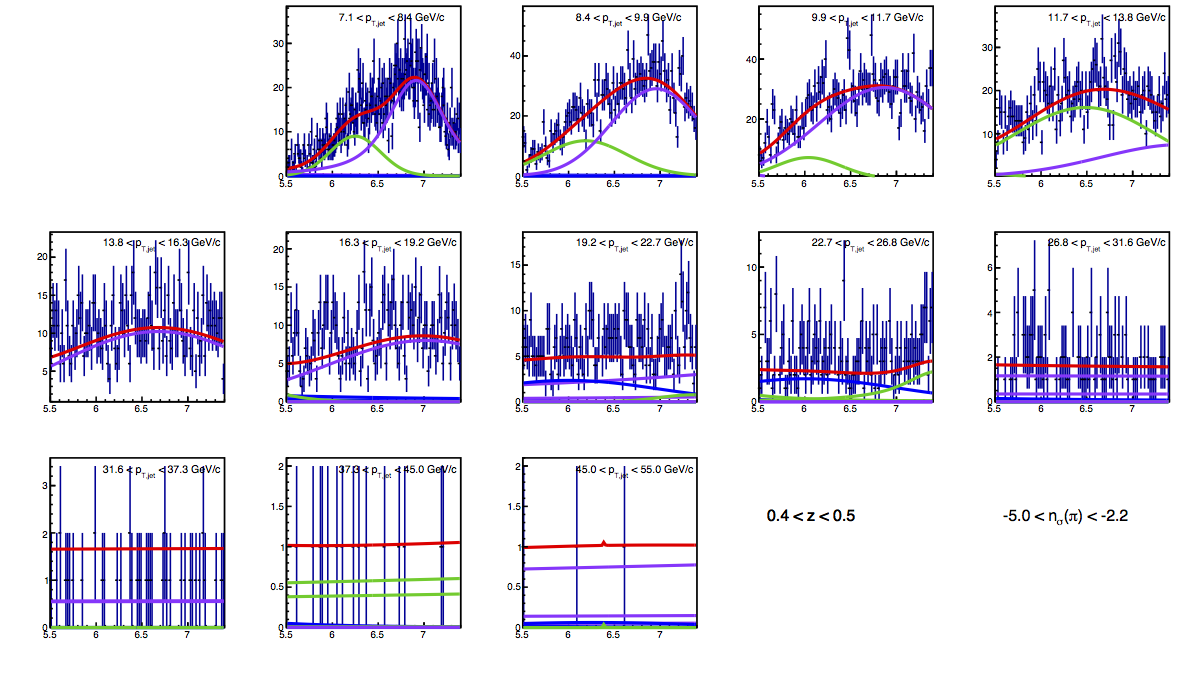 |
Figure 10: VPDMB Distributions for 0.5 < z < 0.8
| Positive Charge |
Negative Charge |
 |
 |
 |
 |
 |
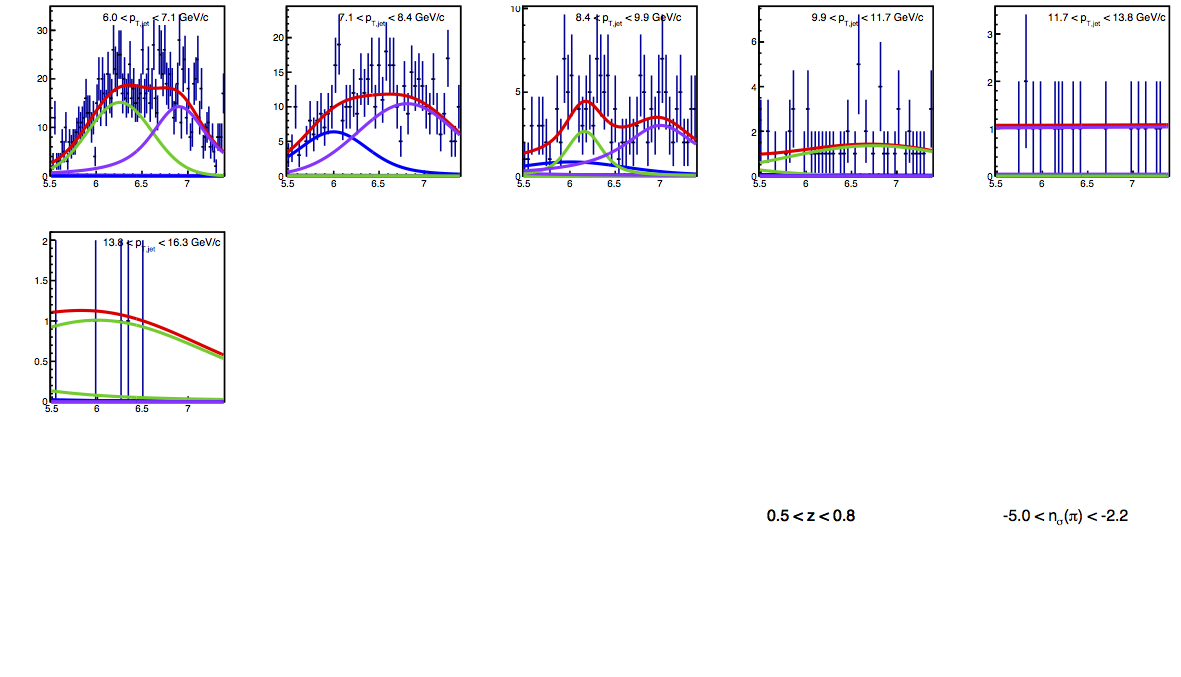 |
Figure 11: JP Distributions for 0.5 < z < 0.8
| Positive Charge |
Negative Charge |
 |
 |
 |
 |
 |
 |
Fit Parameter Results
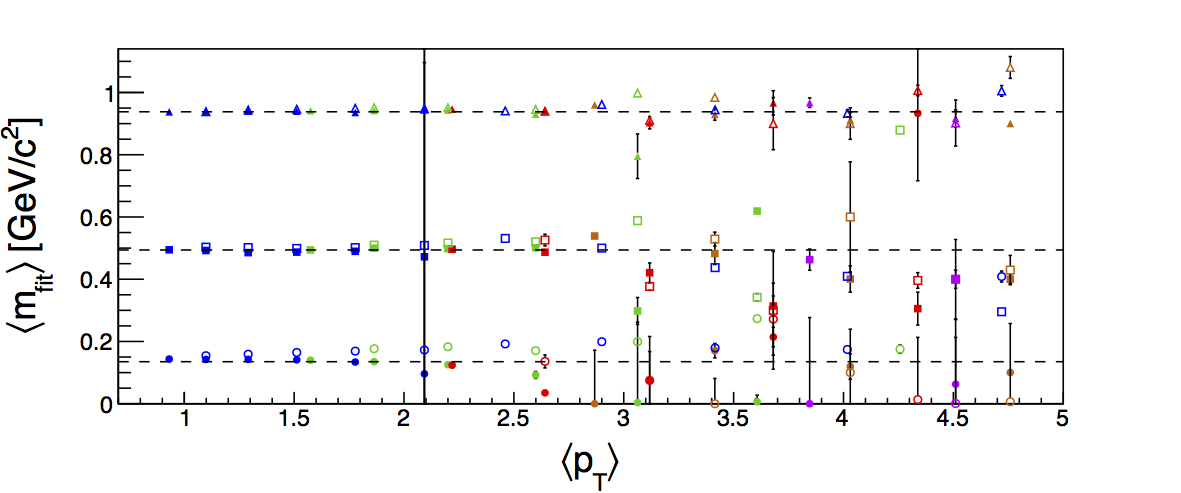
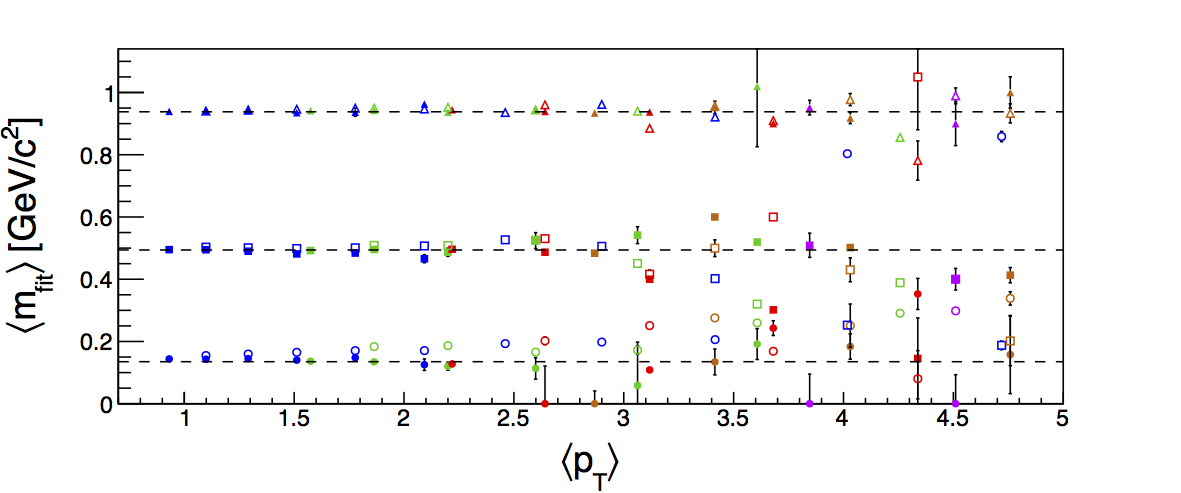
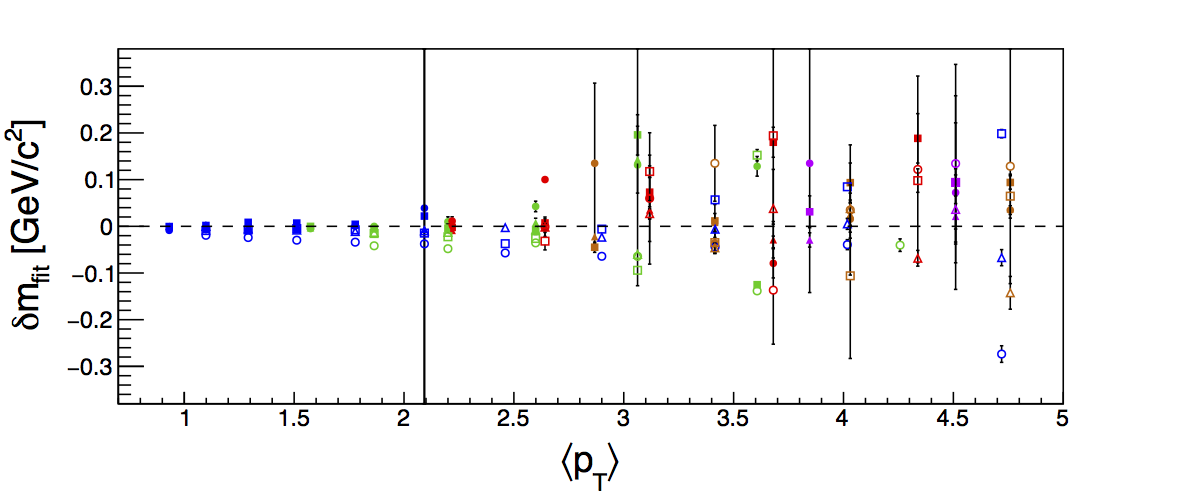
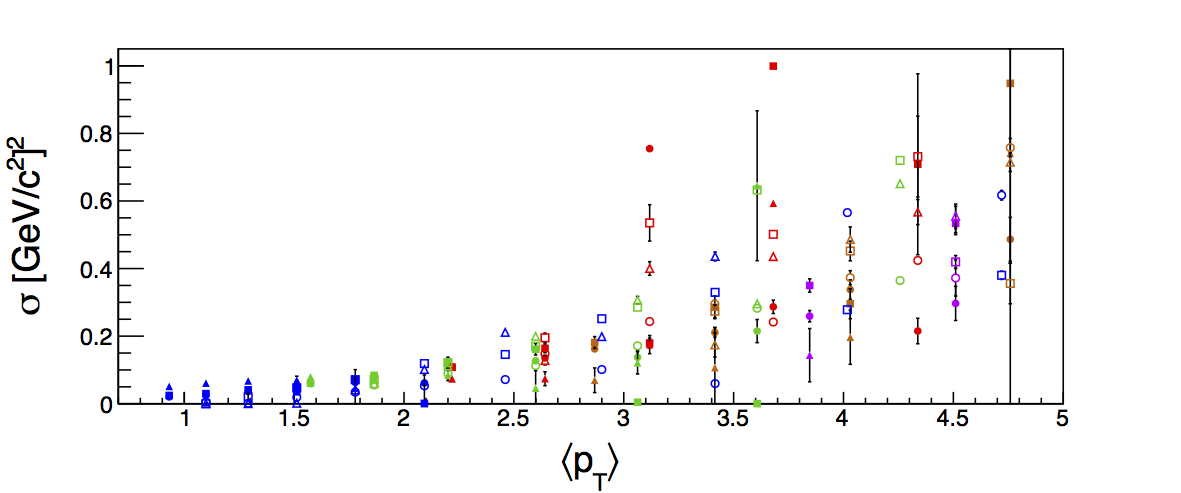
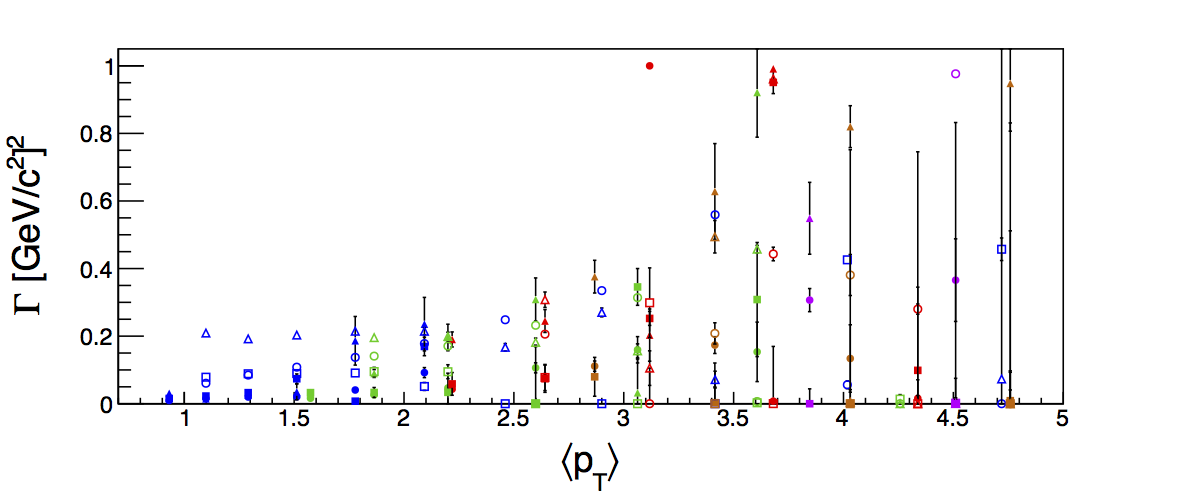
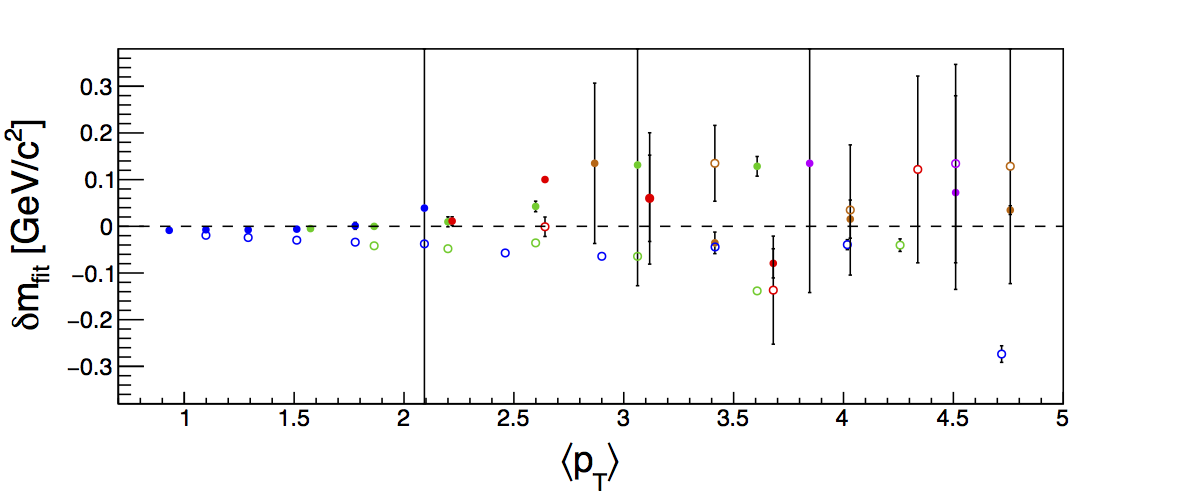
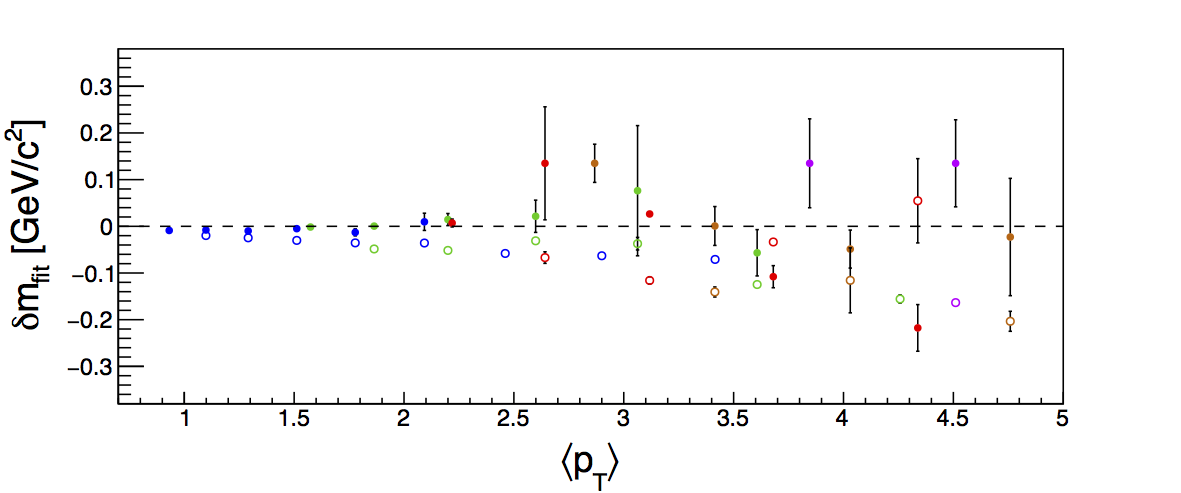
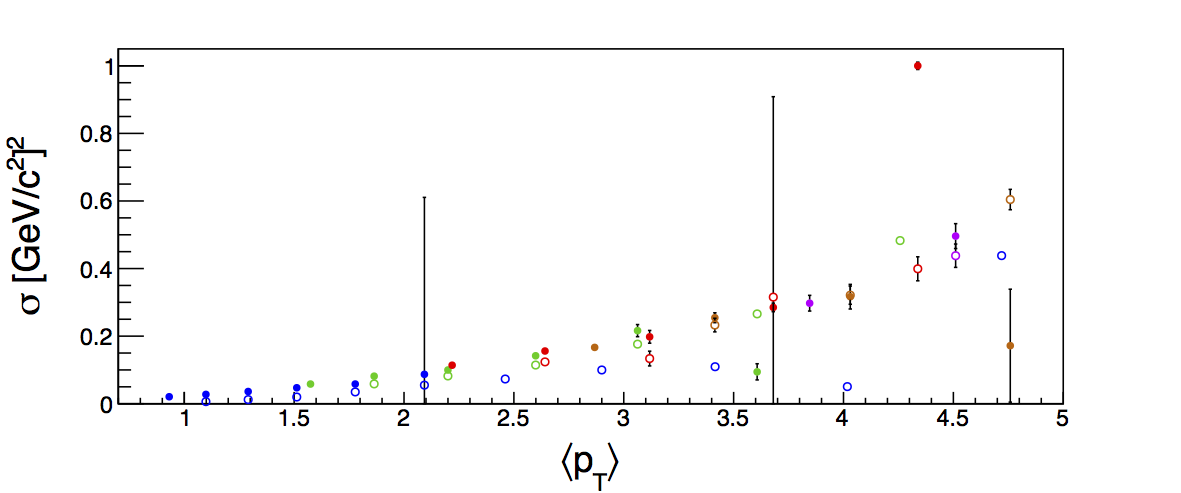
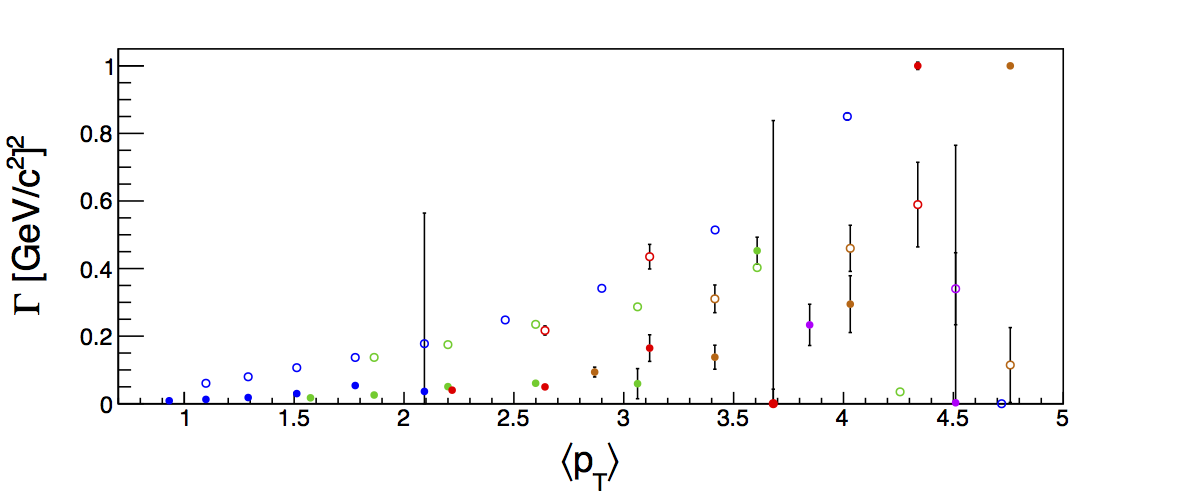
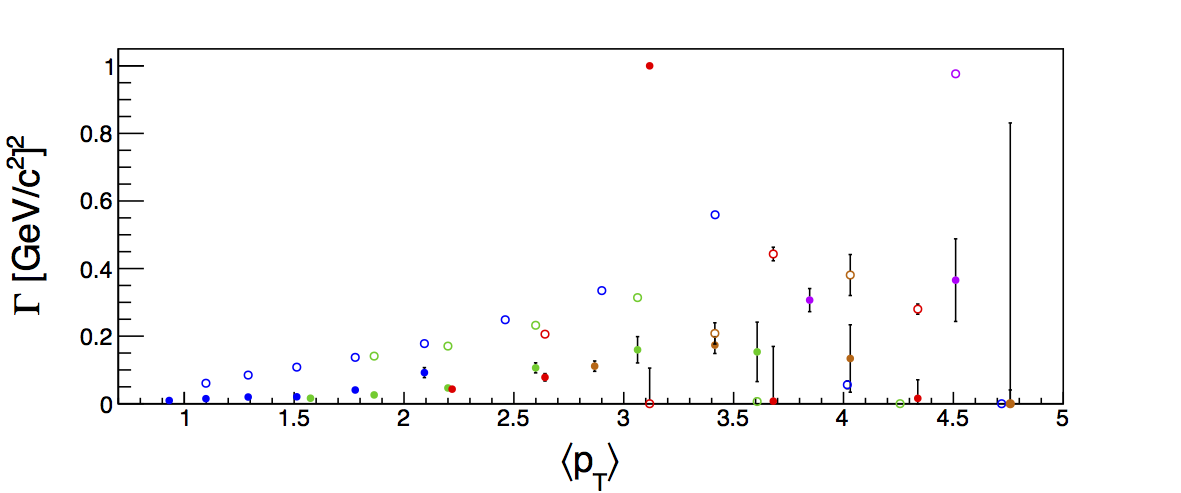
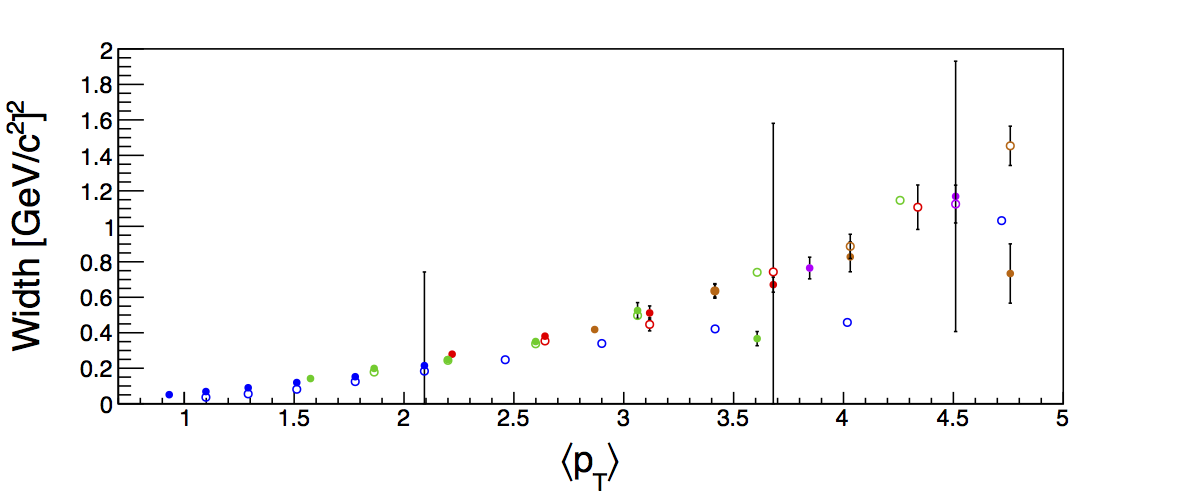
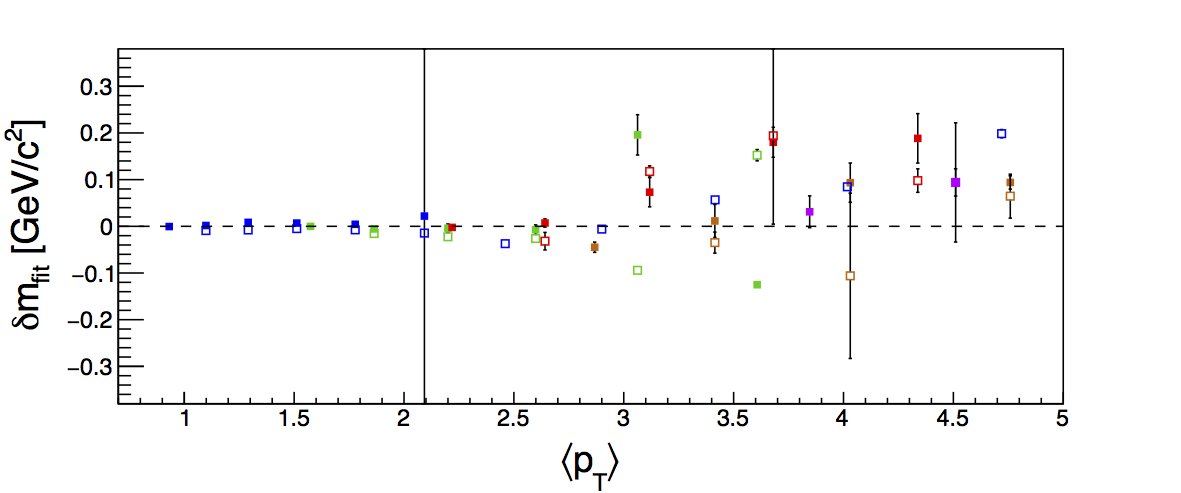
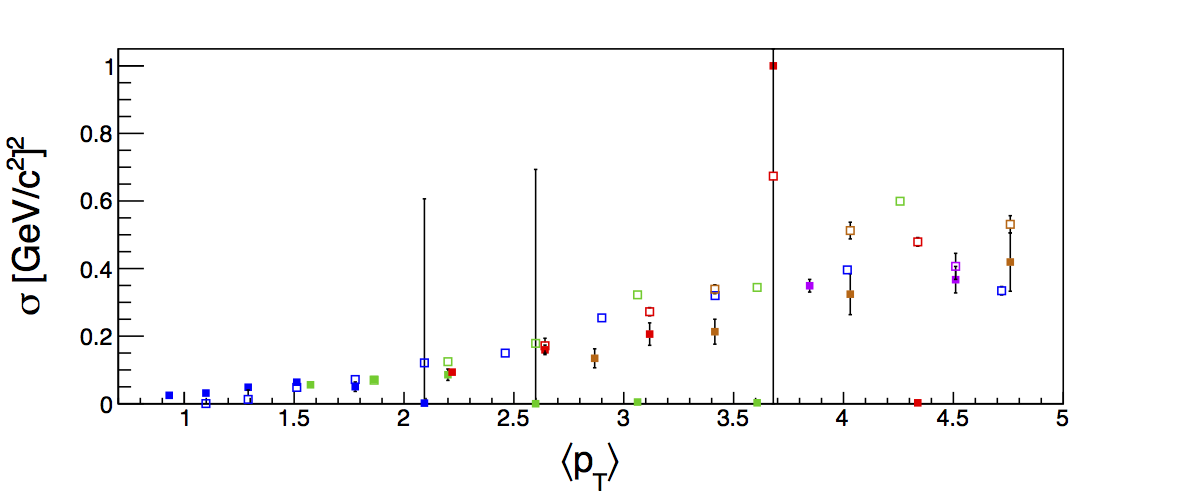
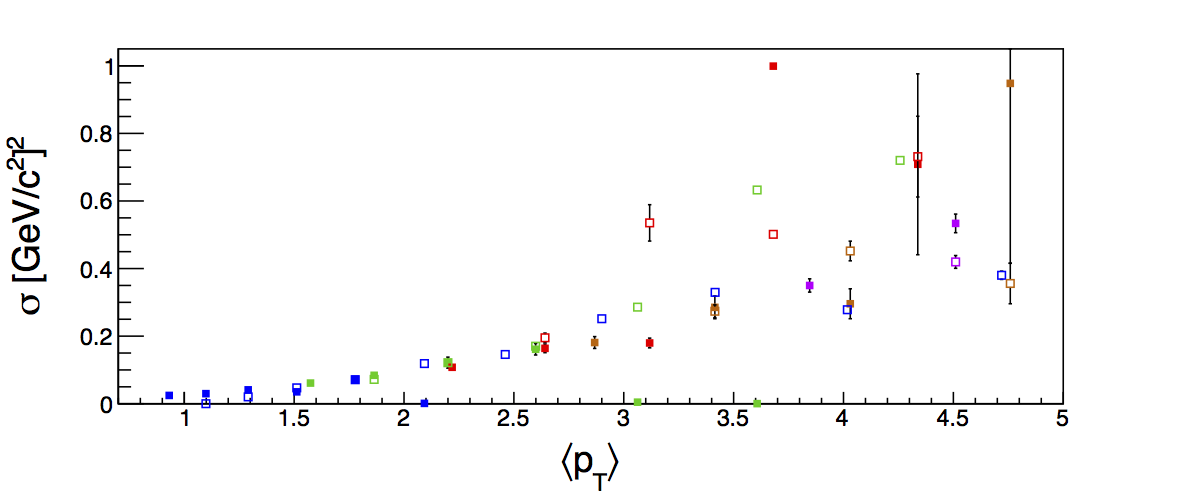
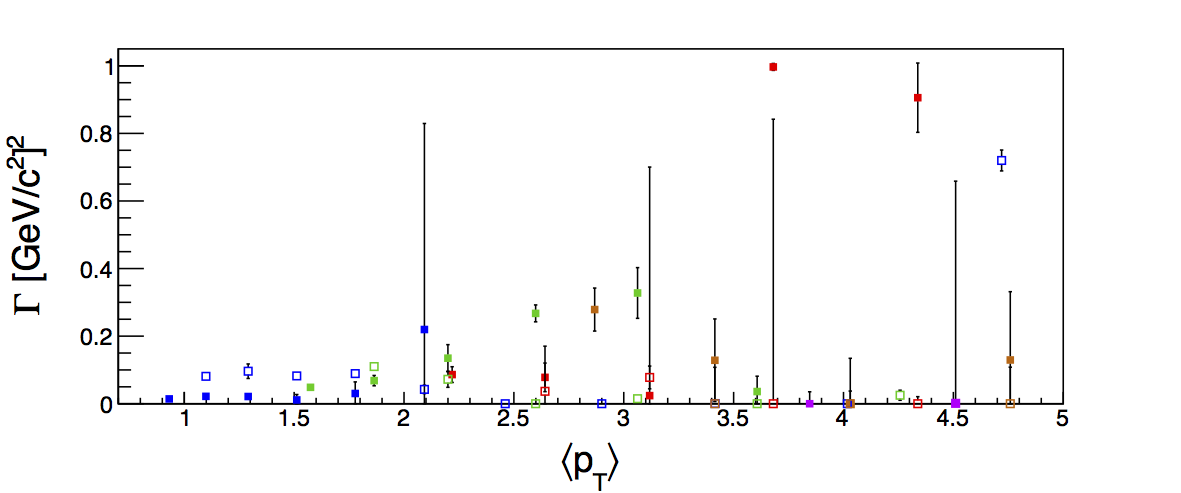
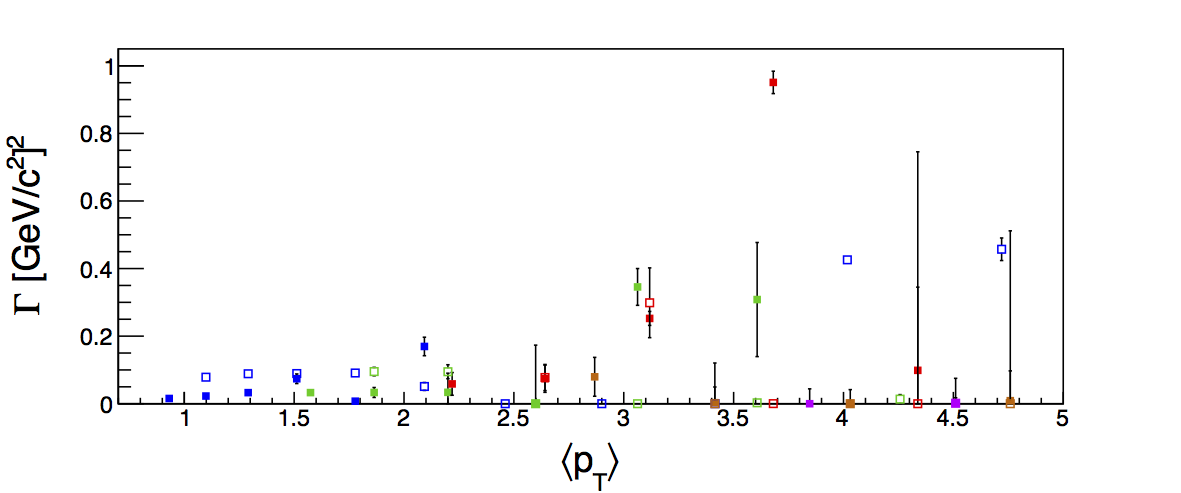
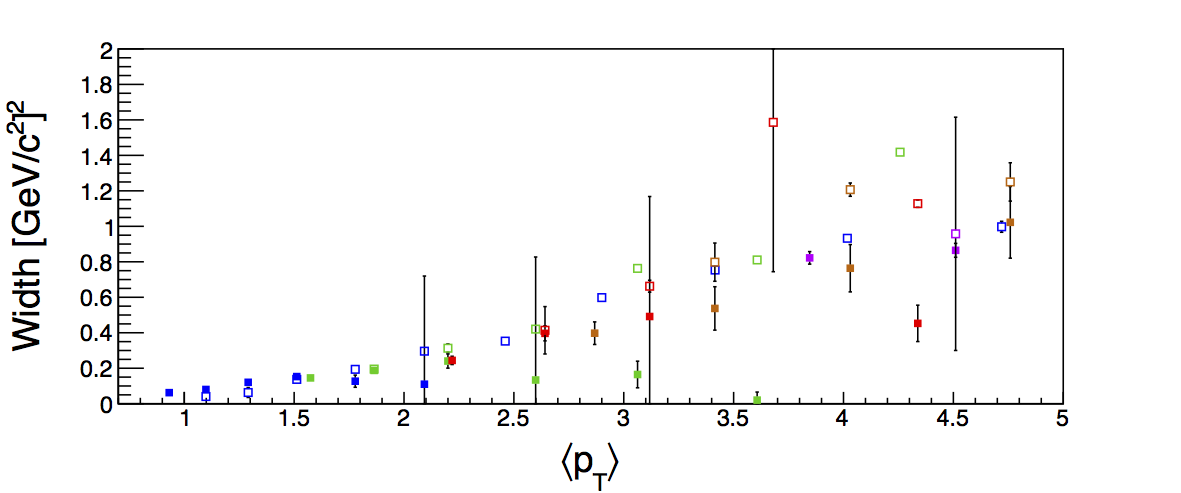
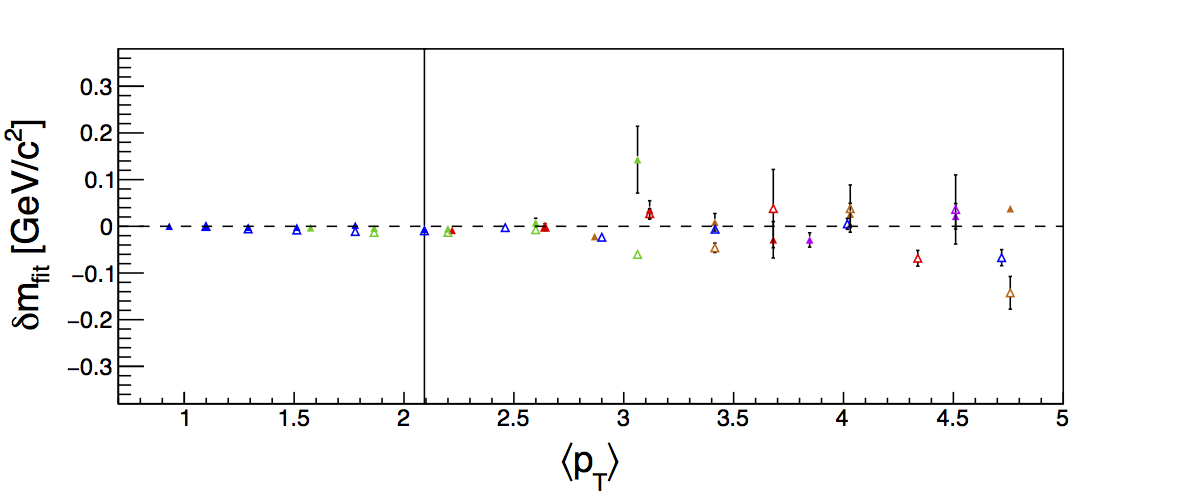
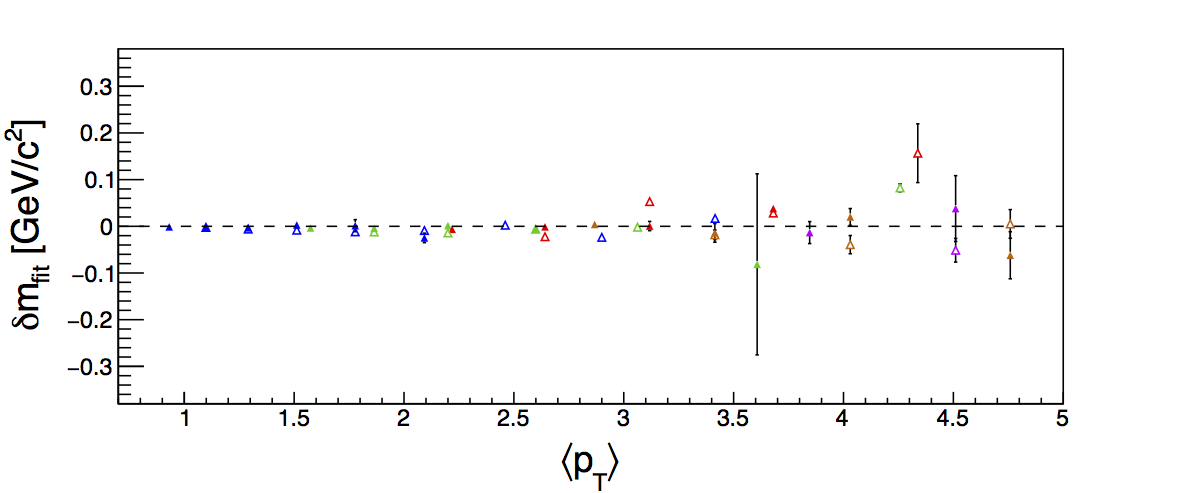
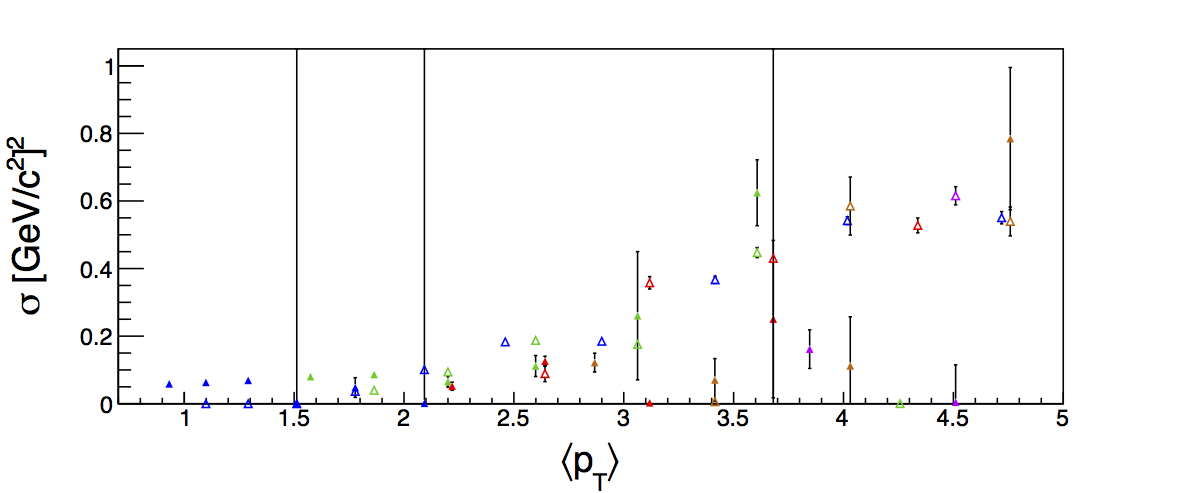
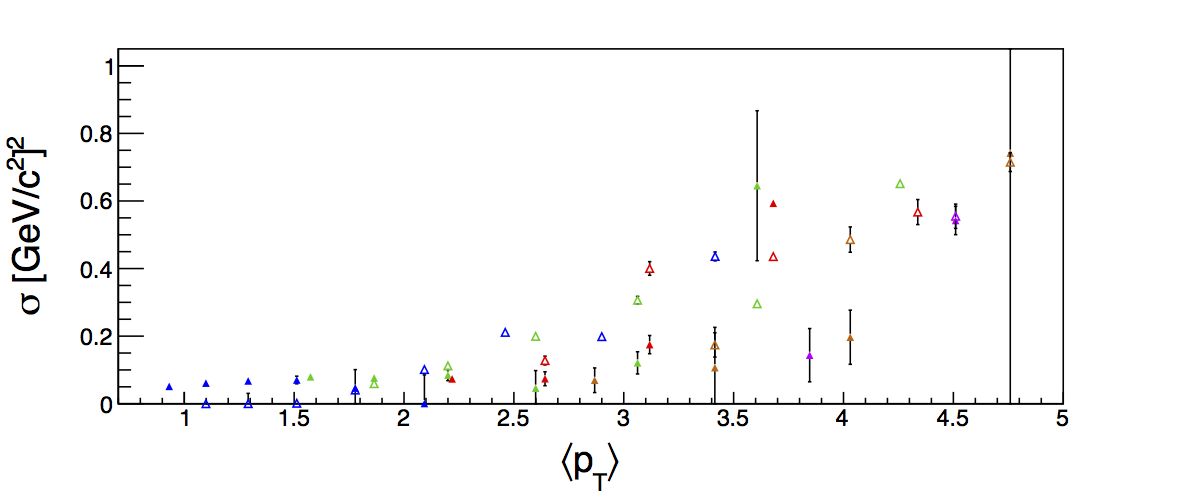
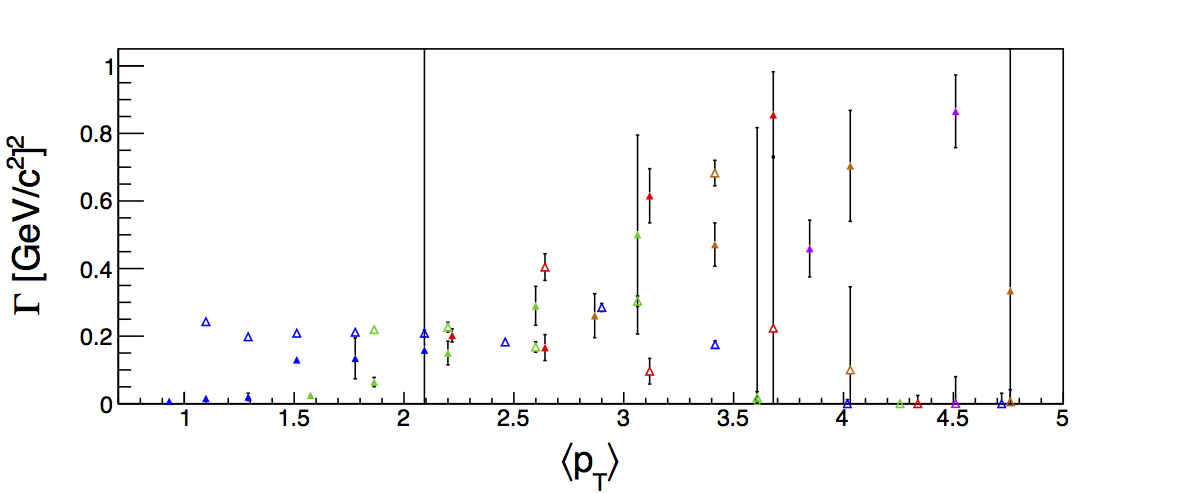
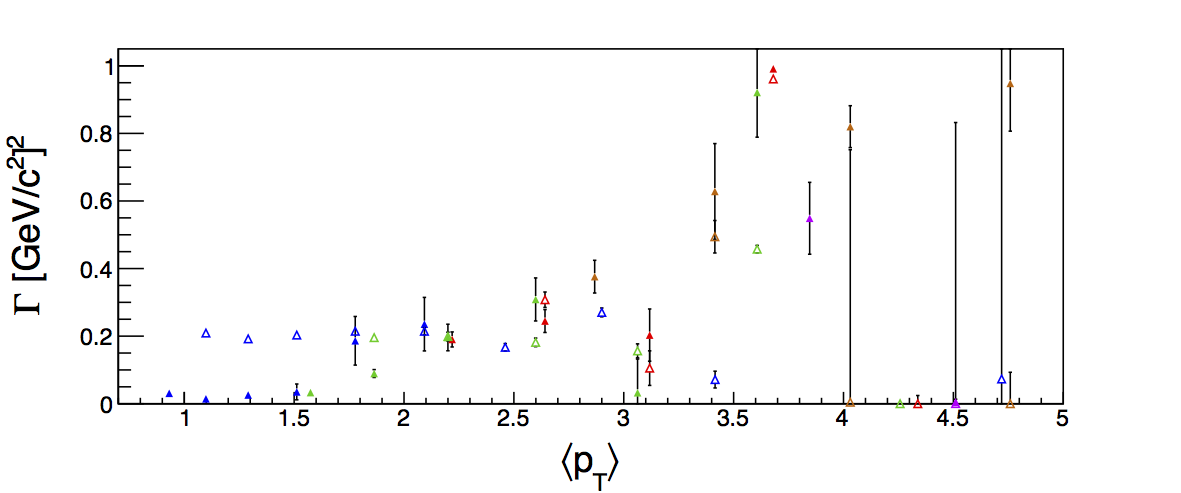
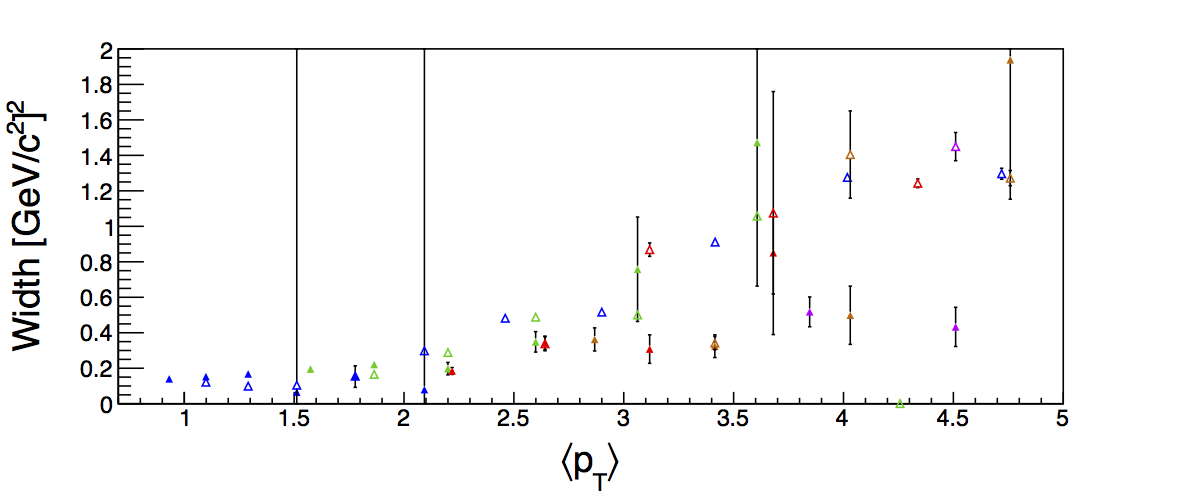
The following figures present the fit parameters vs. average particle pT. Pion parameters are shown with circles, kaon with squares, and protons with triangles. Closed markers are for VPDMB, while open markers are for JP triggered events. The different colors represented different z-bins. Shown are the fit centroids, the centroid deviations from expectation, Gaussian σs, Lorentzian Γs, and the approximate total widths. The widths are calculated combining the σs and Γs, which are correlated parameters. The proper uncertainty calculation is rather involved. For the sake of time, I approximate it by taking the larger of the uncertainties between σ and Γ.
Figure 12: Centroids and Deviations
| Positive Charge |
Negative Charge |
 |
 |
 |
 |
Figure 13: Sigmas, Gammas, and Total Widths
| Positive Charge |
Negative Charge |
 |
 |
 |
 |
 |
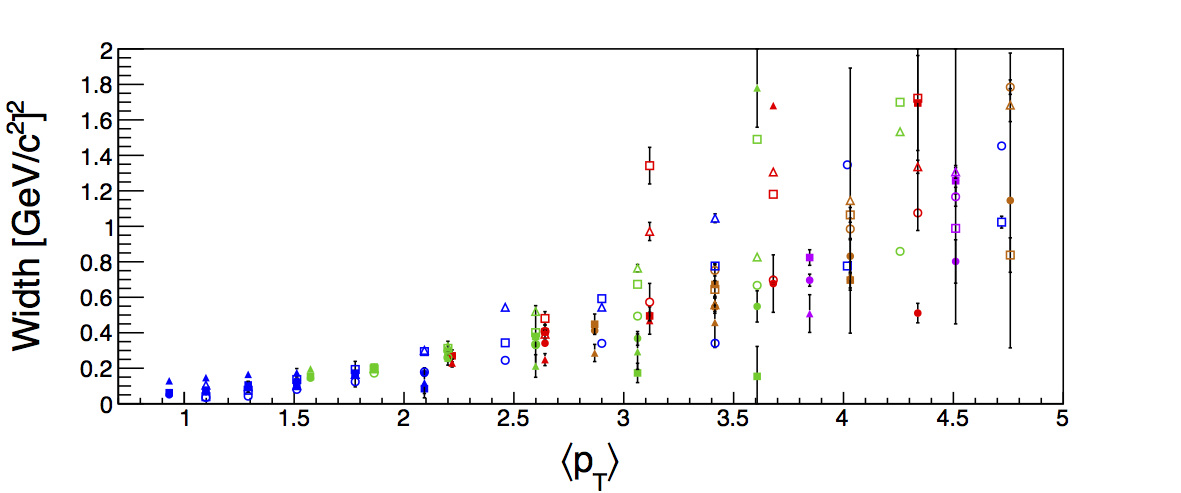 |
Figure 14: Pion Parameters
| Positive Charge |
Negative Charge |
 |
 |
 |
 |
 |
 |
 |
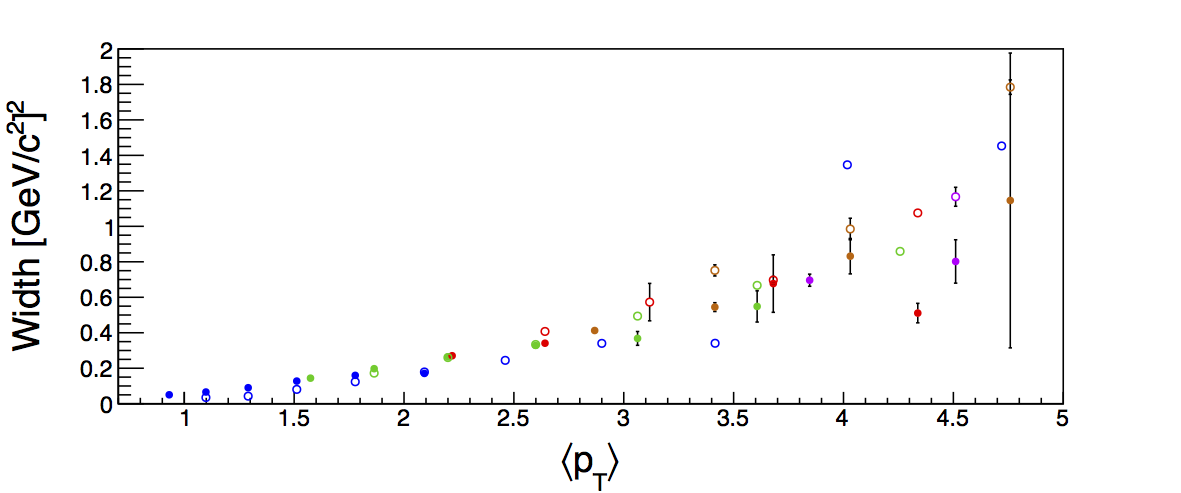 |
Figure 15: Kaon Parameters
| Positive Charge |
Negative Charge |
 |
 |
 |
 |
 |
 |
 |
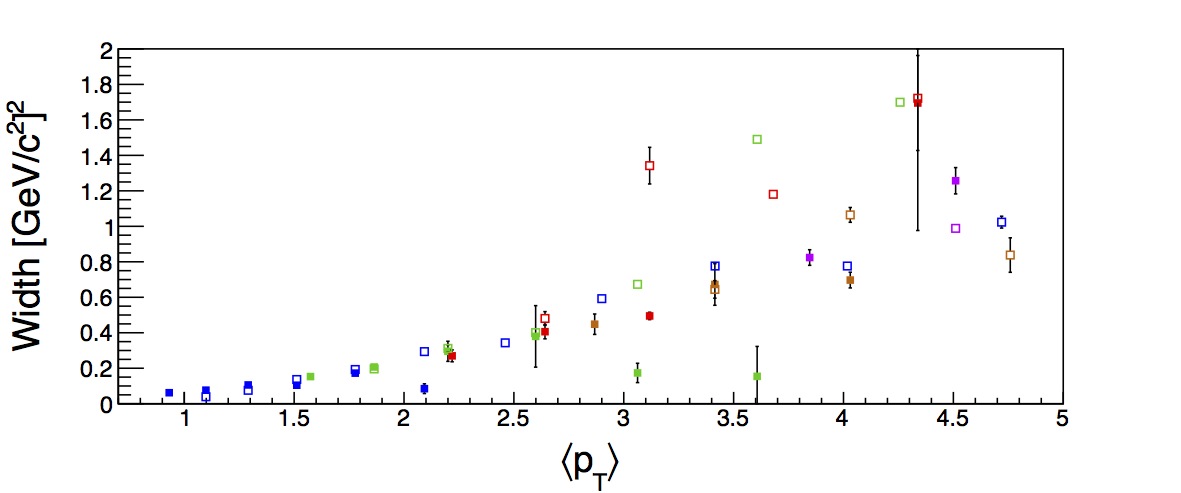 |
Figure 15: Proton Parameters
| Positive Charge |
Negative Charge |
 |
 |
 |
 |
 |
 |
 |
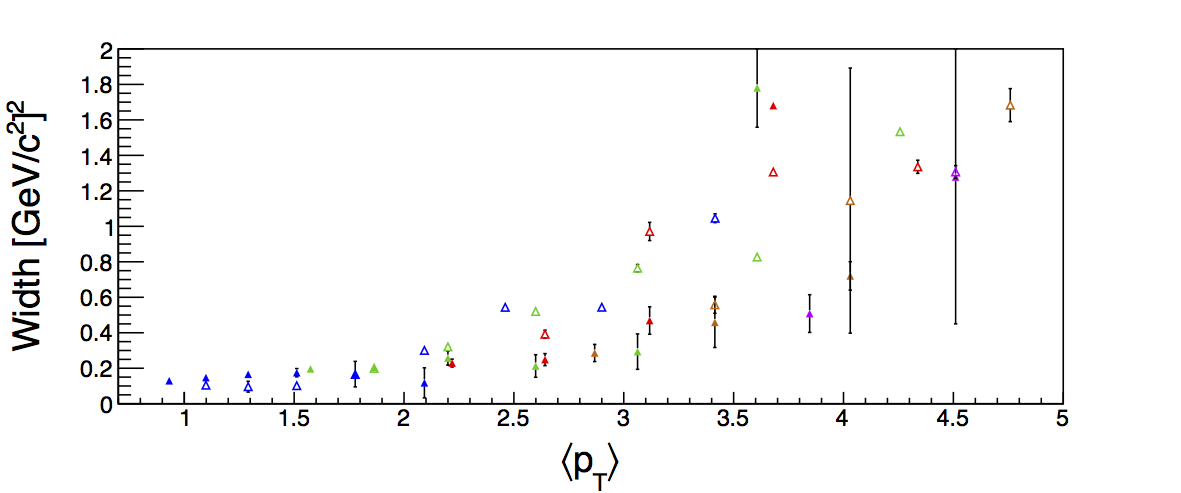 |
Table 1: Pion-rich π± Fractions (0.1 < z < 0.2)
| pT [GeV/c] |
dE/dx Fraction (π+) |
TOF Fraction (π+) |
dE/dx Fraction (π-) |
TOF Fraction (π-) |
| 6-7.1 |
0.270±0.012 |
0.8710±0.0071 |
0.195±0.012 |
0.8669±0.0069 |
| 7.1-8.4 |
0.762±0.012 |
0.8405±0.0061 |
0.8032±0.0084 |
0.8271±0.0061 |
| 8.4-9.9 |
0.741±0.016 |
0.8418±0.0032 |
0.669±0.017 |
0.8293±0.0031 |
| 9.9-11.7 |
0.375±0.013 |
0.8574±0.0070 |
0.412±0.013 |
0.8490±0.0048 |
| 11.7-13.8 |
0.94085±0.00054 |
0.8735±0.0043 |
0.94042±0.00044 |
0.8727±0.0042 |
| 13.8-16.3 |
0.94146±0.00045 |
0.8921±0.0059 |
0.94017±0.00045 |
0.8920±0.0071 |
| 16.3-19.2 |
0.94033±0.00027 |
0.9055±0.0050 |
0.93756±0.00027 |
0.9087±0.0053 |
| 19.2-22.7 |
0.9562±0.0013 |
0.8702±0.0079 |
0.95693±0.00066 |
0.8689±0.0082 |
| 22.7-26.8 |
0.96347±0.00085 |
0.77256±0.00061 |
0.96402±0.00076 |
0.76370±0.00053 |
| 26.8-31.6 |
0.96218±0.00081 |
0.71310±0.00051 |
0.96377±0.00074 |
0.10421±0.00047 |
| 31.6-37.3 |
0.9602±0.0010 |
0.00000±0.00056 |
0.96027±0.00086 |
0.0272±0.0017 |
| 37.3-45 |
0.9514±0.0016 |
0.64235±0.00063 |
0.9564±0.0015 |
0.14001±0.00075 |
| 45-55 |
0.9499±0.0018 |
0.0000±0.0015 |
0.9555±0.0016 |
0.0011±0.0012 |
Table 2: Pion-rich π± Fractions (0.2 < z < 0.3)
| pT [GeV/c] |
dE/dx Fraction (π+) |
TOF Fraction (π+) |
dE/dx Fraction (π-) |
TOF Fraction (π-) |
| 6-7.1 |
0.727±0.010 |
0.756±0.015 |
0.7397±0.0080 |
0.736±0.012 |
| 7.1-8.4 |
0.8971±0.0085 |
0.8218±0.0087 |
0.8990±0.0063 |
0.7892±0.0072 |
| 8.4-9.9 |
0.9173±0.0036 |
0.867±0.025 |
0.8982±0.0042 |
0.856±0.013 |
| 9.9-11.7 |
0.9363±0.0027 |
0.876±0.013 |
0.9307±0.0028 |
0.871±0.025 |
| 11.7-13.8 |
0.9483±0.0020 |
0.88543±0.00092 |
0.9467±0.0020 |
0.828±0.029 |
| 13.8-16.3 |
0.9558±0.0016 |
0.9195±0.0071 |
0.9524±0.0017 |
0.48273±0.00093 |
| 16.3-19.2 |
0.9485±0.0011 |
0.63541±0.00033 |
0.9436±0.0010 |
0.32700±0.00035 |
| 19.2-22.7 |
0.9432±0.0011 |
0.27973±0.00036 |
0.9431±0.0010 |
0.21944±0.00034 |
| 22.7-26.8 |
0.9447±0.0011 |
0.00157±0.00055 |
0.9438±0.0011 |
0.99000±0.00037 |
| 26.8-31.6 |
0.93853±0.00089 |
0.28955±0.00063 |
0.94486±0.00091 |
0.81641±0.00093 |
| 31.6-37.3 |
0.9319±0.0015 |
0.10863±0.00090 |
0.9401±0.0016 |
0.0001±0.0012 |
| 37.3-45 |
0.9320±0.0035 |
0.1720±0.0035 |
0.9211±0.0033 |
0.0037±0.0020 |
| 45-55 |
0.901±0.011 |
0.3471±0.0046 |
0.933±0.020 |
0.045±0.026 |