- genevb's home page
- Posts
- 2025
- 2024
- 2023
- 2022
- September (1)
- 2021
- 2020
- 2019
- December (1)
- October (4)
- September (2)
- August (6)
- July (1)
- June (2)
- May (4)
- April (2)
- March (3)
- February (3)
- 2018
- 2017
- December (1)
- October (3)
- September (1)
- August (1)
- July (2)
- June (2)
- April (2)
- March (2)
- February (1)
- 2016
- November (2)
- September (1)
- August (2)
- July (1)
- June (2)
- May (2)
- April (1)
- March (5)
- February (2)
- January (1)
- 2015
- December (1)
- October (1)
- September (2)
- June (1)
- May (2)
- April (2)
- March (3)
- February (1)
- January (3)
- 2014
- December (2)
- October (2)
- September (2)
- August (3)
- July (2)
- June (2)
- May (2)
- April (9)
- March (2)
- February (2)
- January (1)
- 2013
- December (5)
- October (3)
- September (3)
- August (1)
- July (1)
- May (4)
- April (4)
- March (7)
- February (1)
- January (2)
- 2012
- December (2)
- November (6)
- October (2)
- September (3)
- August (7)
- July (2)
- June (1)
- May (3)
- April (1)
- March (2)
- February (1)
- 2011
- November (1)
- October (1)
- September (4)
- August (2)
- July (4)
- June (3)
- May (4)
- April (9)
- March (5)
- February (6)
- January (3)
- 2010
- December (3)
- November (6)
- October (3)
- September (1)
- August (5)
- July (1)
- June (4)
- May (1)
- April (2)
- March (2)
- February (4)
- January (2)
- 2009
- November (1)
- October (2)
- September (6)
- August (4)
- July (4)
- June (3)
- May (5)
- April (5)
- March (3)
- February (1)
- 2008
- 2005
- October (1)
- My blog
- Post new blog entry
- All blogs
First look at TPC slewing
Calibrating padrow-by-padrow T0s showed evidence of dependence of T0s on anode HV: the padrows under anode section 7-6 (padrows 22-29) showed a shift of 15-20 ns for a reduction in voltage from 1390 V down to 1345 V, and a shift of about 50 ns for a reduction down to 1200 V. This makes sense if there is slewing.
A simple check of slewing can be made by looking at residuals in time (drift direction) of hits based on their charge. I imagine this is not the best method for doing this study because hits along tracks have charge correlated by the track's dE/dx. This correlation could shift all hits similarly, and thus reduce the sensitivity of the residuals. A better place to look may be using groups of padrows where anode HV was changed, keeping neighboring padrows under a constant voltage. But doing so is a much bigger task of data organization and processing.
So, to do the simple check, I added TPC hit charge to the StiPulls ntuple and simply plotted time residuals versus charge. Here they are on a log z scale for outer sector padrows in run 10184053 (during the pp2pp running), where the left (first) plot is linear in charge, and the right (second) plot is log10 in charge:

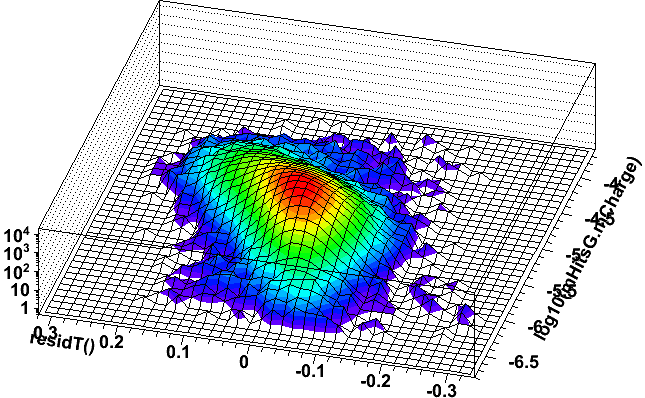
Note that the residuals are in microseconds, so 0.2 is 200 ns, which corresponds to over 1 cm in space. I find it rather impressive that tracking still attaches these hits to the tracks (note that this data is from a very low luminosity run, so occupancy is low and the tracker is not likely to be confused about which tracks and hits go together). At some deviation, the tracker must fail to attach such hits to the tracks, so the residuals will saturate. But there is no clear evidence of this saturation in the above plots, and it probably depends on the drift distance and crossing and dip angles of the track, which are used in determination of the hit errors. I have not investigated these details.
Here is the same data as a profile of time residuals vs. charge, showing outer (left, first) and inner (right, second) sector padrows:
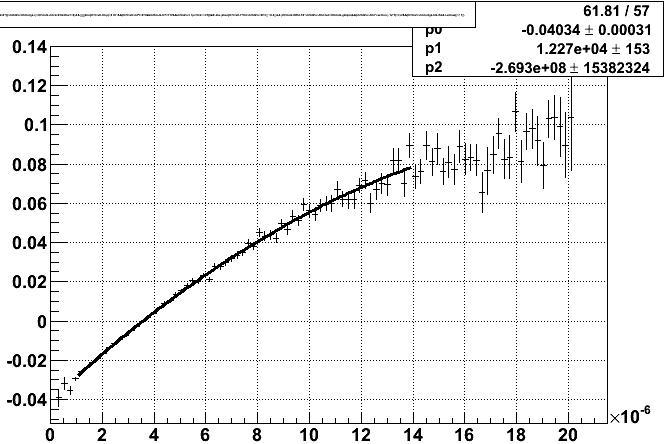
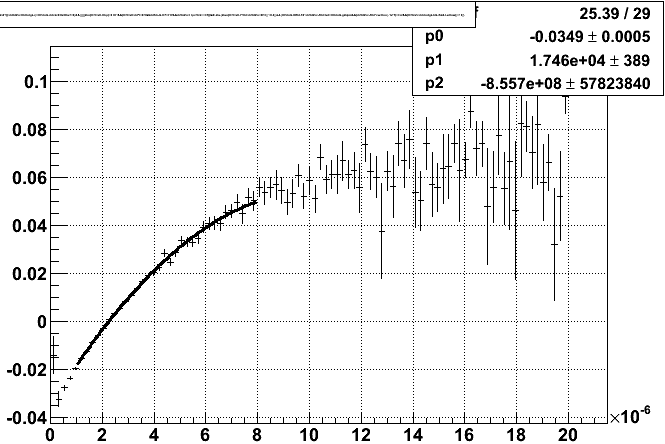
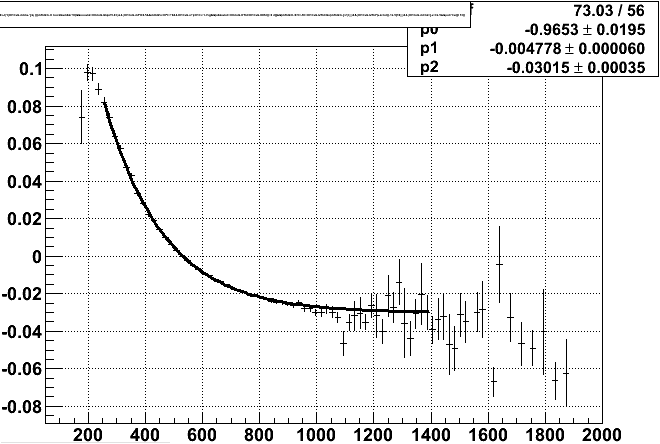
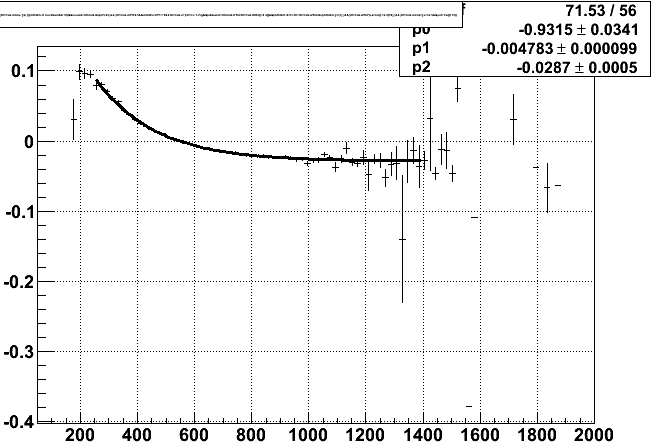
These show beautiful curves which fits almost perfectly with a quadratic in charge. However, a quadratic with a negative second order term will eventually turn over at large charge. We know the if slewing is the culprit, then the time shift should go from one fixed number at ~0 charge to another fixed number at infinite charge Q (asymptotically approaching it), usually with some dependence on the square root of the charge. After playing with a few functional forms, I found that f = exp(p0 + p1/sqrt(Q)) + p2 works well: it goes to [exp(p0) + p2] at infinite Q, and [p2] at small Q because p1 is negative. Here is the fit result for the outer sector padrows, where the plot is mean time residual vs. 1/sqrt(Q):
To establish some confidence, I looked also at data from the low luminosity fill, run 10118050. The results are strikingly similar (look at the fit parameters):
In these two datasets, the anode section 7-6 was reduced to 1345 V in 10118050 and 1200 V in 10184053 respectively. Since I have applied no padrow T0 corrections, my hope is that the reduced voltage is seen as keeping the data along the same curve, with lower charge. The results are a bit confusing. Here are the same plots as just shown, but with the padrows under section 7-6 profiled in red for run 10118050 first, and 10184053 second:
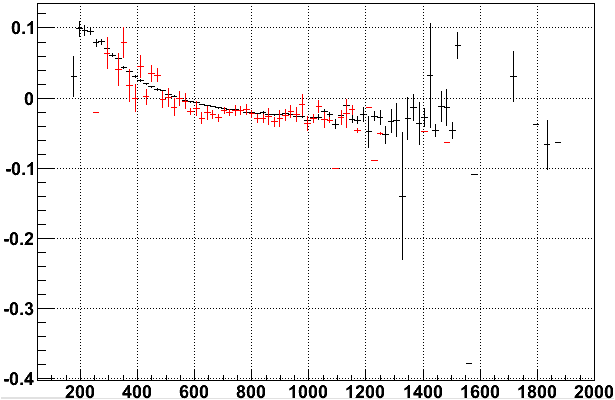
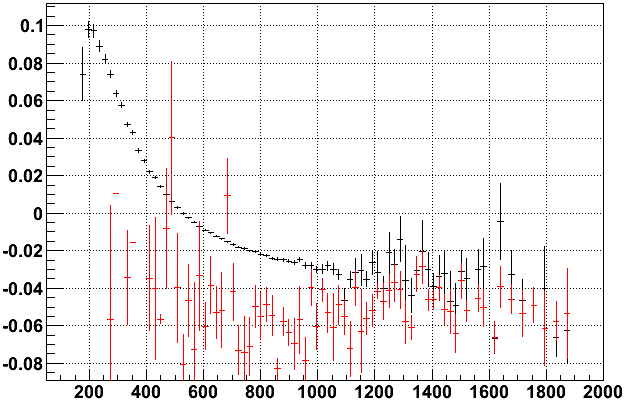
Trying to keep in mind the scales in the above two plots, the slightly reduced voltage run does appear to keep these padrows on the same curve, while the heavily reduced voltage run seems to be nearly flat for these padrows. I'm not quite sure what this means, but may relate to the point I made earlier that the residuals really may not be as sensitive as they need to be unless the anode voltages are changed (i.e. I am seeing a diluted version of the slewing from the rest of the residuals).
All of this is in contrast to data from the Run 8 low luminosity fill, run 8348091, which looks impressively flat in outer sector mean time residuals vs. charge (the second plot is a zoom in of the first):
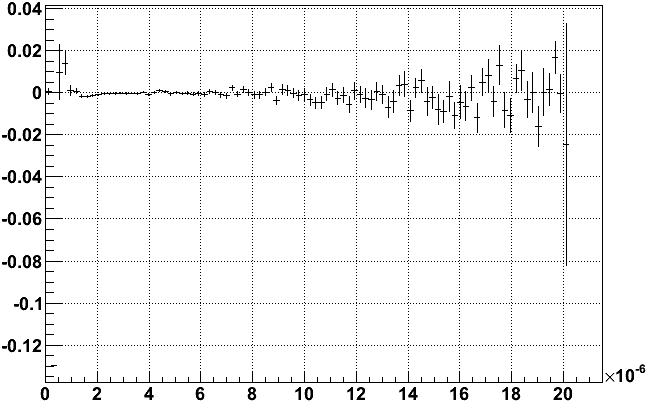
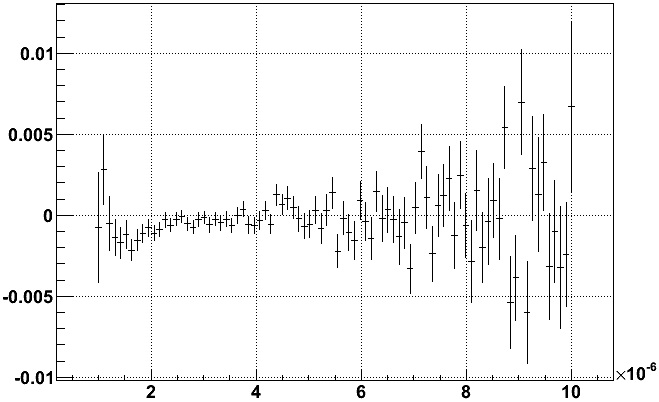
Whatever shape exists in this Run 8 data is at the level of a few ns at most (1 ns corresponds to ~55 microns) and is not worth any concern for longitudinal reconstruction. Anyhow, this points the finger at the Run 9 pulse shape out of the TPX electronics vs. that from Run 8 (in concert with the cluster finder's determination of the cluster time from the pulse shape).
-Gene
Groups:
- genevb's blog
- Login or register to post comments