- genevb's home page
- Posts
- 2025
- 2024
- 2023
- 2022
- September (1)
- 2021
- 2020
- 2019
- December (1)
- October (4)
- September (2)
- August (6)
- July (1)
- June (2)
- May (4)
- April (2)
- March (3)
- February (3)
- 2018
- 2017
- December (1)
- October (3)
- September (1)
- August (1)
- July (2)
- June (2)
- April (2)
- March (2)
- February (1)
- 2016
- November (2)
- September (1)
- August (2)
- July (1)
- June (2)
- May (2)
- April (1)
- March (5)
- February (2)
- January (1)
- 2015
- December (1)
- October (1)
- September (2)
- June (1)
- May (2)
- April (2)
- March (3)
- February (1)
- January (3)
- 2014
- December (2)
- October (2)
- September (2)
- August (3)
- July (2)
- June (2)
- May (2)
- April (9)
- March (2)
- February (2)
- January (1)
- 2013
- December (5)
- October (3)
- September (3)
- August (1)
- July (1)
- May (4)
- April (4)
- March (7)
- February (1)
- January (2)
- 2012
- December (2)
- November (6)
- October (2)
- September (3)
- August (7)
- July (2)
- June (1)
- May (3)
- April (1)
- March (2)
- February (1)
- 2011
- November (1)
- October (1)
- September (4)
- August (2)
- July (4)
- June (3)
- May (4)
- April (9)
- March (5)
- February (6)
- January (3)
- 2010
- December (3)
- November (6)
- October (3)
- September (1)
- August (5)
- July (1)
- June (4)
- May (1)
- April (2)
- March (2)
- February (4)
- January (2)
- 2009
- November (1)
- October (2)
- September (6)
- August (4)
- July (4)
- June (3)
- May (5)
- April (5)
- March (3)
- February (1)
- 2008
- 2005
- October (1)
- My blog
- Post new blog entry
- All blogs
Initial look at cosmic ray resolutions
This is the result of work I am doing with Amal Sarkar.
Steps:
- Run BFC on daq files.
- Loop over MuDsts to create an ntuple with track pairs (some events have more than 2 tracks, and all combinations are tried), labeling the track with the higher y value (vertical position) of its last hit as track "1", and so assuming it is the incoming track.
- Loop over ntuple to find pairs where tracks are back-to-back in polar and azimuthal angles.
- Plot (q1/pT1)-(q2/pT2) versus various quantities.
- FitSlicesY using a Gaussian and then plot the means Δ(1/pT), and widths divided by √2 to represent single track resolution δ(1/pT).
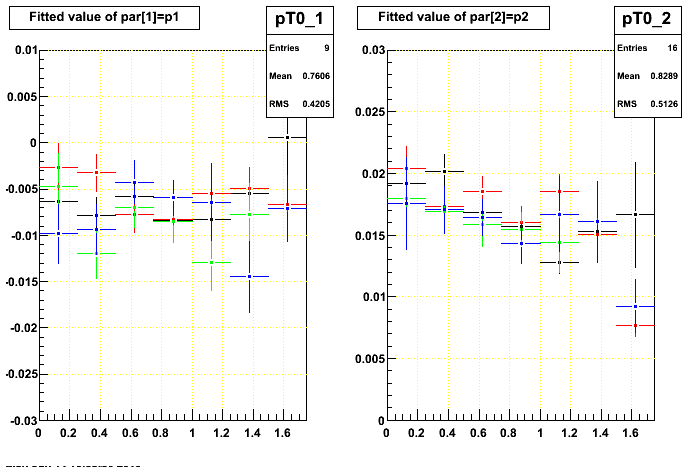
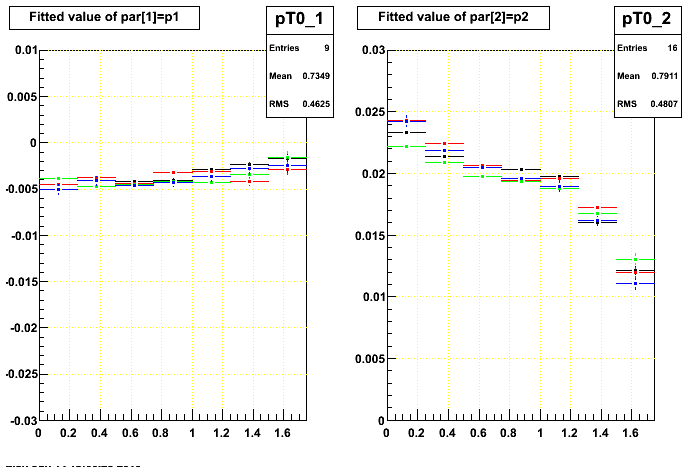
The plot pairs below are the means (left panels) and widths (right panels) for a portion of the cosmic ray data acquired on June 8, 2010 (day 159) with different anode voltage settings, intended to help understand what impact on momentum resolution to expect from reduced anode voltages if we decide to run that way in the future. There are two groups of triggers: those using the MTD in coincidence with a TOF pair (left plot pairs), and those not using the MTD but just a TOF pair (labeled the "TOF group", right plot pairs).
I. Versus pT
I believe we were expecting resolution to be flat vs. pT above 1 GeV/c (I have placed a cut of pT > 1 GeV/c for all plots on this page as multiple scattering contributes at low pT). The results here show systematically over different voltage runs two things:
- Resolution is not flat vs. pT (this remains to be understood).
- Resolutions appear to have no significant dependence on anode voltage in the range of voltages tested.
The different colors show different anode voltage settings:
- Black : run 11159020 : 1135V / 1390V (inner / outer)
- Red : run 11159008 : 1100V / 1390V
- Green : run 11159010 : 1100V / 1345V
- Blue : run 11159015 : 1070V / 1345V
The horizontal axis is actually log10(pT), so the plot extends from 1 GeV/c to 50 GeV/c, where pT ≡ 2/((q1/pT1)+(q2/pT2)), since we really measure radius of curvature and determine pT from its reciprocal (I am in essence taking the average measured charge-signed radius of curvature).
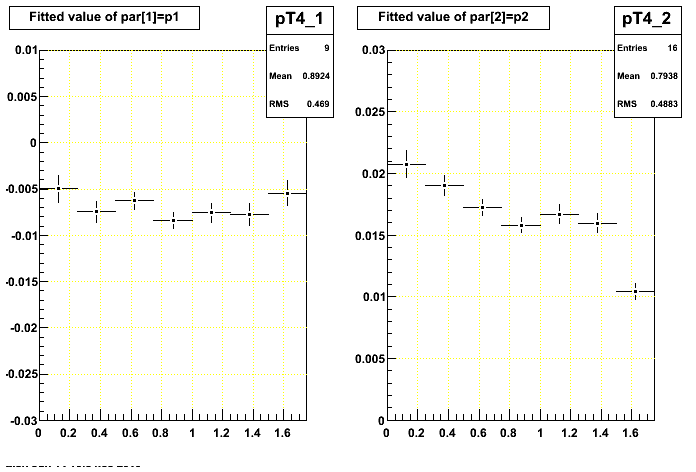
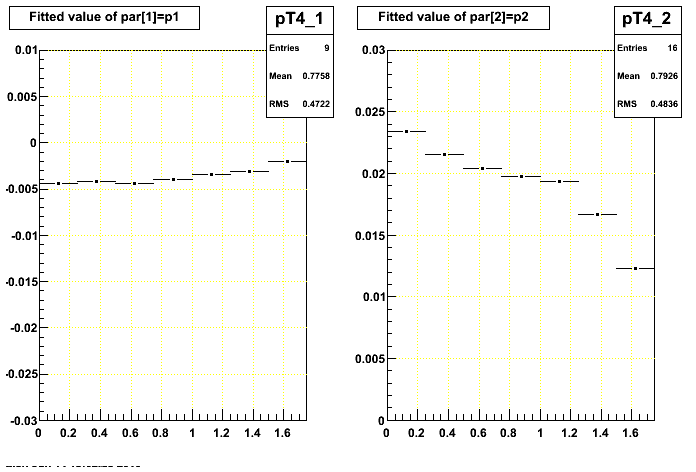
Combining all the voltage sets (for the rest of the plots on this page), I get these results for MTD and TOF triggers:
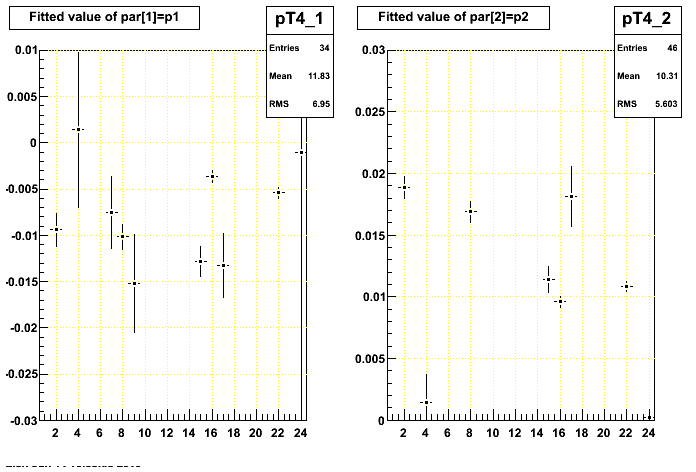
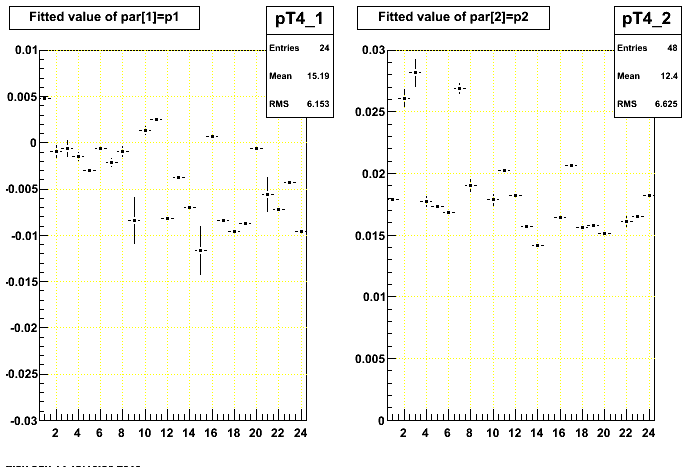
II. Versus Z
Here I calculate z as the average of the z positions of the four points corresponding to the first and last points on the two global tracks.
There seems to be a significant Δ(1/pT) offset between the first and second track for east side sectors (z < 0), which isn't there for west side sectors (z > 0). There should be some energy loss, which would result in a negative value on this plot, but I'm not sure how much. So it isn't obvious to me at first glance whether the west side shows too little energy loss, or the east side too much. We need to do some math.
The resolutions seem to get worse near the central membrane and endcaps.
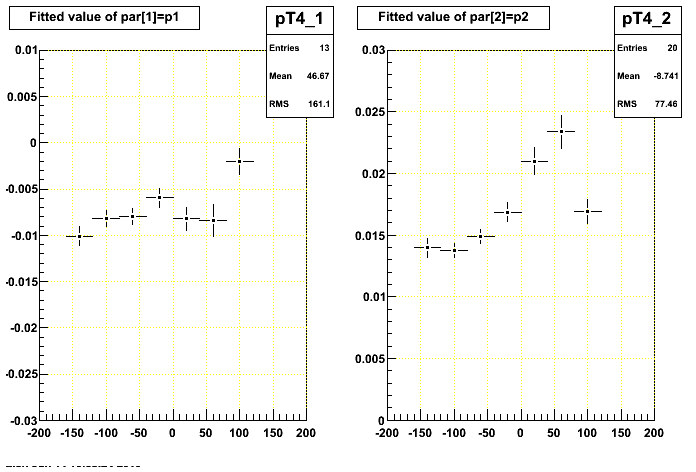
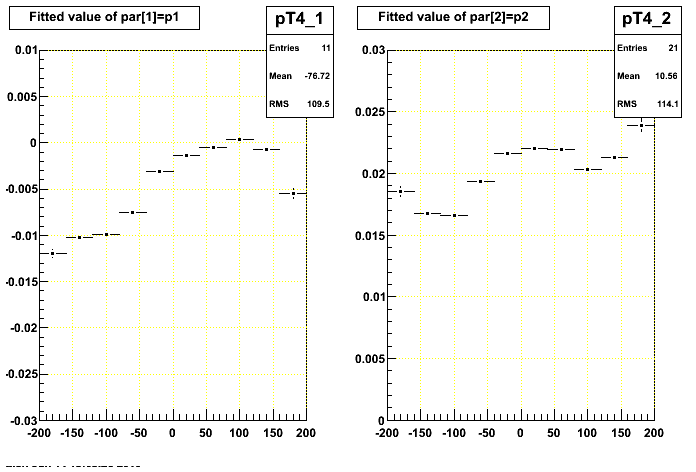
III. Versus Sector
First and last points on tracks are required to stay within a sector. In these plots, I have combined data for the first and second tracks as these are generally non-overlapping groups of sectors. Sectors 3,9,15,21 seem to suffer from being horizontal (and perhaps my azimuthal angle matching cut...I will need to check this).
The TOF group shows that there are a few other sectors with notably bad resolutions: 2 and 7 are really bad, while 8,11,17 are also worse than average.
Also making an appearance is the east-west offset in Δ(1/pT) noted earlier in the z dependence (sectors 1-12 are on the west, 13-24 on the east).
-Gene
Groups:
- genevb's blog
- Login or register to post comments