- genevb's home page
- Posts
- 2025
- 2024
- 2023
- 2022
- September (1)
- 2021
- 2020
- 2019
- December (1)
- October (4)
- September (2)
- August (6)
- July (1)
- June (2)
- May (4)
- April (2)
- March (3)
- February (3)
- 2018
- 2017
- December (1)
- October (3)
- September (1)
- August (1)
- July (2)
- June (2)
- April (2)
- March (2)
- February (1)
- 2016
- November (2)
- September (1)
- August (2)
- July (1)
- June (2)
- May (2)
- April (1)
- March (5)
- February (2)
- January (1)
- 2015
- December (1)
- October (1)
- September (2)
- June (1)
- May (2)
- April (2)
- March (3)
- February (1)
- January (3)
- 2014
- December (2)
- October (2)
- September (2)
- August (3)
- July (2)
- June (2)
- May (2)
- April (9)
- March (2)
- February (2)
- January (1)
- 2013
- December (5)
- October (3)
- September (3)
- August (1)
- July (1)
- May (4)
- April (4)
- March (7)
- February (1)
- January (2)
- 2012
- December (2)
- November (6)
- October (2)
- September (3)
- August (7)
- July (2)
- June (1)
- May (3)
- April (1)
- March (2)
- February (1)
- 2011
- November (1)
- October (1)
- September (4)
- August (2)
- July (4)
- June (3)
- May (4)
- April (9)
- March (5)
- February (6)
- January (3)
- 2010
- December (3)
- November (6)
- October (3)
- September (1)
- August (5)
- July (1)
- June (4)
- May (1)
- April (2)
- March (2)
- February (4)
- January (2)
- 2009
- November (1)
- October (2)
- September (6)
- August (4)
- July (4)
- June (3)
- May (5)
- April (5)
- March (3)
- February (1)
- 2008
- 2005
- October (1)
- My blog
- Post new blog entry
- All blogs
Residuals from simulations with ideal alignment
Using simulations of pT = 5 GeV/c pi+ and pi- from Maxim, I tried to understand a little better what leads to the non-zero residuals he sees. I explored two things in this blog post: (1) contamination from backgrounds, and (2) pT / curvature dependence.
1. Backgrounds
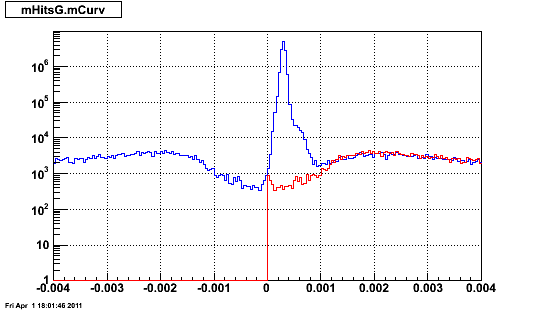
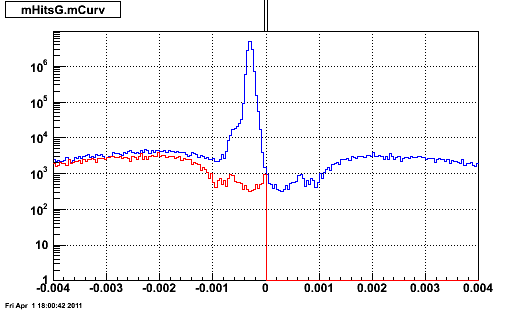
A big problem in a previous iteration, Maxim tried to turn off GEANT's scattering processes. However, it appears this has not eliminated the backgrounds as can be seen in these plots of global track curvature in the pi- and pi+ samples (note that the curvature has the opposite sign as the track's charge). Blue is the full distribution, while red is the opposite sign tracks mirrored around zero to give some sense of possible backgrounds under the peak.
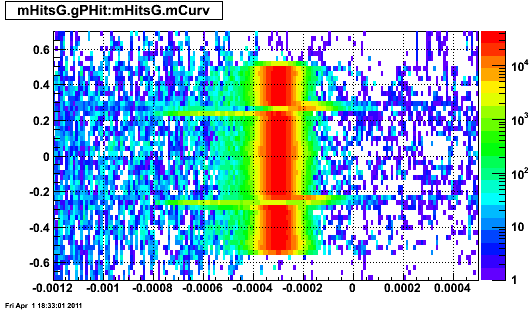
But there's more to the story. Here's the plot of curvature vs. phi for the same two sets:
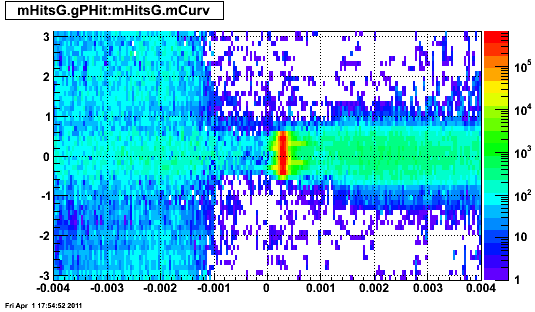
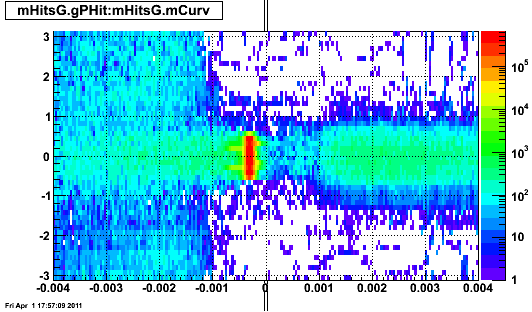
This makes it clear that the backgrounds for positive and negative curvature are NOT the same. There is some positively charge (negatively 'curved') background which covers all phi, but this is not true for negative charge, nor at small curvature (high pT). Clearly, cuts are still needed on the signal region.
Cutting on curvature between [0,0.0005], here are the residuals for pi- and pi+ respectively vs. local x, along with other quality cuts (exclude sector edges, exclude tracks crossing central membrane, |η|<0.87, sector = 3 or 21):
As Maxim saw, the residuals are still different for pi- and pi+, and non-zero.
2. pT / curvature dependence
Zooming in on the previous curvature vs. phi for the pi+ on the signal region:
I probably want to cut even more tightly on the curvature of the signal region. But before doing that, there's more to learn.
Interestingly, I see that there's a big impact of the sector boundaries on the reconstructed curvature (or pT). This helped me realize that the curvature and pT are not stored as constants for all hits on a track, but vary with each point. What follows are pictures of track pT (depth) vs. curvature (height & color) vs. local x from 6 events with just the one simulated track, and the entire track passes the aforementioned quality cuts.
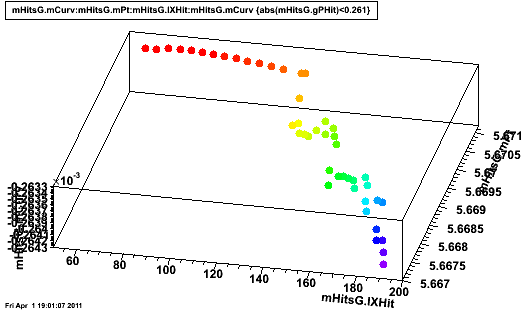
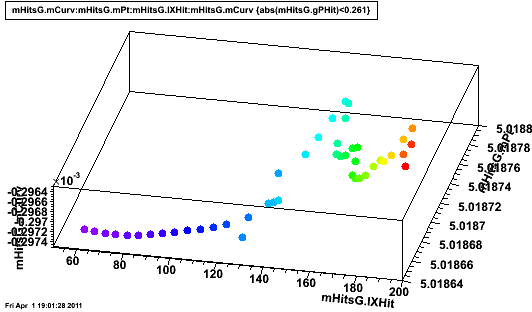
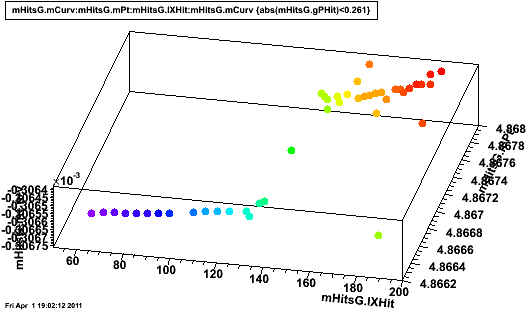
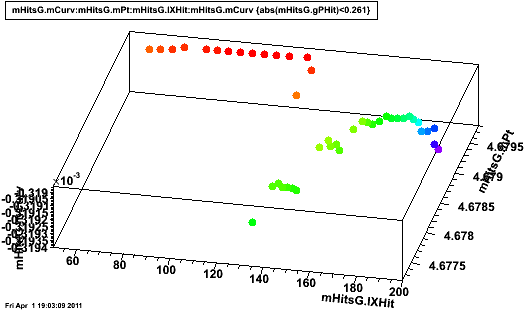
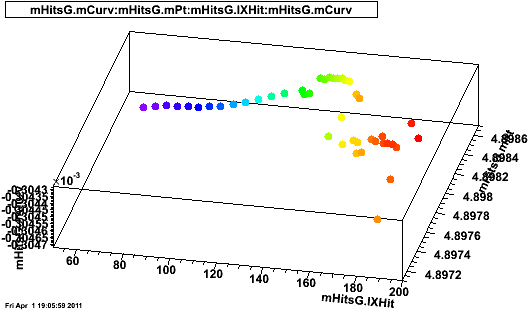
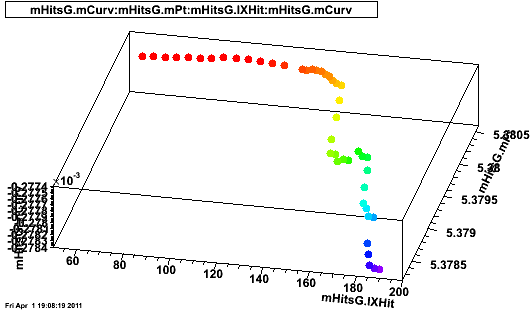
These plots serve to help elucidate what the tracker is capable of doing. The track fit starts at the outer x and works its way inwards, and can see a fair bit of variance up and down in curvature and pT, but the two don't strictly follow each other for each point. The inner TPC hits have large hit error in this study, so wherever the curvature and pT are by padrow 14, they pretty much stay that way through the inner sector, obeying only the projected energy loss from there in. Here is mean curvature vs. local x, and one can see the curvature getting smaller in magnitude at large local x, which means pT is increasing (energy loss is being accounted for). Interestingly, for the inner sector, the energy loss not as well seen, and may even be going the wrong way! This could be a sign that I have not sufficiently gotten rid of backgrounds, particularly for the inner padrows?

These plots do not give the appearance of a pT or curvature which is a running average from padrow 45 in to padrow 14. This means that the final assigned pT for the track (associated with its 'first' point) is highly dependent on what happens on the innermost padrows of the outer sector, and can differ a fair amount from what rest of the outer sector may want. I presume this is the result of the tracker's allowance for multiple coulomb scattering (MCS).
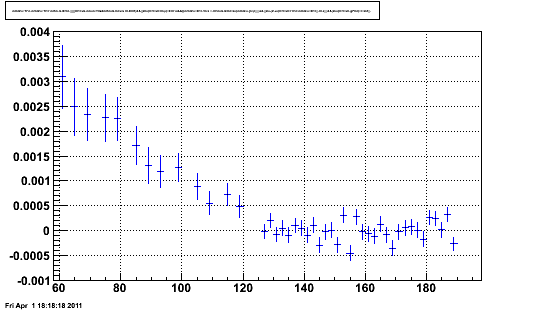
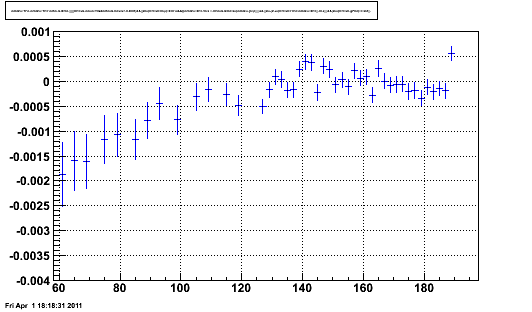
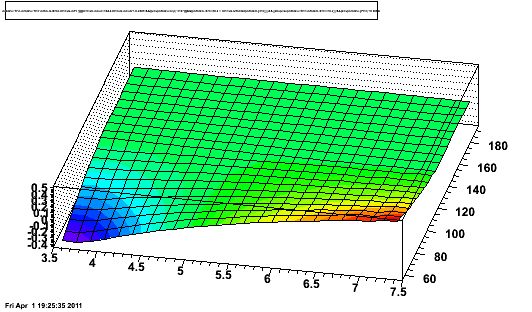
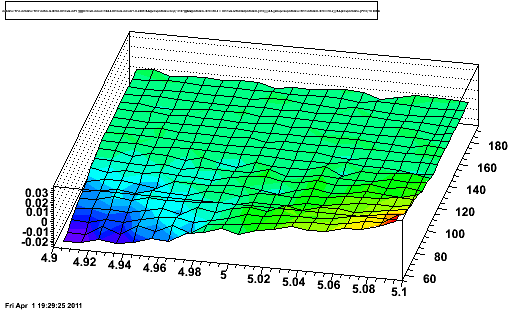
But not just the pT is affected! If MCS causes the track to be biased one way in curvature after (inside) of padrow 14, the track can also systematically point on one side of the rest of the hits. In other words, the reconstructed track pT has a strong correlation with inner sector residuals. This is shown in these plots of mean residuals after quality cuts for pT in the range [3.5,7.5] GeV/c, and the zoomed in the [4.9,5.1] GeV/c:
The projection of the [4.9,5.1] GeV/c plot for residuals vs. local x looks like this:
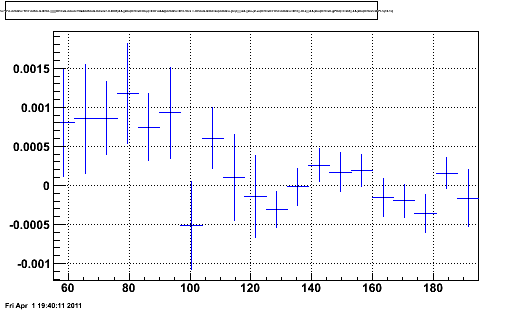
This is within 10 microns of zero, which isn't too bad. But what we've done with this pT cut is to bias towards tracks which reconstructed as we wanted them, so we lose our understanding of what's truly happening on average. Making a tight cut on reconstructed pT (or curvature) introduces a dangerous bias. This makes me hesitant to make tighter curvature cuts as a means to clean up the background in the simulation. We probably want to find some way to pick the actually simulated 5 GeV/c track.
But in both simulation and reconstructed data, this approach of setting very large inner TPC hit errors seems to leave a rather unstable situation of strong dependence on just a few padrows.
__________________
My thought at this point is that if we can deactivate the allowance for MCS in the tracker, then we can avoid this strong dependence on what happens on just the innermost outer TPC padrows and better leverage the entire outer TPC hit ensemble in both determining the pT and projecting the track through the inner sector. While MCS better represents reality, I think it adds volatility (reduces stability) of the track projection, which is what we are trying to use the internal TPC alignment.
First feedback from Victor is that the tracker is not designed with an easy switch to turn MCS off.
-Gene
Groups:
- genevb's blog
- Login or register to post comments