Nfit vs. pT
One of the proposed effects contributing to RT ticket 2106 is that Nfit changes naturally as a function of pT, so coarse binning in pT can show Nfit differences between samples which have different pT distributions (e.g. flat in pT vs. exponential). This can be easily examined from a MuDst file, plotting the Nfit distribution as a function of pT.
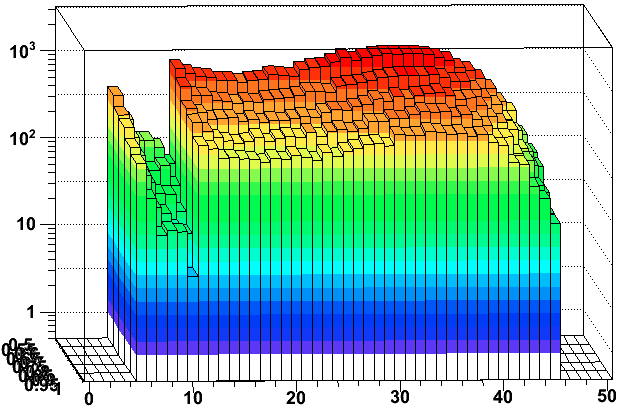
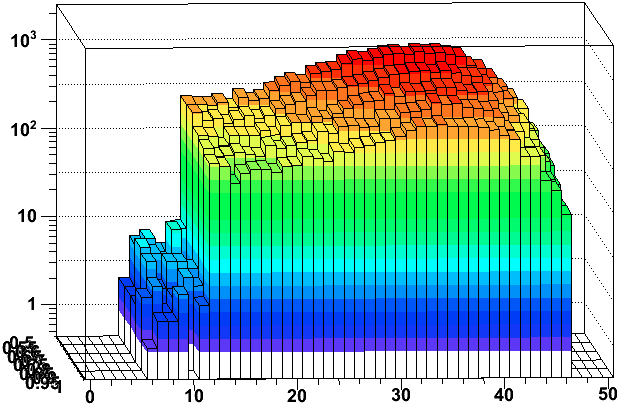
Here is the 2D Nfit vs. pT distribution from 2500 events from the SL10k production of st_physics_11049001_raw_1040001, followed by the profile of Nfit vs. pT with RMS in black and error on the mean in red. The first pair is global tracks, and the second pair is primary tracks. I have restricted tracks to 0.4 < η < 0.6 as has been used in the RT ticket discussion.
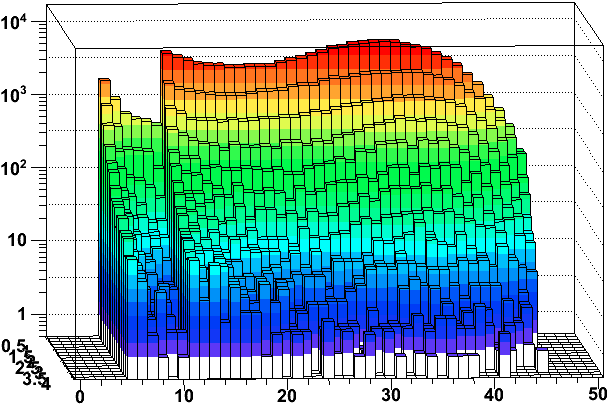
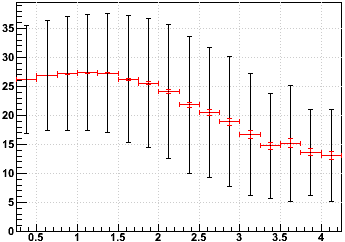


The profile numbers indicate that the global tracks have a strong dependence with pT, but the global tracks have a significant pile-up contribution (I made no cuts to eliminate that). Using primary tracks shows a much smaller dependence on pT.
Embedding QA uses bins of 0.5 GeV/c in pT to compare distributions. So I now turn to looking at the difference in Nfit across the pT bin 0.5 < pT < 1.0 GeV/c (still retaining 0.4 < η < 0.6), with the 4 plots the same otherwise:
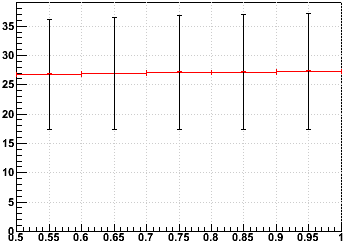
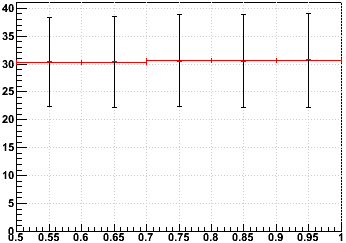
Very little dependence can be seen.
My conclusion is that 0.5 GeV/c binning is large enough to ignore any variation of Nfit as a function of pT within that bin, whether looking at globals or primaries.
-Gene
- genevb's blog
- Login or register to post comments