- genevb's home page
- Posts
- 2025
- 2024
- 2023
- 2022
- September (1)
- 2021
- 2020
- 2019
- December (1)
- October (4)
- September (2)
- August (6)
- July (1)
- June (2)
- May (4)
- April (2)
- March (3)
- February (3)
- 2018
- 2017
- December (1)
- October (3)
- September (1)
- August (1)
- July (2)
- June (2)
- April (2)
- March (2)
- February (1)
- 2016
- November (2)
- September (1)
- August (2)
- July (1)
- June (2)
- May (2)
- April (1)
- March (5)
- February (2)
- January (1)
- 2015
- December (1)
- October (1)
- September (2)
- June (1)
- May (2)
- April (2)
- March (3)
- February (1)
- January (3)
- 2014
- December (2)
- October (2)
- September (2)
- August (3)
- July (2)
- June (2)
- May (2)
- April (9)
- March (2)
- February (2)
- January (1)
- 2013
- December (5)
- October (3)
- September (3)
- August (1)
- July (1)
- May (4)
- April (4)
- March (7)
- February (1)
- January (2)
- 2012
- December (2)
- November (6)
- October (2)
- September (3)
- August (7)
- July (2)
- June (1)
- May (3)
- April (1)
- March (2)
- February (1)
- 2011
- November (1)
- October (1)
- September (4)
- August (2)
- July (4)
- June (3)
- May (4)
- April (9)
- March (5)
- February (6)
- January (3)
- 2010
- December (3)
- November (6)
- October (3)
- September (1)
- August (5)
- July (1)
- June (4)
- May (1)
- April (2)
- March (2)
- February (4)
- January (2)
- 2009
- November (1)
- October (2)
- September (6)
- August (4)
- July (4)
- June (3)
- May (5)
- April (5)
- March (3)
- February (1)
- 2008
- 2005
- October (1)
- My blog
- Post new blog entry
- All blogs
Distortion maps due to sector misalignment
(open the images on this page in a new tab/window for larger versions; all units are [cm] or [radians] or [volts])
Following my previous post, I nearly completed modifying StMagUtilities to calculate the distortions due to misalignments of the TPC sector which create z displacements of the gated grid for each sector, thereby distorting the E field.
First, a toy displacement model test of a distortion to a 1.0 mm displacement of the inner edge of the outer subsector 12 into the TPC volume, and similarly a 0.5 mm displacement of the inner edge of the outer subsector 24 into the TPC volume. Note that a displacement into the TPC means that the potential rises more rapdily towards zero going from the central membrane (at high negative potential) to the endcap (at low negative potential) than design. This is the equivalent of the design potential plus a distortion potential which is positive at the endcap (the sign of the distortion is important, and I discuss it in more detail in the Appendix at the bottom of this page). Here is the distortion potential [volts] at the ideal gating grid z positions (+208.707 cm for west, -208.707 cm for east) in the toy model, starting at a radius of 118 cm as the distortion potential in this model is zero for the inner sectors:
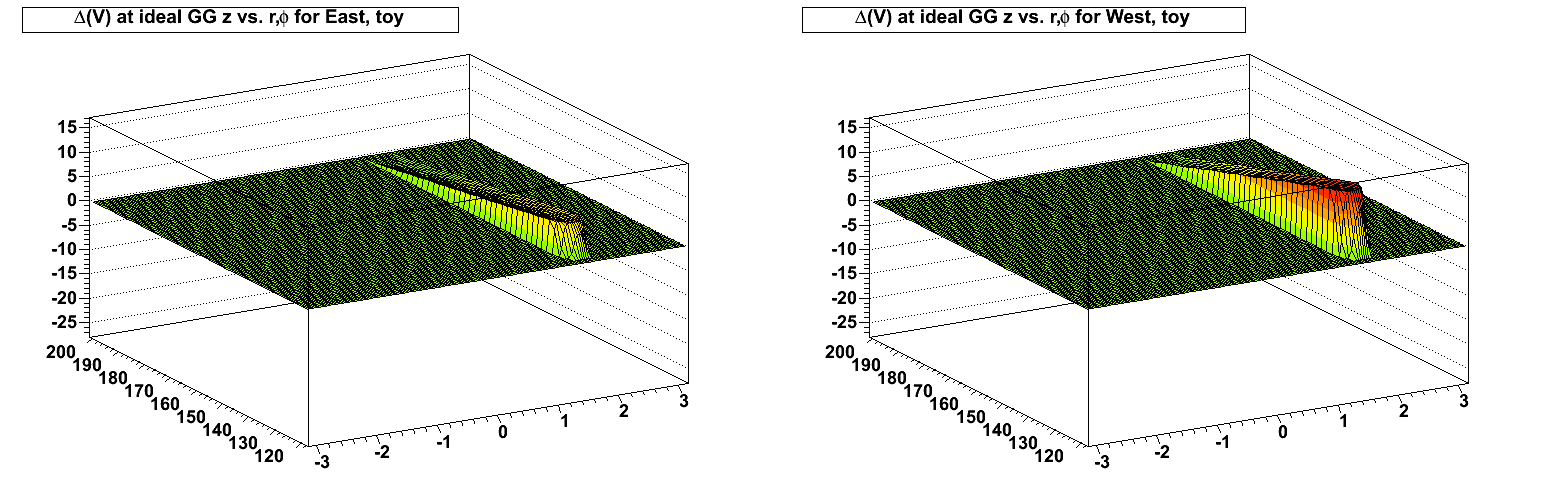
The distortion potentials form a curve at the inner and outer sector edges across phi because the sectors are not arced, and instead follow dodecagon (12-sided).
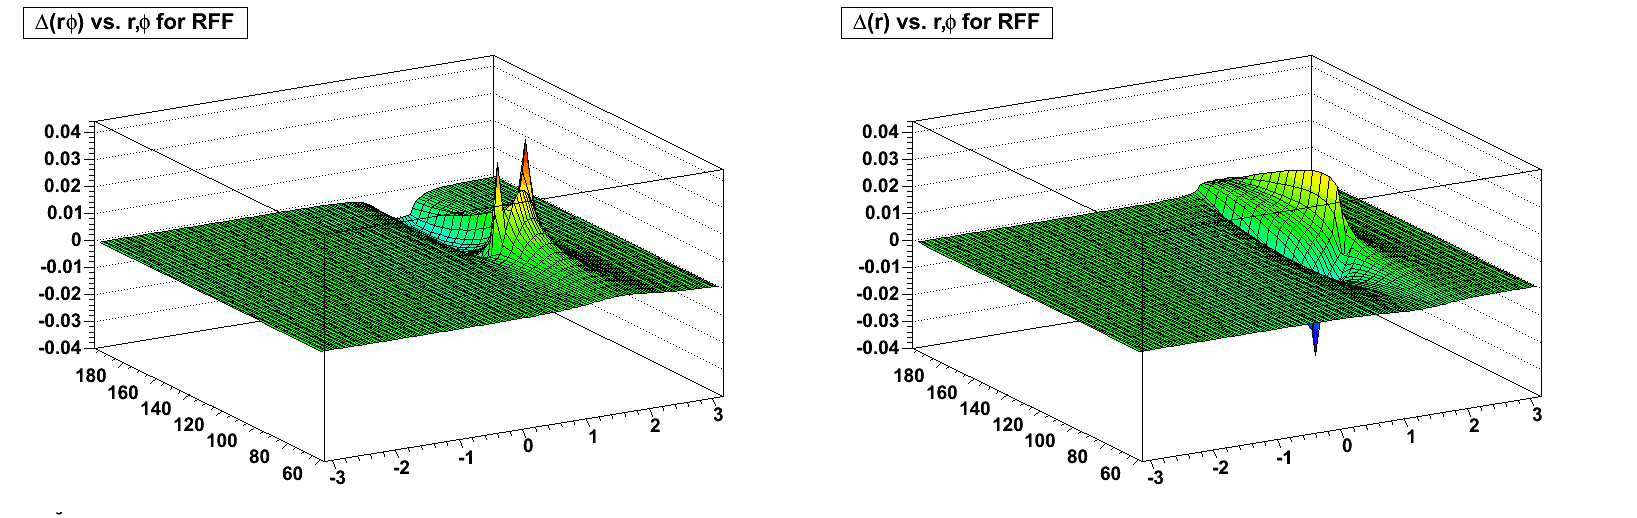
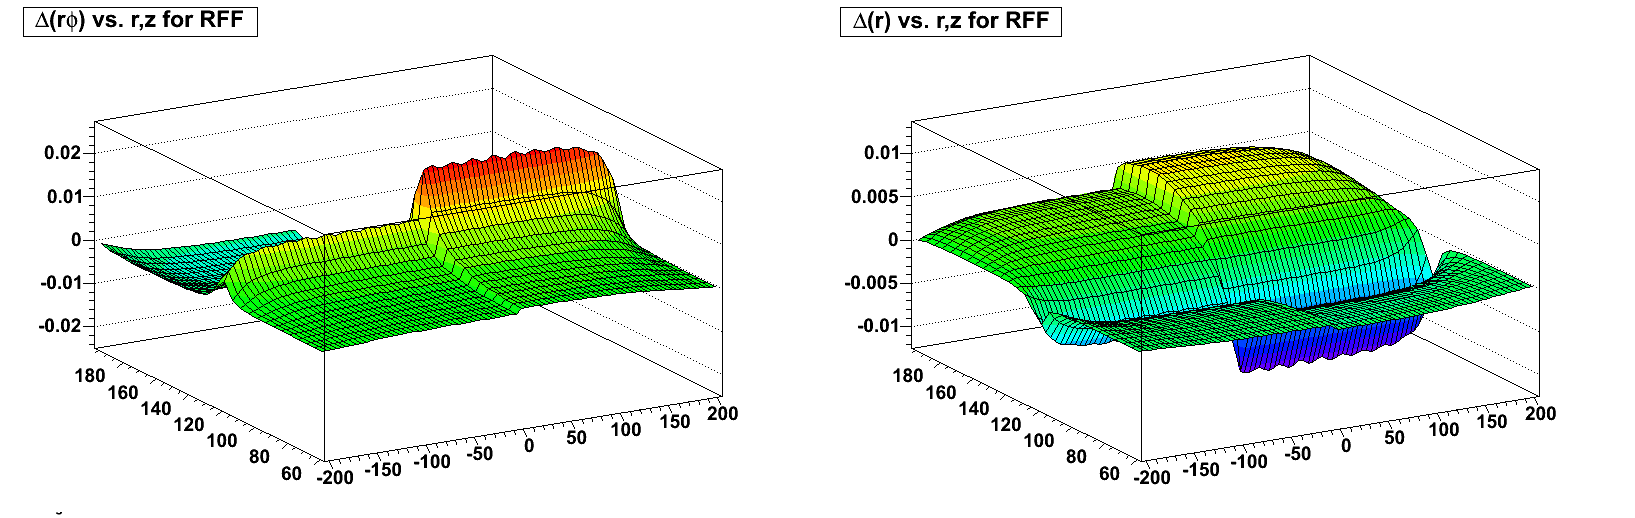
Next are the RFF, FF, and ZF (zero field) distortions in the azimuthal and radial directions from the toy displacement model near the central membrane (full drift) on the west side (showing the distortion from sector 12):
RFF:
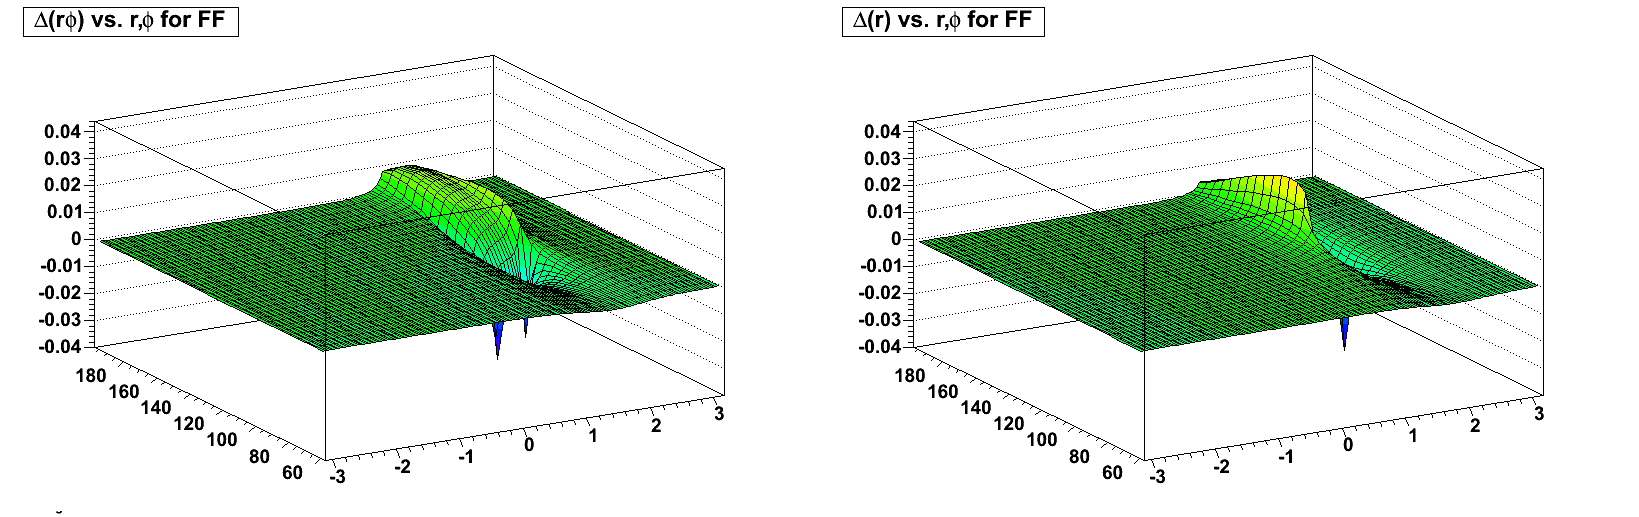
FF:
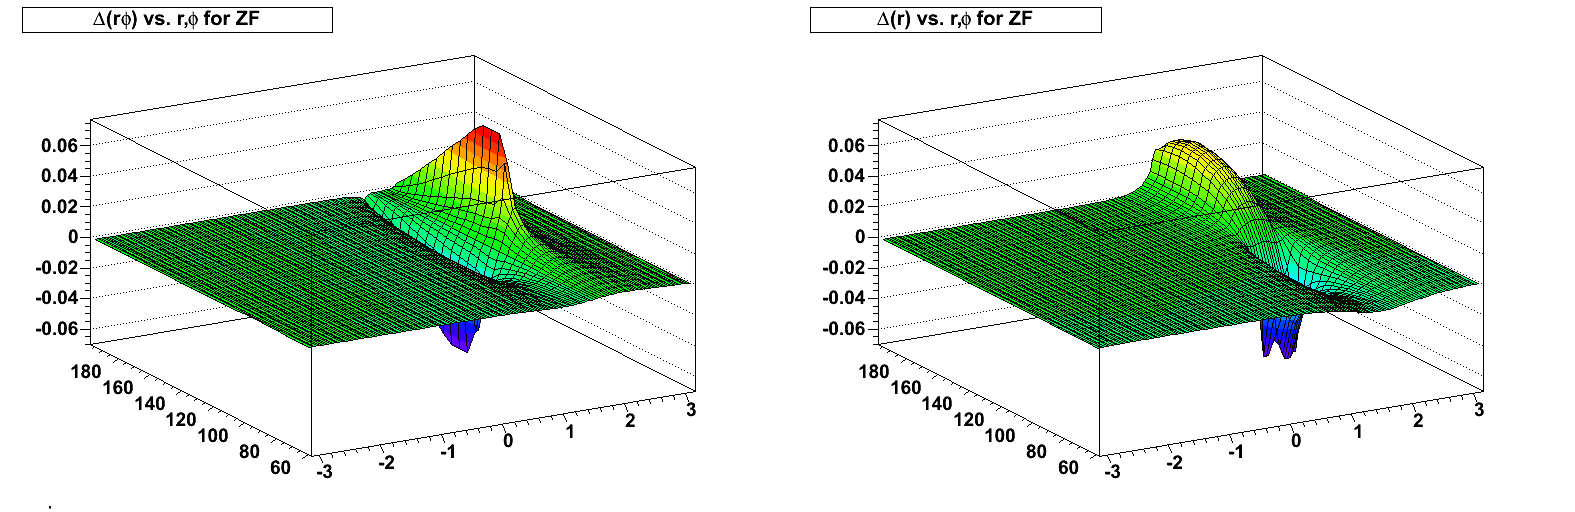
ZF: (note the change of scale)
The distortions are due to both radial and azimuthal E field components. When the B field is flipped, the radial E field component contribution to the azimuthal distortion flips sign, but the azimuthal E field component contribution does not. Inversely, the radial E field component contribution to the radial distortion does not flip sign, but the azimuthal E field component contribution does. This mixture means it is not a straightforward flip of the distortions with the flip of magnetic field signs.
One can understand, however, that the largest azimuthal E field components are along the boundaries between sectors, while the largest radial components are at the edge between inner and outer sectors (near radius ~125 cm). The two effects combine maximally at the intersections of sector boundaries and the inner-outer sector edge, thus the spikes seen in the above plots.
Continuing with the toy displacement model, here are the azimuthal and radial distortions vs. r and z for a vertical slice through the center (x=0) of sectors 24 (z < 0) and 12 (z > 0), demonstrating how the z dependence is mostly near the endcap and there is little variation over most of the drift length (I'm not sure what causes the saw tooth pattern in these histograms in the peak bins, as it doesn't appear in neighboring bins; some kind of binning artifact? it's very small in total magnitude):
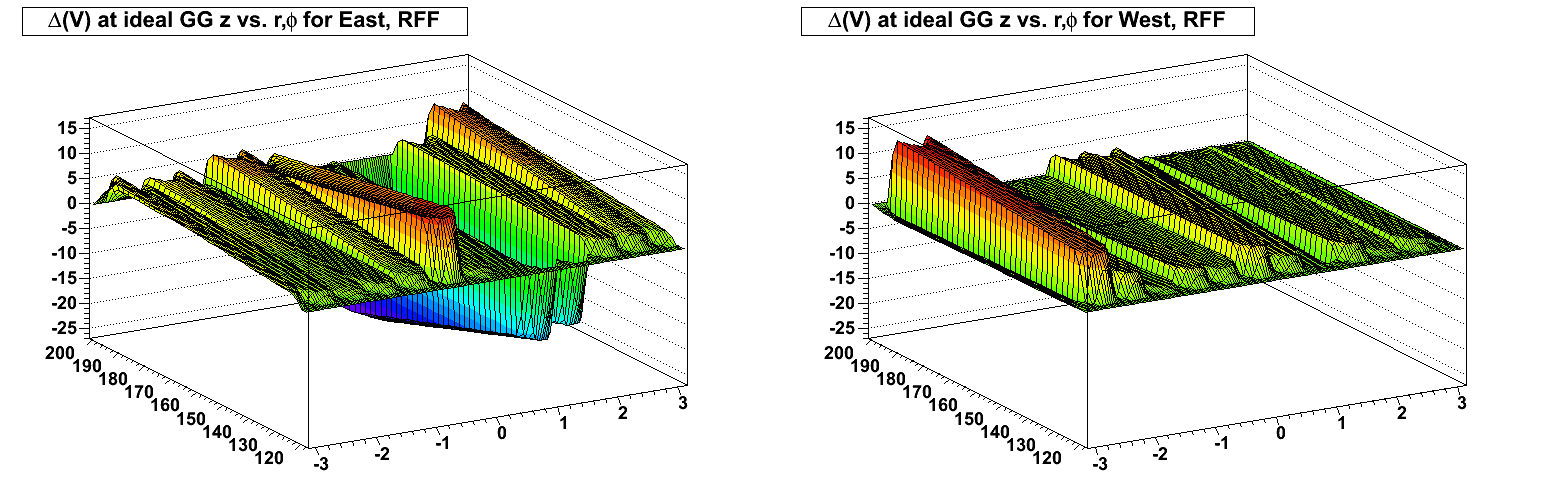
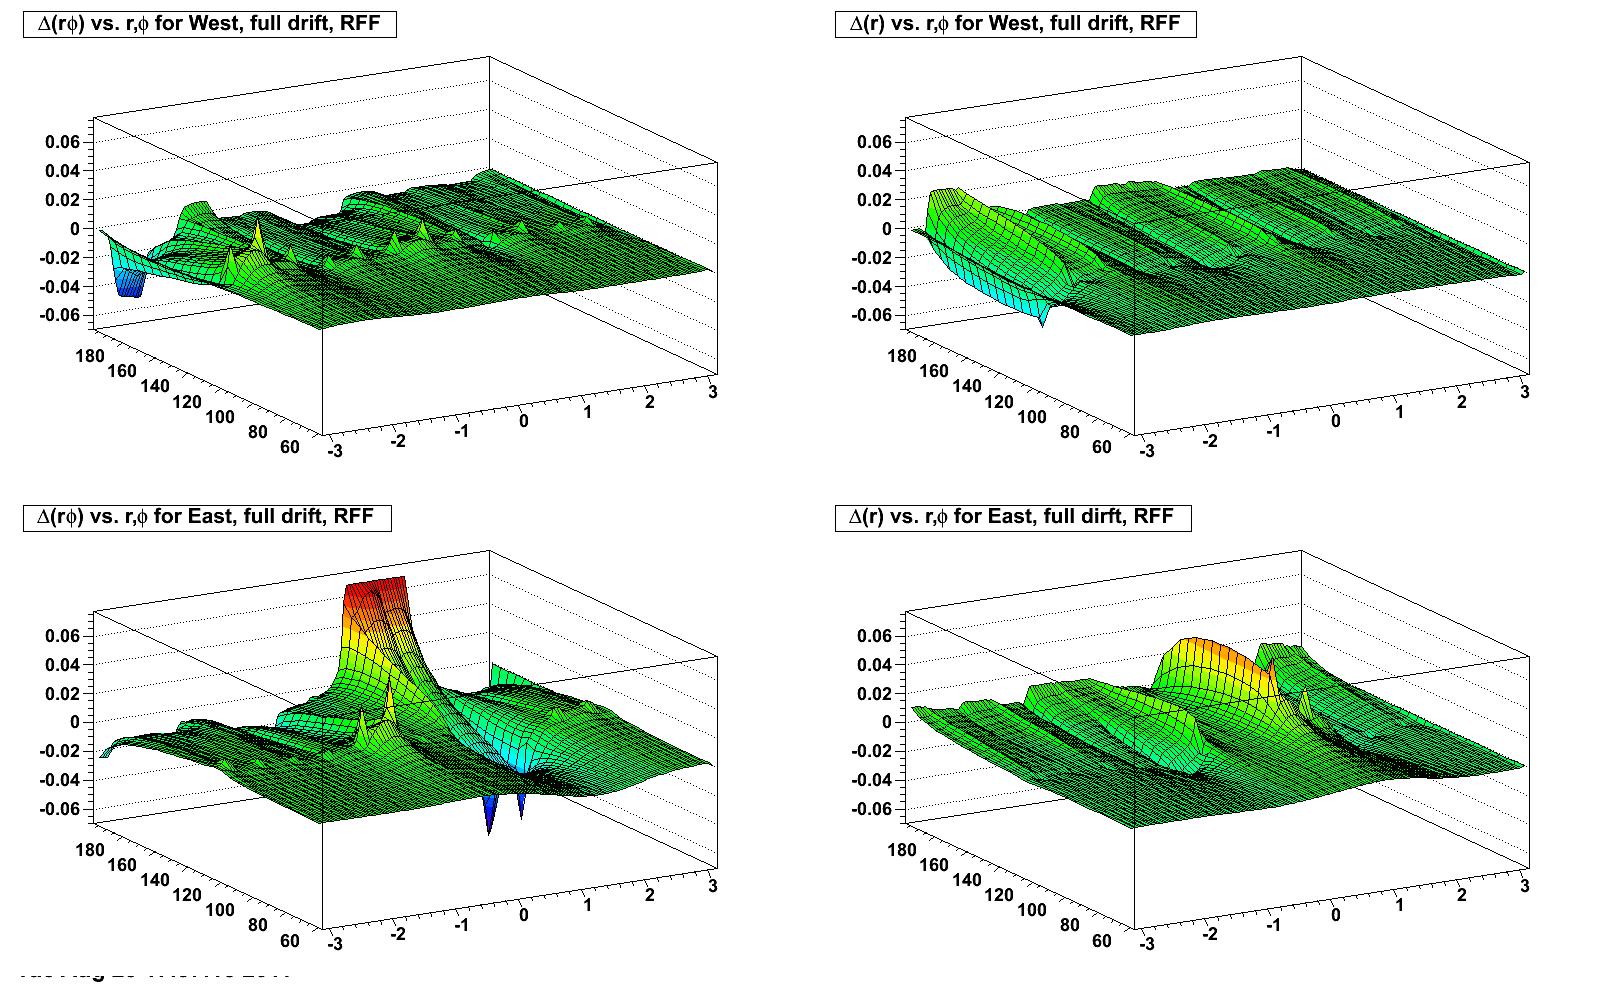
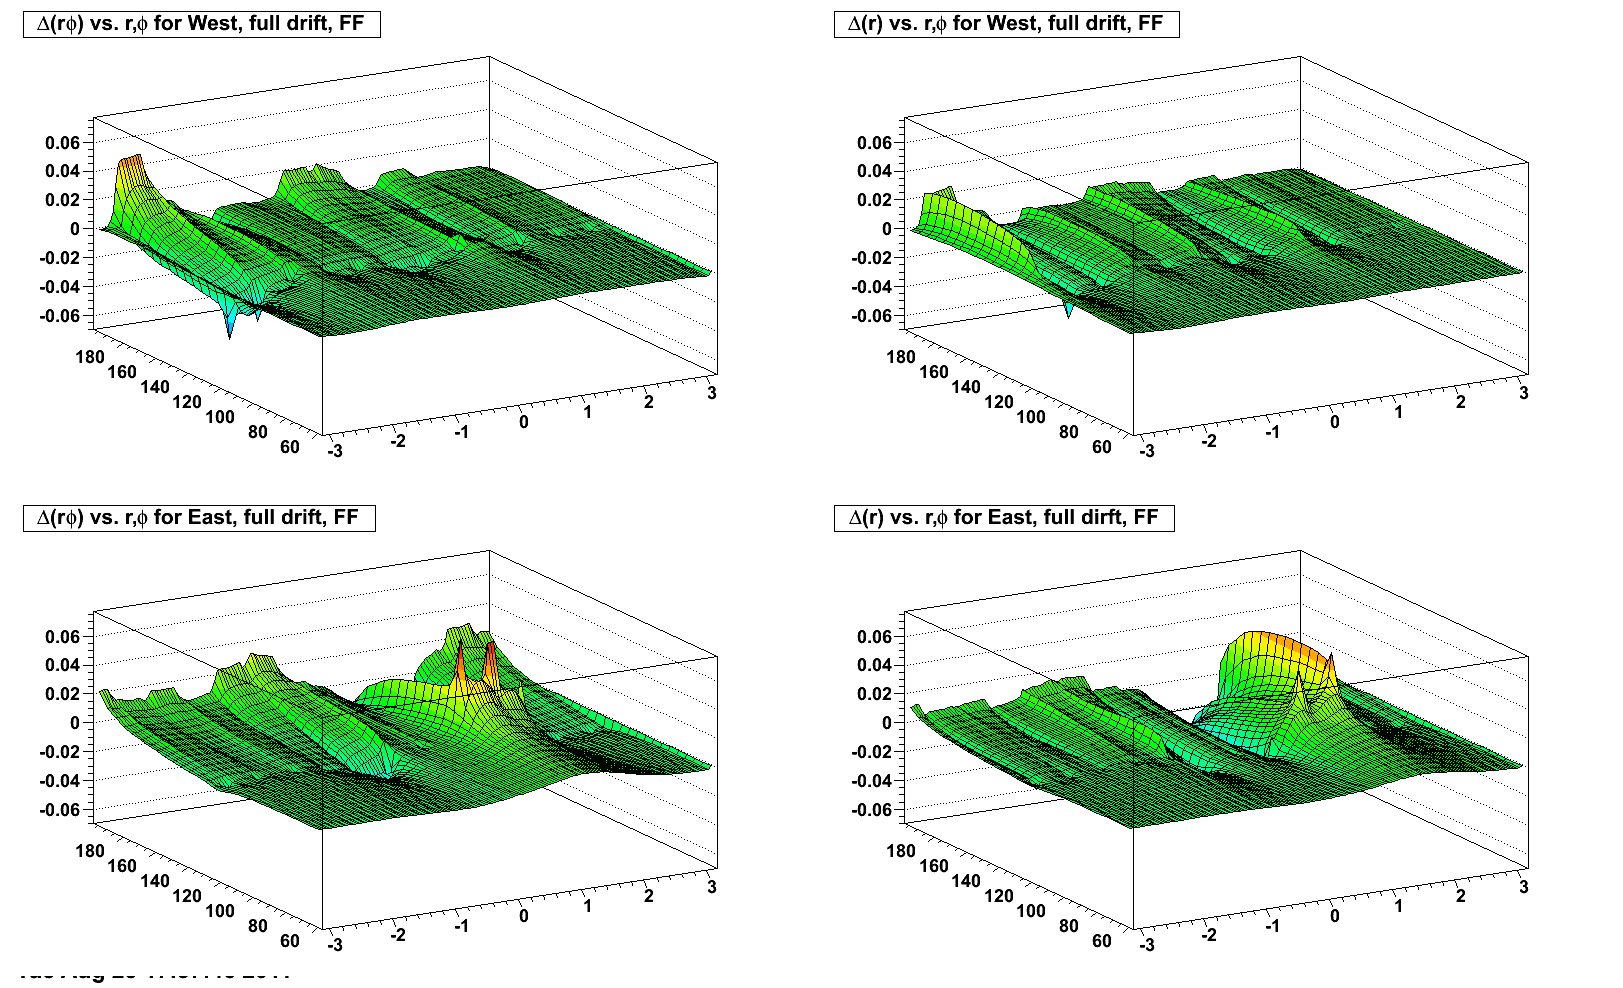
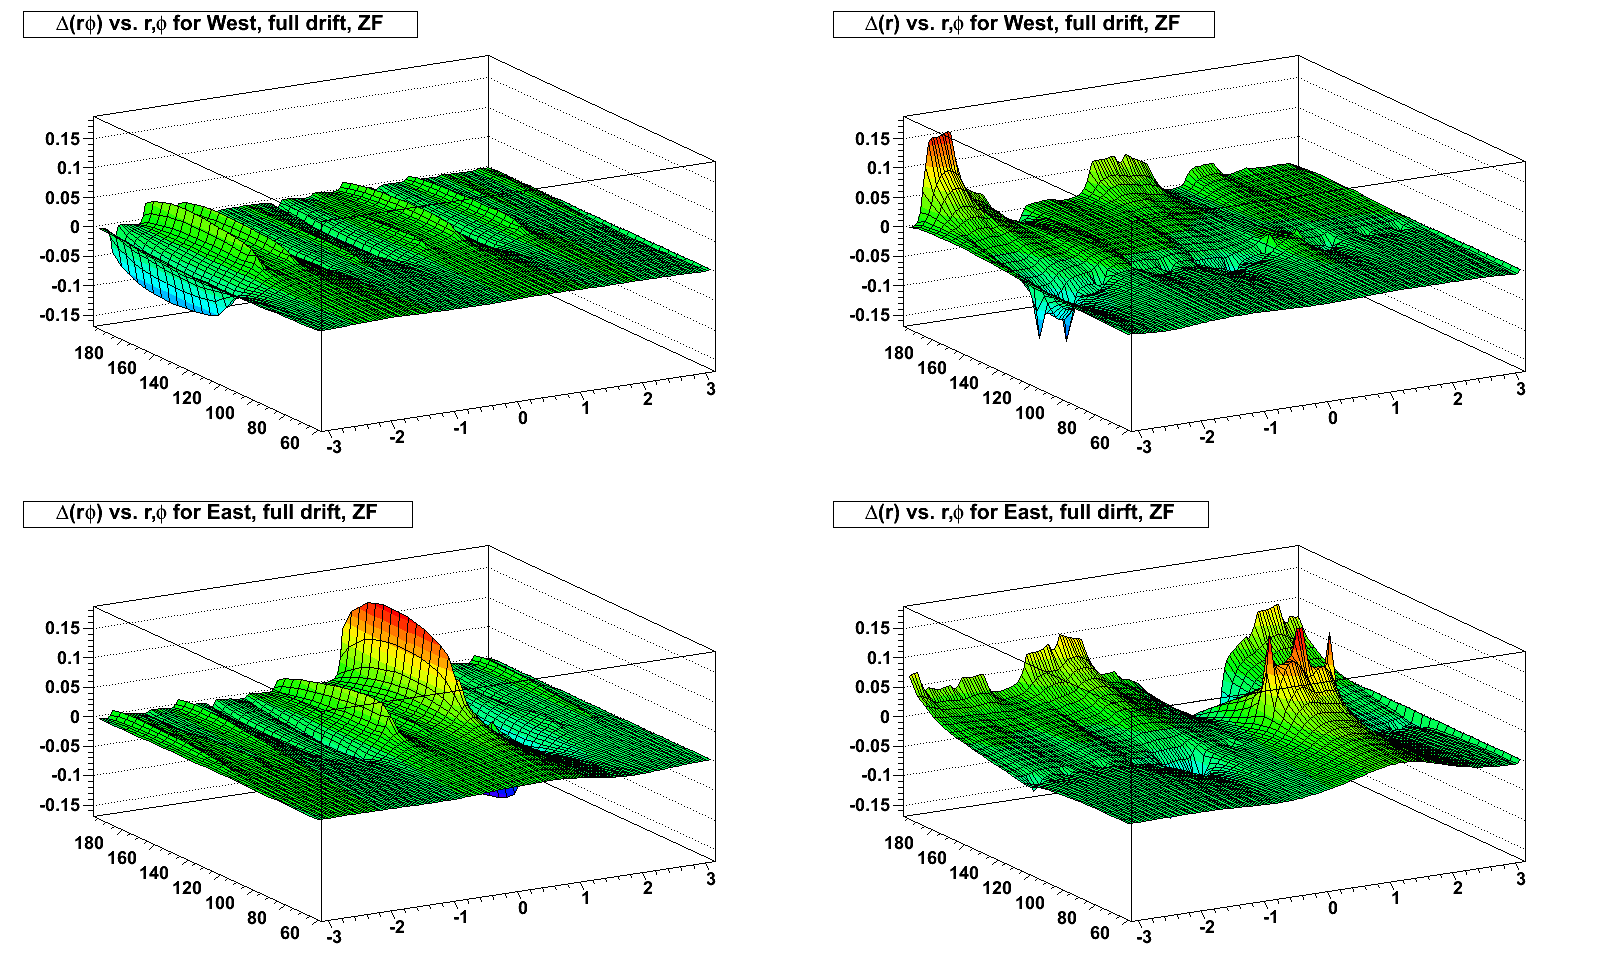
Shifting towards real data, using the recent calibration parameters from Yuri for the internal sector alignment, and the existing DB parameters for the super-sector alignment (copied to Run 11 from the year 2000 alignment, I believe), I've made plots of the resulting distortion potentials (again starting at a radius of 118 cm because the year 2000 alignment has no z displacements in the super-sector alignment, and therefore no distortion potential in this scheme), and then azimuthal and radial distortions vs. azimuth and radius for z near the central membrane (full drift) for West and East TPC halves (note the change of scale for the ZF distortions, as they are significantly larger in spots):
RFF:
FF:

ZF (using the FF alignment parameters; note the change of scale):
The code for these distortion corrections has been committed and can be activated by using the BFC chain option "OSectorAlign".
-Gene
__________________
APPENDIX: Determining the sign of the distortion potential
I create a "local" TPC hit position 3 vector located at the x and y along the sector inner and outer edges, with z = 0. I then apply the TpcDb rotation matrix for that subsector to transform into the "TPC" frame (i.e. SubSInner2Tpc, and SubSOuter2Tpc). This moves the local z=0 to the TPC coordinates at the gating grid (ideally -208.707 for sectors 13-24 in the east, and 208.707 for sectors 1-12 in the west), but offset from the GG by a small amount due to the non-ideality of the alignment. So I might obtain z=208.6 in the TPC coordinates instead of 208.707.
Now I need to turn that number into a potential error...
If the local z=0 position gets moved closer to the central membrane in the TPC coordinates, it implies that the sector reconstructs the hits too close to the endcap in z; or in other words, too early in time. Recording too early in time means that the sector actually sticks out into the TPC volume too far. That means the real position of the GG, with its controlled voltage, is too close to the central membrane.
Since the central membrane is at large negative potential (~ -28kV) , and the GG is at small negative potential (~ -115V), moving the GG closer to the central membrane erroneously raises the voltage above where it should be (e.g. it's -115V at a location in z where it's supposed to be -128 V). The error potential (real potential minus ideal potential) at the GG in this case is positive, and that's what I pass along to the usual distortion calculations.
Groups:
- genevb's blog
- Login or register to post comments