- genevb's home page
- Posts
- 2025
- 2024
- 2023
- 2022
- September (1)
- 2021
- 2020
- 2019
- December (1)
- October (4)
- September (2)
- August (6)
- July (1)
- June (2)
- May (4)
- April (2)
- March (3)
- February (3)
- 2018
- 2017
- December (1)
- October (3)
- September (1)
- August (1)
- July (2)
- June (2)
- April (2)
- March (2)
- February (1)
- 2016
- November (2)
- September (1)
- August (2)
- July (1)
- June (2)
- May (2)
- April (1)
- March (5)
- February (2)
- January (1)
- 2015
- December (1)
- October (1)
- September (2)
- June (1)
- May (2)
- April (2)
- March (3)
- February (1)
- January (3)
- 2014
- December (2)
- October (2)
- September (2)
- August (3)
- July (2)
- June (2)
- May (2)
- April (9)
- March (2)
- February (2)
- January (1)
- 2013
- December (5)
- October (3)
- September (3)
- August (1)
- July (1)
- May (4)
- April (4)
- March (7)
- February (1)
- January (2)
- 2012
- December (2)
- November (6)
- October (2)
- September (3)
- August (7)
- July (2)
- June (1)
- May (3)
- April (1)
- March (2)
- February (1)
- 2011
- November (1)
- October (1)
- September (4)
- August (2)
- July (4)
- June (3)
- May (4)
- April (9)
- March (5)
- February (6)
- January (3)
- 2010
- December (3)
- November (6)
- October (3)
- September (1)
- August (5)
- July (1)
- June (4)
- May (1)
- April (2)
- March (2)
- February (4)
- January (2)
- 2009
- November (1)
- October (2)
- September (6)
- August (4)
- July (4)
- June (3)
- May (5)
- April (5)
- March (3)
- February (1)
- 2008
- 2005
- October (1)
- My blog
- Post new blog entry
- All blogs
Issue 2058
Plots for RT ticket 2058:
Looking at file: /star/rcf/test/st_ht_11046044_raw_5130001.daq
Starting with just the first 4 events...(because the 4th event was showing notably slow processing and large Inst/Free values from Sti in DEV, but was fine in SL10k)...
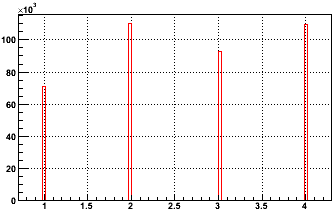
Number of hits per event:

Distribution of hit flag values integrated over those 4 events:

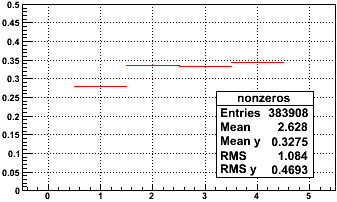
There are plenty of hits with flags 0, 1, 2, 3, and then a few at 10, 16, 96, 97, 98, 99. To get an idea of how these are distributed among the 4 events, I plot here the fraction with flag>0 in each event:

All 4 events are close to having approximately 1/3rd of their hits with non-zero flag values. The mean over 4 events is 0.3275.
Here are the flag bit assignments as recorded in $STAR/StRoot/RTS/src/DAQ_TPX/tpxFCF_flags.h:
#define FCF_ONEPAD              1

#define FCF_DOUBLE_PAD          2	// offline: merged
#define FCF_MERGED		2

#define FCF_DOUBLE_T            4

#define FCF_FALLING             8	// offline: charge too big!
#define FCF_BIG_CHARGE		8

#define FCF_ROW_EDGE            16      // 0x10 touched end of row
#define FCF_BROKEN_EDGE         32      // 0x20 touches one of the mezzanine edges
#define FCF_DEAD_EDGE           64      // 0x40 touches a dead pad
#define FCF_IN_DOUBLE           128	// 0x80 one should use the floating point in the union
#define FCF_CHOPPED		256	// 0x100 cluster is chopped from its neighbour: OFFLINE use only
-Gene
- genevb's blog
- Login or register to post comments
