- genevb's home page
- Posts
- 2024
- 2023
- 2022
- September (1)
- 2021
- 2020
- 2019
- December (1)
- October (4)
- September (2)
- August (6)
- July (1)
- June (2)
- May (4)
- April (2)
- March (3)
- February (3)
- 2018
- 2017
- December (1)
- October (3)
- September (1)
- August (1)
- July (2)
- June (2)
- April (2)
- March (2)
- February (1)
- 2016
- November (2)
- September (1)
- August (2)
- July (1)
- June (2)
- May (2)
- April (1)
- March (5)
- February (2)
- January (1)
- 2015
- December (1)
- October (1)
- September (2)
- June (1)
- May (2)
- April (2)
- March (3)
- February (1)
- January (3)
- 2014
- December (2)
- October (2)
- September (2)
- August (3)
- July (2)
- June (2)
- May (2)
- April (9)
- March (2)
- February (2)
- January (1)
- 2013
- December (5)
- October (3)
- September (3)
- August (1)
- July (1)
- May (4)
- April (4)
- March (7)
- February (1)
- January (2)
- 2012
- December (2)
- November (6)
- October (2)
- September (3)
- August (7)
- July (2)
- June (1)
- May (3)
- April (1)
- March (2)
- February (1)
- 2011
- November (1)
- October (1)
- September (4)
- August (2)
- July (4)
- June (3)
- May (4)
- April (9)
- March (5)
- February (6)
- January (3)
- 2010
- December (3)
- November (6)
- October (3)
- September (1)
- August (5)
- July (1)
- June (4)
- May (1)
- April (2)
- March (2)
- February (4)
- January (2)
- 2009
- November (1)
- October (2)
- September (6)
- August (4)
- July (4)
- June (3)
- May (5)
- April (5)
- March (3)
- February (1)
- 2008
- 2005
- October (1)
- My blog
- Post new blog entry
- All blogs
Closer look at resids in Run 11 cosmics
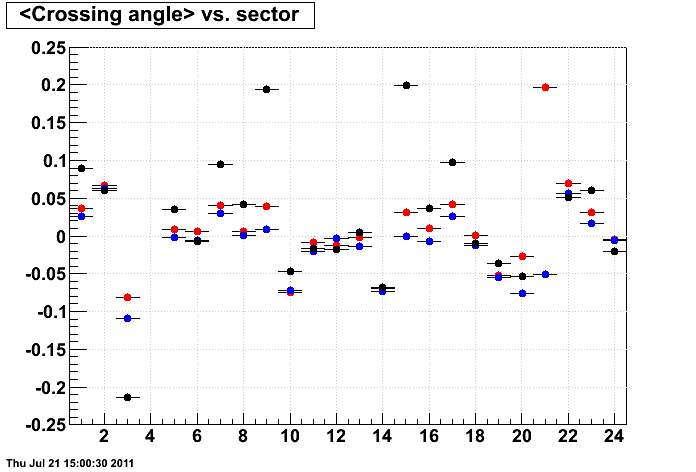
NOTE: Open any image in a new browser window or tab to make it larger. Unless otherwise stated, black data is for zero B field (ZF), blue is full field (FF), and red is reversed full field (RFF).
Continuing looking at cosmic data in Run 11, after my initial look, I processed more data and tried to get a better look at dependencies on B fields. I again used large inner TPC hit errors, selected "quality" tracks staying completely within sectors, and looked at residuals and other values stored in the StiPulls TTree. Here are the statistics on hits (not tracks!) used in these plots vs. sector number, making it clear that statistics are worse for horizontal sectors, and in sectors 4 and 20, which had large dead regions.
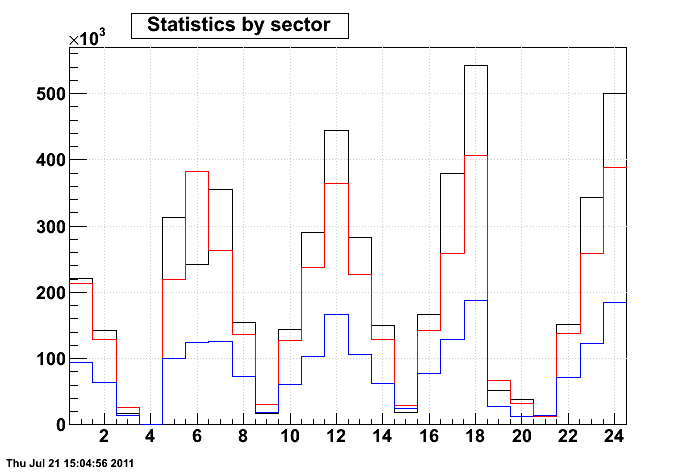
Trigger statistics:
- RFF: 3830426
- FF: 1574532
- ZF: 4691124
Here now are the residuals vs. local x (~radius) for each of the 24 sectors (first row is sectors 1..6, second is 7..12, etc., vertical axis is [-0.09, 0.09 cm]), using FitSlices to get gaussian means, as opposed to histogram profiles:
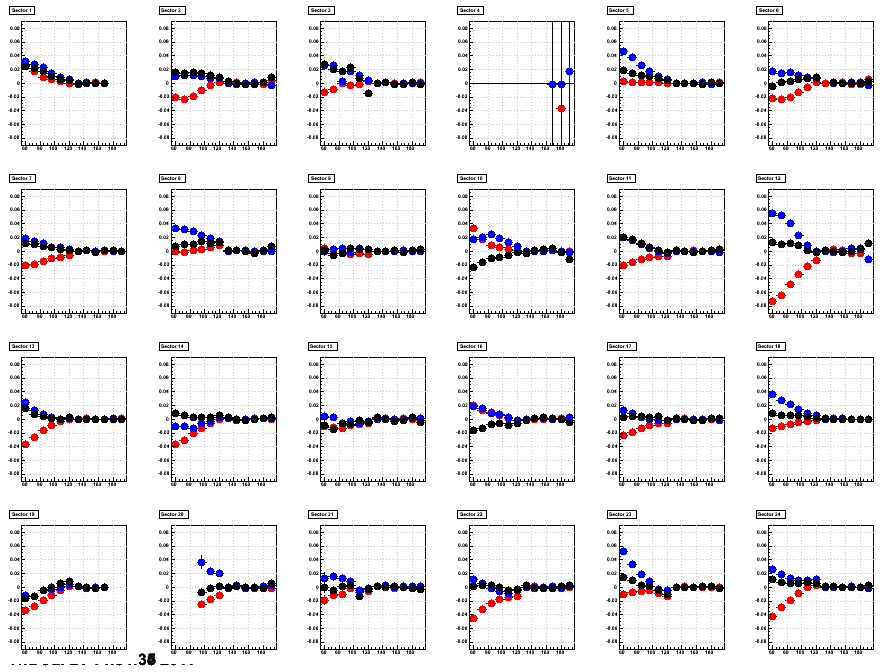
Some interesting features:
- There appears to be a general ordering of blue above black above red (FF above ZF above RFF).
- ZF is not far from flat.
- A "chicken feet" feature observable most prominently in the vertical sectors 6,12,18,24 where divergence between the three field results appear largest, which appears to go away as one moves to the horizontal sectors 3,9,15,21.
- The horizontal sectors seem to have enough statistics that the error bars are smaller than the points, and the point-to-point variation is small.
- It does look like there are some real alignment features visible, such as a shift between inner and outer sectors notable in sectors 22,23,24.
This may be an indicator that a field distortion is in play?
In this next pair of plots, I take RFF mean residuals minus FF and plot 2D converting sectors into azimuth:
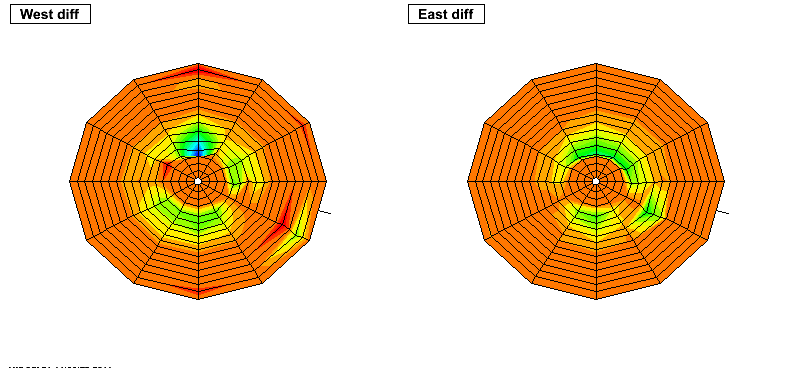
Here again one can see the RFF vs. FF difference is largest in the vertical sectors, but the plot isn't as convincing of a vertical distortion as I had hoped it might be.
Also, a field distortion may have some z dependence, so here is the z dependence of the mean residuals from the first three bins in local X using all sectors.
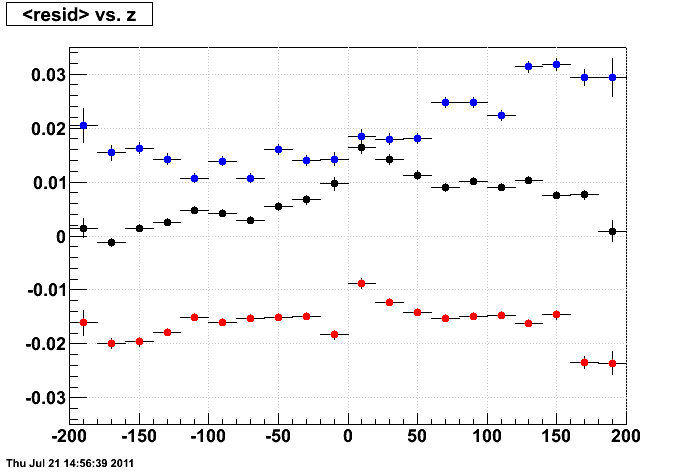
Again, not quite as strong an indicator of a field distortion as one might hope in that the z dependencies aren't clear, nor are they going to zero at the endcaps (though perhaps they do in the ZF data?).
__________
Moving on to Z residuals vs. sector (vertical axis range [-0.09, 0.09 cm]:

Evident here is a lot of timing offsets among the padrows, which appear to be common for all three fields. This looks like there is a lot to sort out. Again using only the first 3 bins in local x, here's the z dependence of the z residuals:
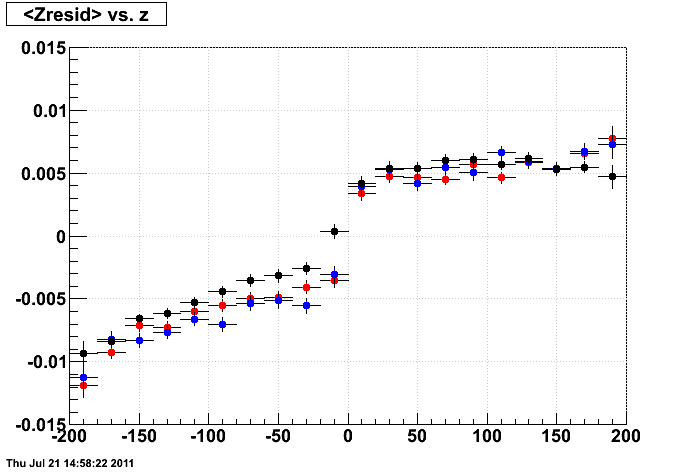
This almost looks like a drift velocity error, but it may have something to do with time-of-flight and probably needs a little deeper investigating.
_________
Other variables vs. sector....
Mean curvature:
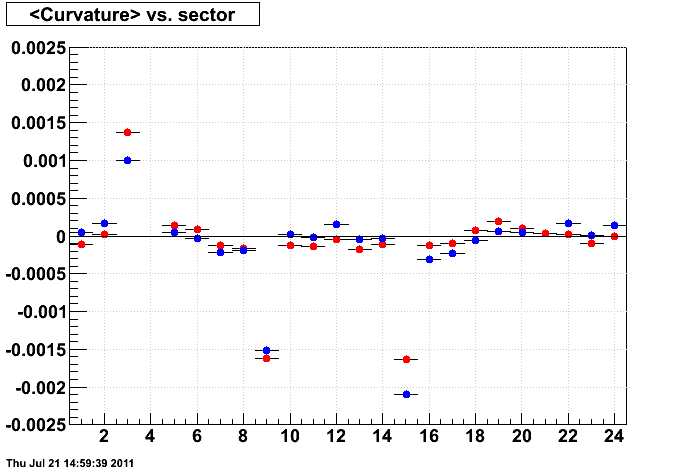
The horizontal sectors show a notable deviation, which may reflect that these are mostly tracks which come from above, not below, so the track has a preference to curve in from that direction (a positive curvature for the south sectors of 3 and 21 [sector 21's FF point is unfortunately way off the vertical scale, probably because statistics were bad for it due to dead regions], and a negative curvature for the north sectors of 9 and 15).
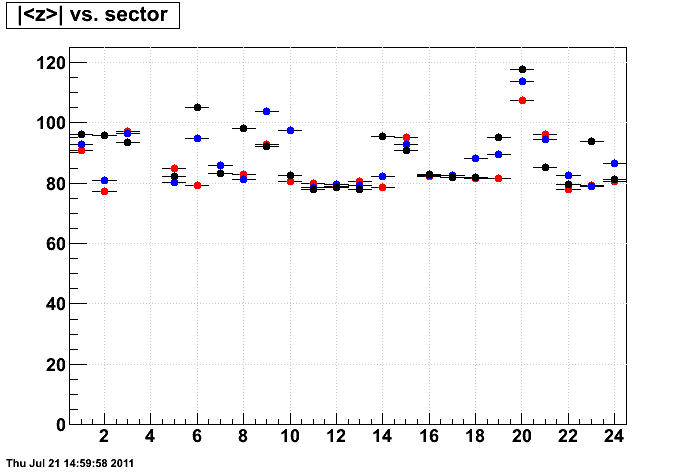
abs(Mean z):
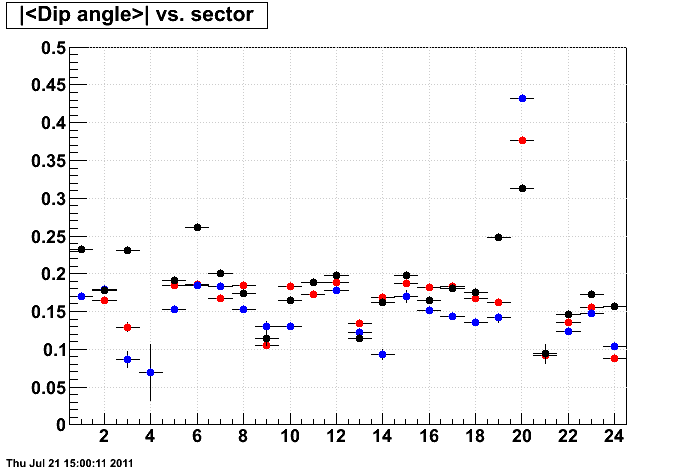
abs(Mean dip angle):
Mean crossing angle:
Groups:
- genevb's blog
- Login or register to post comments