- genevb's home page
- Posts
- 2025
- 2024
- 2023
- 2022
- September (1)
- 2021
- 2020
- 2019
- December (1)
- October (4)
- September (2)
- August (6)
- July (1)
- June (2)
- May (4)
- April (2)
- March (3)
- February (3)
- 2018
- 2017
- December (1)
- October (3)
- September (1)
- August (1)
- July (2)
- June (2)
- April (2)
- March (2)
- February (1)
- 2016
- November (2)
- September (1)
- August (2)
- July (1)
- June (2)
- May (2)
- April (1)
- March (5)
- February (2)
- January (1)
- 2015
- December (1)
- October (1)
- September (2)
- June (1)
- May (2)
- April (2)
- March (3)
- February (1)
- January (3)
- 2014
- December (2)
- October (2)
- September (2)
- August (3)
- July (2)
- June (2)
- May (2)
- April (9)
- March (2)
- February (2)
- January (1)
- 2013
- December (5)
- October (3)
- September (3)
- August (1)
- July (1)
- May (4)
- April (4)
- March (7)
- February (1)
- January (2)
- 2012
- December (2)
- November (6)
- October (2)
- September (3)
- August (7)
- July (2)
- June (1)
- May (3)
- April (1)
- March (2)
- February (1)
- 2011
- November (1)
- October (1)
- September (4)
- August (2)
- July (4)
- June (3)
- May (4)
- April (9)
- March (5)
- February (6)
- January (3)
- 2010
- December (3)
- November (6)
- October (3)
- September (1)
- August (5)
- July (1)
- June (4)
- May (1)
- April (2)
- March (2)
- February (4)
- January (2)
- 2009
- November (1)
- October (2)
- September (6)
- August (4)
- July (4)
- June (3)
- May (5)
- April (5)
- March (3)
- February (1)
- 2008
- 2005
- October (1)
- My blog
- Post new blog entry
- All blogs
Issue 2131: another big event class
INTRODUCTION
In RT ticket 2131, we have found that there appear to be a new class of events which were initially crashing production chains, and are still causing them to be very slow even after fixing the issue which caused the crashing. I observed events which took a few hours to process.
_______
SOLUTION
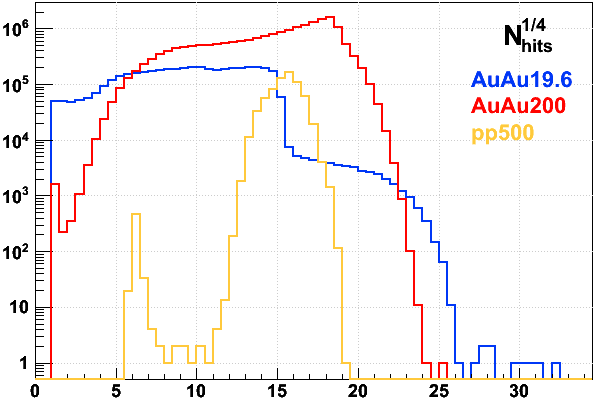
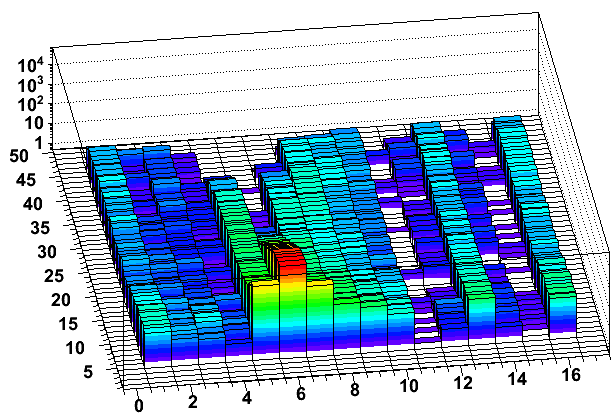
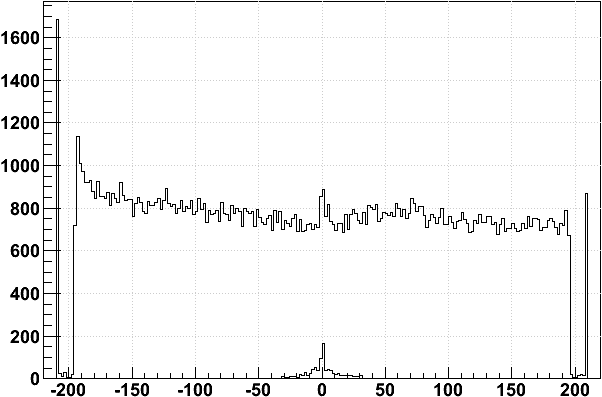
Hit counts are high enough that we can used the previously set up event skipping mechanism (using the Calibrations_tracker / tpcMaxHits database table). Here are the Nhit1/4 distributions from Run 11's FastOffline logs so far:
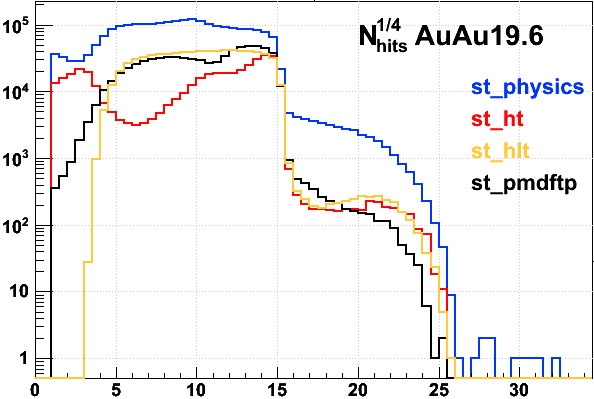
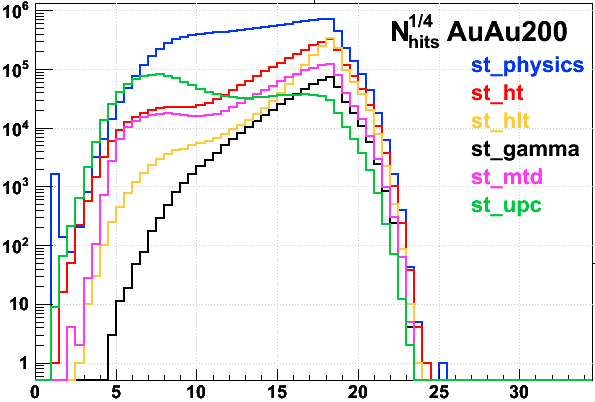
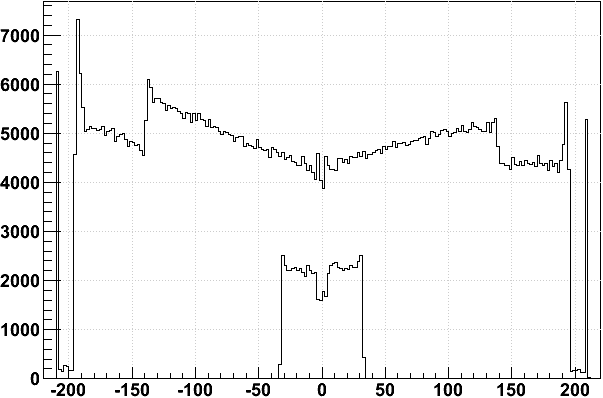
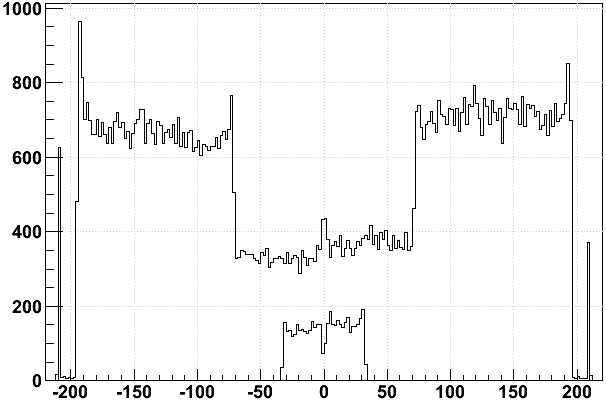
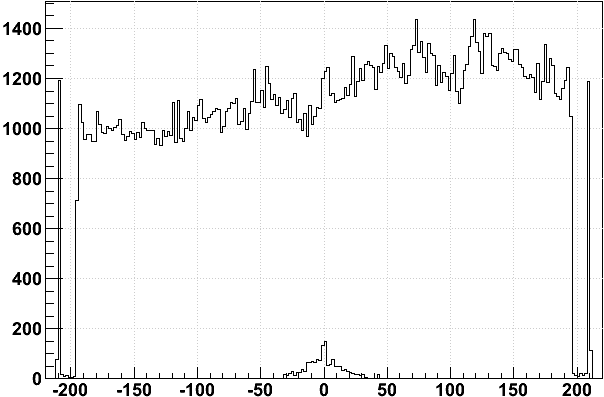
Here are the breakdown of AuAu19.6 and AuAu200 by file stream (pp500 is only st_physics in the above plot, and I suspect the events near 6 or 7 are interleaved laser triggers):
The grass above 26 (about 0.5M TPC hits) in the AuAu19.6 data is worth cutting off. It's pretty clear that the standard physics distribution cuts off around 15, and some other class of events exists between 15 and 26 (probably upstream beam-beampipe events), but the grass above 26 is in a league of its own. I will set the event skipping mechanism to skip for events at 0.6M TPC hits (25k per sector, Nhits1/4=27.8) and above. This is in the DB as of 2011-06-09, with the limit raised again for the Run 11 AuAu200 operation.
________________________________________
STUDYING THE BIG EVENTS
Regardless, it's worth understanding something about these events to see whether it's really OK to skip them. Let's start with an event display image of one such event:
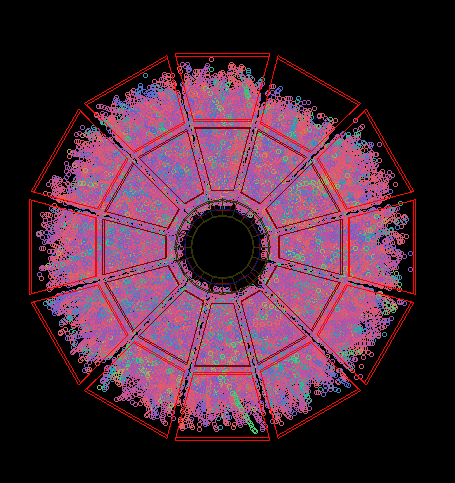
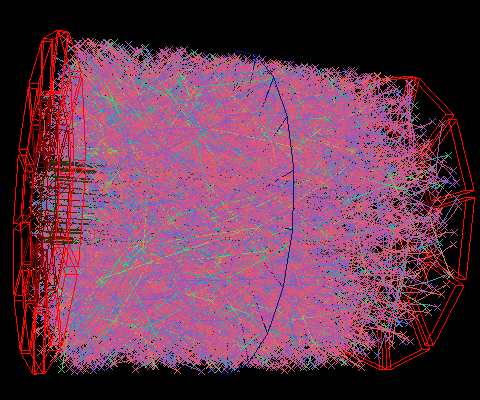
The event looks like nothing discernible to the eye. I have even tried to plot portions of the TPC, looking for track patterns in the hit distributions, and I cannot see tracks. It also seems that these events don't necessarily find any primary vertices. It is very unlikely that these events are physics of interest (and big splash events from real 19.6 GeV AuAu collisions would be very interesting).
If the events showed only odd characteristics in the TPC, I would even wonder if they were not simply some odd occurrence in the TPC readout. At least one piece of evidence that this is due to some real physical occurrence is that the following messages also show up when reconstructing these events:
(root4star): ERROR: .sl53_gcc432/OBJ/StRoot/RTS/src/DAQ_TOF/daq_tof.cxx [line 135]: TOF: Huge event in RDO 2: 20216 words -- clipping to 12000 words
(root4star): ERROR: .sl53_gcc432/OBJ/StRoot/RTS/src/DAQ_TOF/daq_tof.cxx [line 135]: TOF: Huge event in RDO 3: 12001 words -- clipping to 12000 words
(root4star): ERROR: .sl53_gcc432/OBJ/StRoot/RTS/src/DAQ_TOF/daq_tof.cxx [line 135]: TOF: Huge event in RDO 4: 19372 words -- clipping to 12000 words
So the TOF appears to be getting pummeled too.
_____
TPC TRACKS
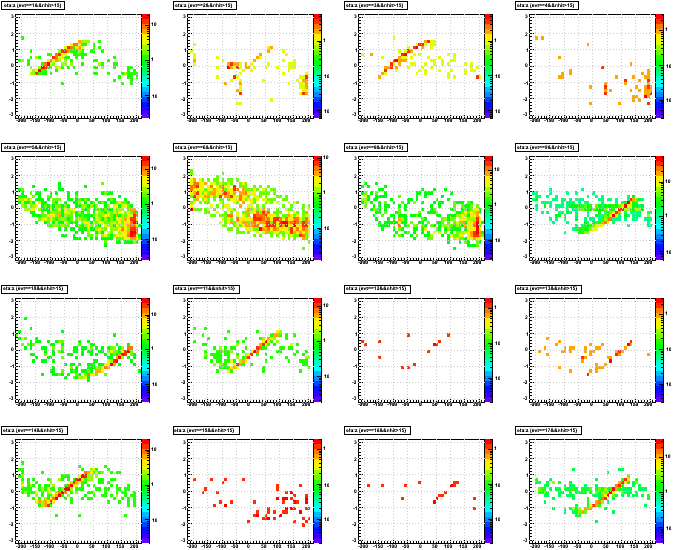
Here is the distribution and profile of "Nhits on globals" for a series of about 20 events surrounding one of these special events:
Here it is clear that while one event is particularly high in track count, there are three consecutive events in the file showing anomalous behavior. This is a phenomenon which has a duration and is not a single event issue. Restricting to tracks with more than 15 hits, to try to see real tracks, next is global track eta vs. z of first hit. A feature in real collisions of interest is that the distribution of tracks forms a notable curve in this space whose position depends on the location of the primary vertex. The big event and its neighbors do not show this, and the neighboring events instead show these tracks originating at the positive z end (perhaps even the event two before the big one). Not sure what to make of the big one.
Otherwise, there was little about the track distributions en masse to indicate anything particularly unusual about these events.
_____
TPC HITS
Moving forward, I tried to explore characteristics of the TPC hits. The first thing I faced was that there existed a variety of odd TPC hits in the StEvent hit collection, which seemed to be common in the big event perhaps simply due to statistics (these odd hits did occasionally appear in other events). This led me to an aside on studying and excluding these odd hits, which I'll include in a separate section below.
One thing that stands out is the z distribution of TPC hits. Here are the three neighboring events of interest (big one in the middle), where I have shown hits that reconstruct at the wrong z for their sector as a separate distribution (shows up between ±35 in z):
These compare to the sum of all other events in this small sample I studied:
The steps are a clear signature of pile-up. The big event shows a step at ±140, which is consistent with a pile-up event coming ~120 bunch crossings (a full RHIC turn) after the trigger. The same post-trigger pile-up shows up in the wrong-z hits due to readout of the TPC past its standard drift. The event in the file after the big one shows both pre-trigger pile-up (the reverse step at ±70, again roughly consistent with a full RHIC turn earlier) and post-trigger pile-up (the wrong-z hits), though I'm surprised I don't see a step due to the post-trigger pile-up (open question). The event in the file before the big one doesn't look particularly odd: it's difficult to make anything of the small asymmetries when the rest of the collisions in this sample also show some asymmetry (likely related to position of the primary vertex).
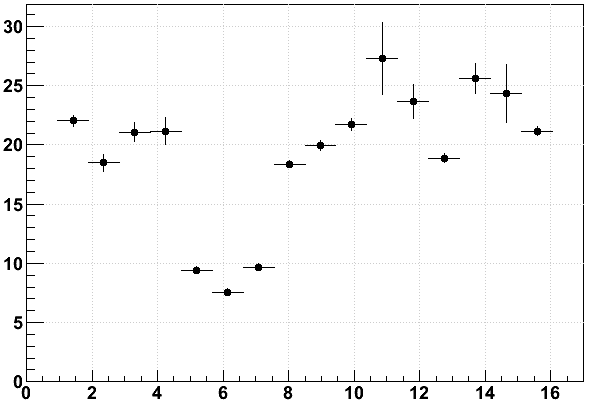
Looking through the properties of the hits, about the only other thing that stands out about hits in these events is that they seem to have a mildly high mean number of time buckets per hit, and even higher mean charge (q) per hit. Here are <time buckets>, <q>, and <q x time buckets> vs. events:
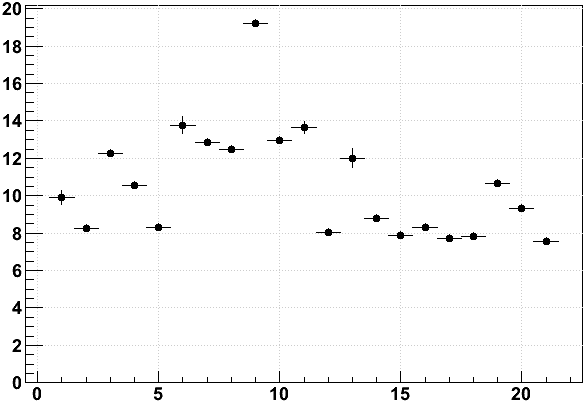
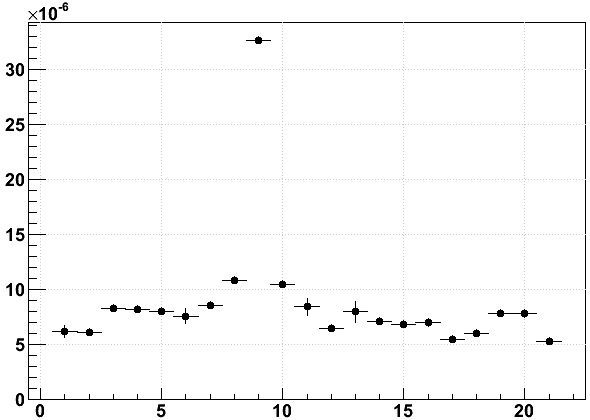
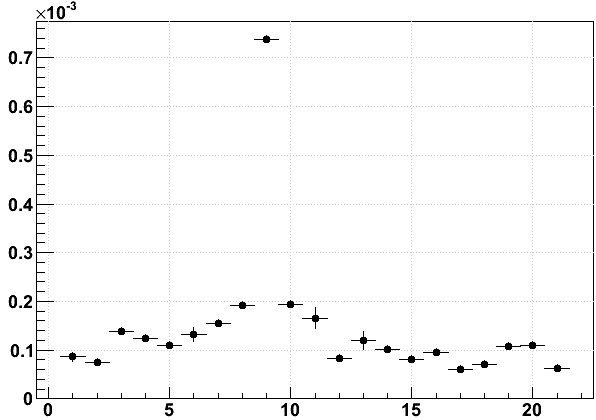
The longer time bucket extent is probably an indication that the incoming particle trajectories are more horizontal. That would also increase the charge per hit, as might overlapping hits due to pile-up. In the future, we could consider using this quantity as a secondary means of identifying bad events when the Nhit/sector limit might cut into physics data, but it would need further study to be certain that no physics events of interest would also have such high <q x time buckets>.
________
MY CONCLUSION: a collider bunch (or group of neighboring bunches) is deviating enough to spend several collider cycles scraping the beampipe wall somewhere upstream of STAR, delivering a slew of crap into STAR (perhaps hundreds of beam Au ions colliding with each cycle). Not of interest.
________________________________________
ODD TPC HIT CLASSES
I documented these in an email to the startpc-hn list. These hits were generally not being flagged in any way that excluded them from tracking (only the FCF_CHOPPED flag did so), and there generally was no pattern to the flags as far as I could tell (except for Type E). I have proposed flagging these hits so that they are excluded from tracking.
In testing this exclusion, I have found that track reconstruction speed improves greatly for these events! Here is a table of information about this test group of events and the results of exclusion:
| Event | No exclusion | Exclusion | ||||
|---|---|---|---|---|---|---|
| Nhits | Nglobs | CPU Time: nodes A,A,B | Nhits | Nglobs | CPU Time: node A,A,B | |
| 1 † | 221 | 2 | 29.69 , 31.18 , 28.87 | 221 | 2 | 28.67 , 28.95 , 29.15 |
| 2 | 21835 | 721 | 9.58 , 9.74 , 9.44 | 21832 | 721 | 9.62 , 9.69 , 9.75 |
| 3 | 9078 | 222 | 2.27 , 2.40 , 2.25 | 9078 | 222 | 2.31 , 2.33 , 2.35 |
| 4 | 8583 | 234 | 2.67 , 2.82 , 2.64 | 8582 | 234 | 2.72 , 2.72 , 2.73 |
| 5 | 8222 | 270 | 3.12 , 3.33 , 3.12 | 8222 | 270 | 3.19 , 3.19 , 3.20 |
| 6 | 283 | 6 | 0.33 , 0.33 , 0.33 | 282 | 6 | 0.32 , 0.32 , 0.33 |
| 7 | 6288 | 108 | 2.46 , 2.56 , 2.44 | 6288 | 108 | 2.49 , 2.51 , 2.50 |
| 8 | 155093 | 7742 | 64.09 , 65.10 , 63.50 | 155005 | 7748 | 65.03 , 65.10 , 65.51 |
| 9 | 1033088 | 96212 | 7575.63 , 7593.09 , 7518.95 | 1030910 | 96170 | 1938.62 , 1944.43 , 1948.57 |
| 10 | 116988 | 4892 | 40.81 , 41.16 , 40.32 | 116924 | 4887 | 41.59 , 41.49 , 41.65 |
| 11 | 455 | 8 | 0.40 , 0.41 , 0.39 | 455 | 8 | 0.40 , 0.40 , 0.41 |
| 12 | 51623 | 1889 | 24.02 , 24.56 , 23.86 | 51612 | 1889 | 24.47 , 24.43 , 24.51 |
| 13 | 128 | 3 | 0.32 , 0.33 , 0.32 | 128 | 3 | 0.32 , 0.32 , 0.31 |
| 14 | 32064 | 1016 | 13.38 , 13.69 , 13.28 | 32060 | 1016 | 13.64 , 13.68 , 13.68 |
| 15 | 16903 | 577 | 7.66 , 7.78 , 7.62 | 16902 | 577 | 7.80 , 7.77 , 7.81 |
| 16 | 865 | 20 | 0.62 , 0.62 , 0.61 | 865 | 20 | 0.62 , 0.63 , 0.63 |
| 17 | 3033 | 90 | 1.47 , 1.50 , 1.47 | 3033 | 90 | 1.50 , 1.49 , 1.50 |
| 18 | 30546 | 1119 | 17.12 , 17.52 , 16.97 | 30541 | 1118 | 17.36 , 17.34 , 17.40 |
| 19 | 4409 | 99 | 1.59 , 1.60 , 1.59 | 4409 | 99 | 1.64 , 1.62 , 1.62 |
| 20 | 1283 | 29 | 0.70 , 0.71 , 0.70 | 1283 | 29 | 0.70 , 0.71 , 0.72 |
| 21 | 30593 | 1019 | 13.40 , 13.62 , 13.26 | 30593 | 1019 | 13.61 , 13.60 , 13.64 |
(† the first event shows the usual additional CPU time needed at initialization)
The numbers are quite steady, even across a couple nodes I tried and multiple passes. Most events don't lose any hits for tracking due to the exclusion, and even if a few hits are lost, the number of globals is pretty steady. The only number which seems to be notably different is the amount of time spent on the biggest event (highlighted in red). Even the neighboring events, which seem to be a part of the same phenomenon, appear to change very little (highlighted in orange). So, excluding these hits from tracking makes a significant difference (0.5 hours instead of 2 hours on the big event), but we will probably be skipping such big events anyhow. Where this could play a role is similarly big events, but with low enough Nhit to pass the tpcMaxHits cut.
________________________________________
-Gene
Groups:
- genevb's blog
- Login or register to post comments