RT Ticket 2099
This is regarding RT ticket 2099.
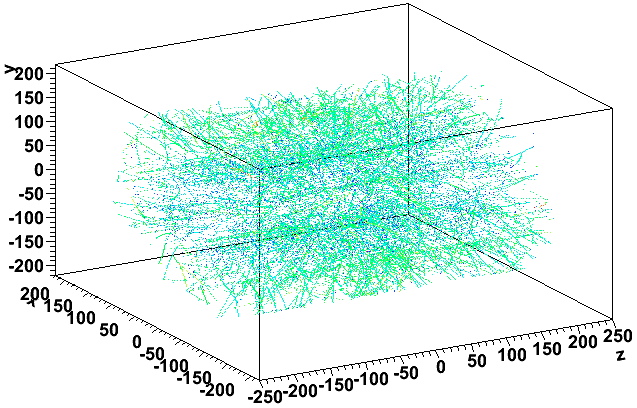
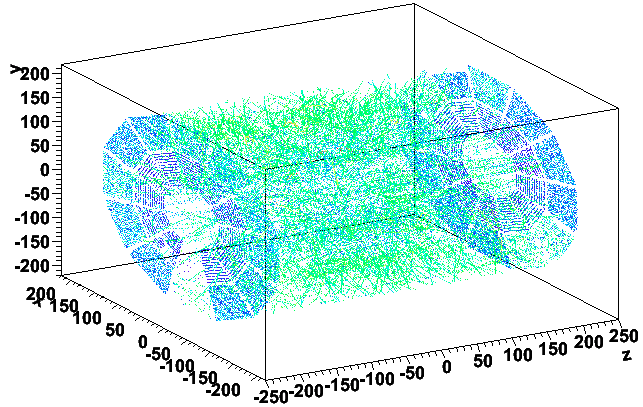
I looked at the 5425th event (id=27523) in the file st_tofcosmic_12042061_raw_1010001 (this is a zero luminosity cosmic ray run; ZDC coincidence rate was zero and the singles rates were < 3 Hz). Here is what the hits (before merging) look like in the TPC for this event (first plot) and for the sum of 15 events nearby (the 7 events before it and 8 after it in the same file):
(I have made the points larger for hits with |z|<200 so that the cosmic rays show up clearly.)
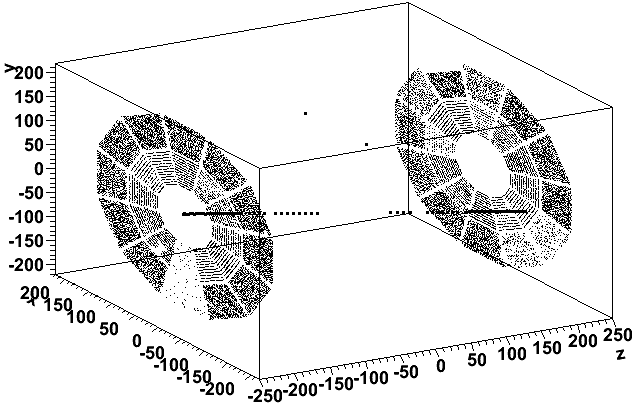
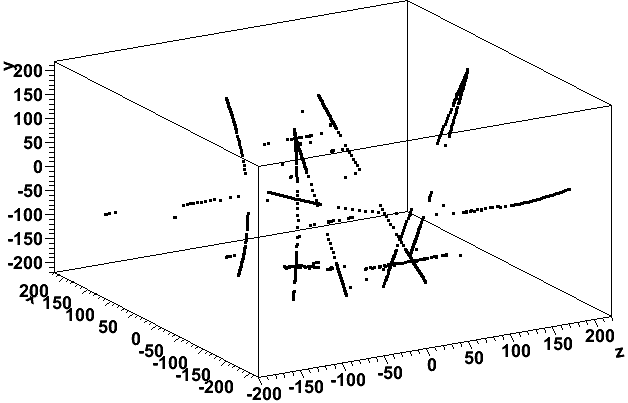
So the event in question appears to have a proper cosmic ray, but the TPC is full of hits at its endcaps. These hits are all what we call "prompt" TPC hits and all have a reconstructed z value in the range of +/- (210-212) cm.
Many of the prompt hits appear normal for number of pads in the cluster and their hit flag, but a small number of them have a cluster width spanning the entire length of the padrow (14 of the 20500 prompt hits in this event), 8 hits have a flag value of 96, and 5 hits are both.
I tried to look by eye for tracks among these prompt hits and could not determine any. It appears to be purely noise.
____________
Looking now at file st_physics_adc_12060041_raw_4510002 and the 42nd and 43rd events respectively, we see the same issue in the 43rd event:
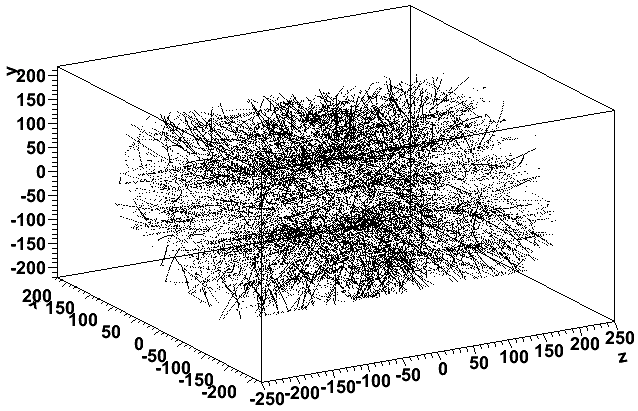
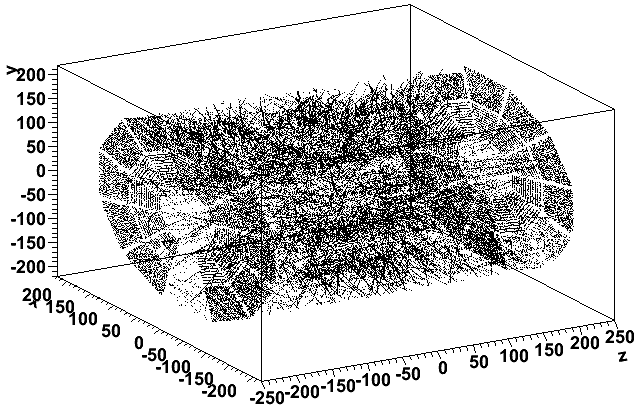
I also confirmed that the 900th event of st_physics_12060036_raw_3010001 looks just like this.
It may be worth noting that sector 18 appears to show less of an issue than any other sector, accounting for the gap at the bottom on the negative z end. There are other sector-by-sector variations too (outer part of sectors 7 and 8 on the west are a bit sparse too), so the effect seems slightly different for different sectors.
____________
Update for energy/charge of clusters:
StTpcHit::charge() returns q as calculated in StTpcHitMaker:
StTpcHit *StTpcHitMaker::CreateTpcHit(const daq_cld &cluster, Int_t sector, Int_t row) {
  // Create  an instance of the StTpcHit from the tpcReader data

  Double_t gain = (row<=13) ? St_tss_tssparC::instance()->gain_in() : St_tss_tssparC::instance()->gain_out();
  Double_t wire_coupling = (row<=13) ? St_tss_tssparC::instance()->wire_coupling_in() :
                                       St_tss_tssparC::instance()->wire_coupling_out();
  Double_t q = cluster.charge * ((Double_t)St_tss_tssparC::instance()->ave_ion_pot() *
				   (Double_t)St_tss_tssparC::instance()->scale())/(gain*wire_coupling) ;
Here are the same as the previous two plots, but the color is represented by log10(q) (blue is lower charge, green is intermediate, and red is high charge):
This demonstrates that these prompt hits are pretty low in charge. To be more quantitative, here's log10(q) vs. reconstructed z for the good 42nd and bad 43rd events:
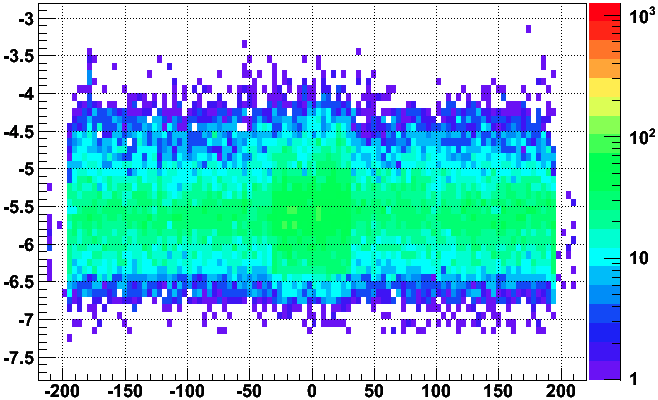
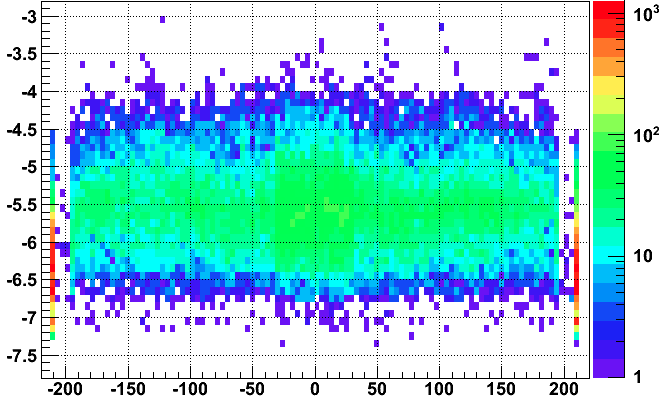
Note that even in good events, there are prompt hits with log10(q) in the range [-6.6,-5.2], and it's not clear from just this plot if the bad event has even lower q than usual for prompt hits. So here I just plot the log10(q) of prompt hits from the bad event (red) and 15 good events summed (blue) in the first plot, and then the non prompt hits from the bad event (red) and one good event (blue) in the second plot:
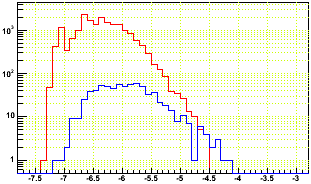
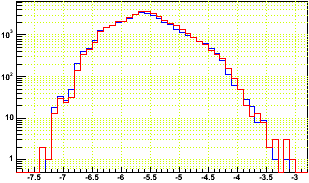
This makes it clear that the bad event's prompt hits do have a bit lower than normal charge for prompt hits. It is also worth noting that the rest of the event appears to have a somewhat typical charge distribution (whatever the issue, it isn't something grossly wrong for the whole event).
____________
Update for time bin of clusters
Again StTpcHit, here are the distributions of mean time bin, width in time bins, minimum time bin, and maximum time bin, where red is for the prompt hits from the bad event, and blue is prompt hits summed from 50 other events (more than I was using before):
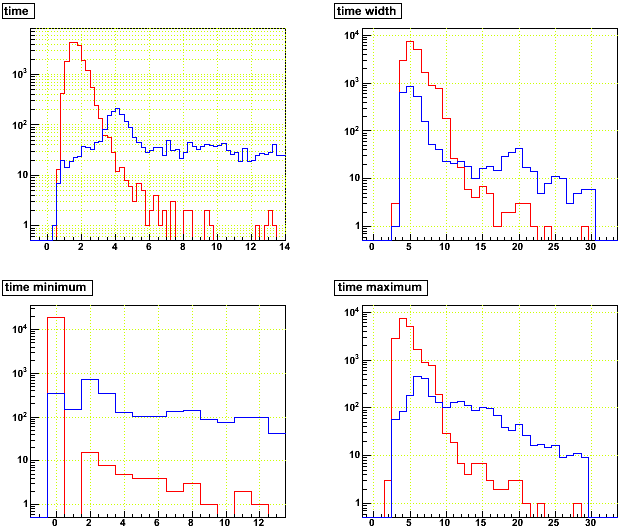
So the prompt hits in the bad event do actually arrive earlier in time than normal prompt hits, and they dominantly start at time bin 0. This would likely be part of the signature for such events if we were to skip them.
_____________
Update for frequency of occurrence
I looked through log files from FastOffline and determined some fairly accurate cuts on time per event spent processing files to determine how many events were causing production to hang. I found three different streams of data which had been produced in the last couple weeks (older logs are not kept on disk). Here is the resulting frequency of occurrence (the rate of events which are bad) vs. day (determined from the run numbers), to elicit the order of magnitude of the problem, and whether it appears to be changing with time:
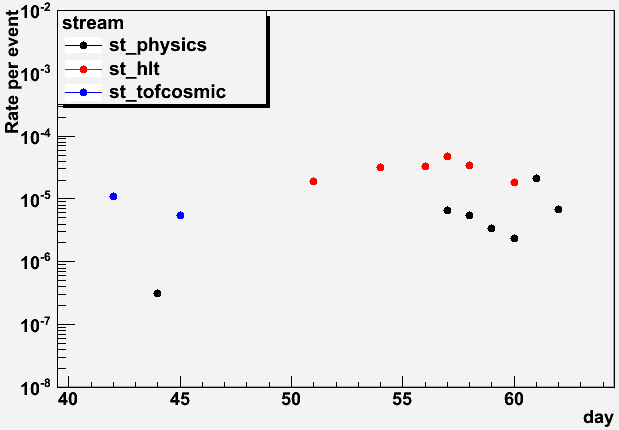
It looks like the rate is approximately 10-5 (one per 100k events) and shows no clear trends with time. We are storing up to 20k (~104) events per file, so that could mean that something on the order of 10% of files could have a problem when going through the full production. For FastOffline, we are limiting the processes to 1k (103) events per file, so something like 1% or less of the jobs are being impacted.
___________
-Gene
- genevb's blog
- Login or register to post comments