RT Ticket 2103
For RT ticket 2103, we wanted to see the impact due to changes in TPC hit errors which were made in January 2010 (the difference in errors is demonstrated here). I processed 10,471 events from about a dozen st_W files from days 101-103 of Run 9 using the old hit errors and new hit errors (where new is those inserted in January 2010) using SL10j modified to have the curvature limit set to 1e-9 (see RT ticket 2098) so that more high pT tracks would be reconstructed. I then ran track matching code between the two sets of reconstructed data requiring for a match:
- Same event
- |Δη| < 0.1
- |Δzproj| < 10 cm
- |ΔΨproj| < 10 °
...where zproj is the z coordinate of the track projection's closest approach to the z axis, and Ψproj is the azimuthal direction of the momentum vector at that point.
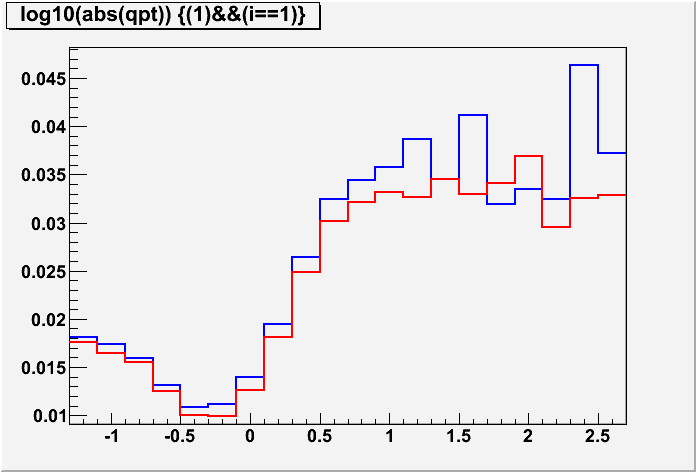
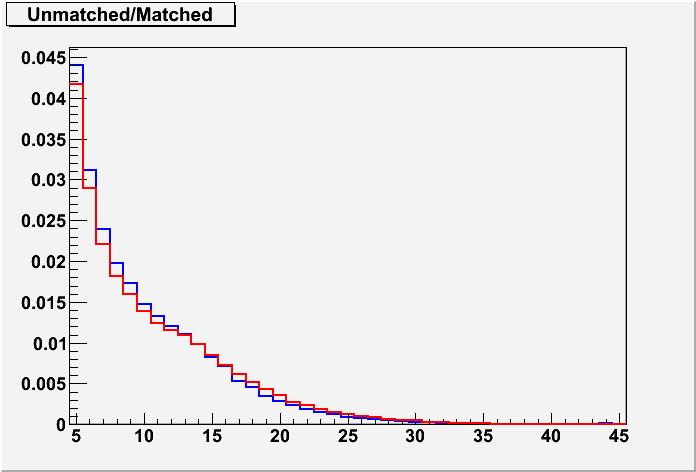
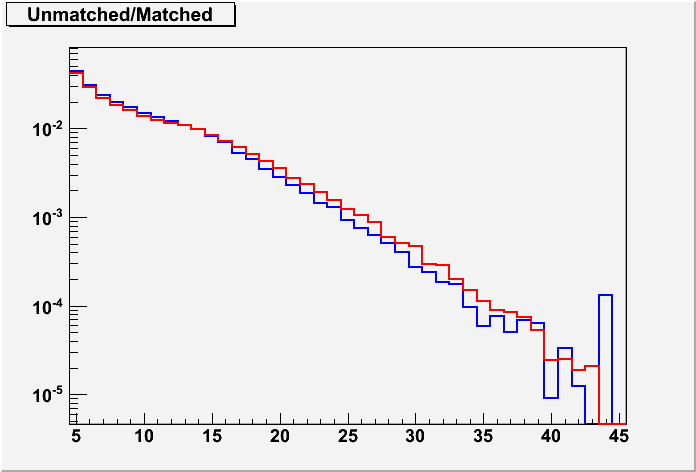
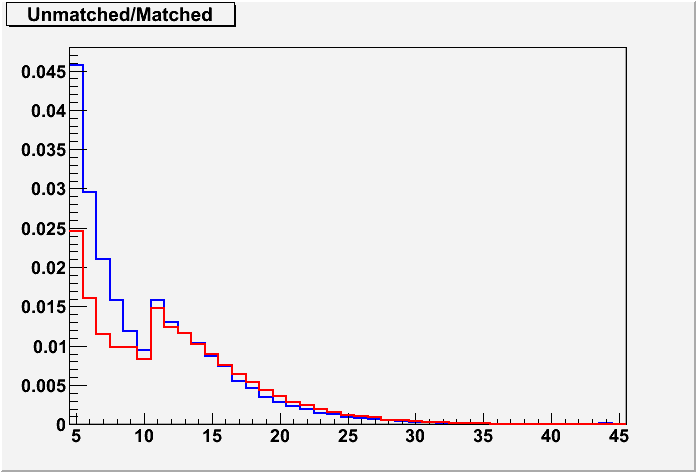
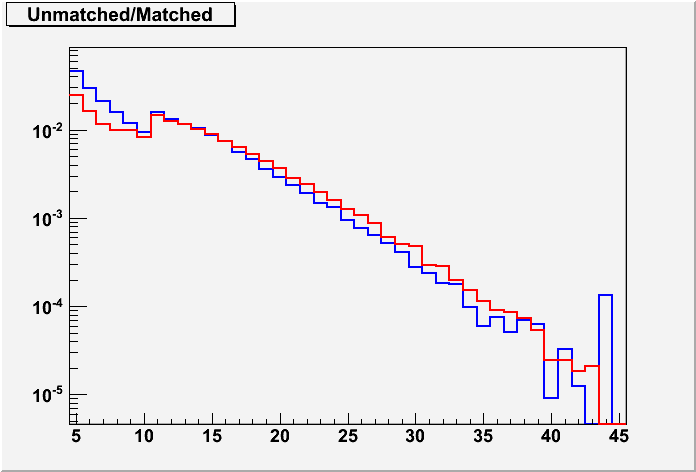
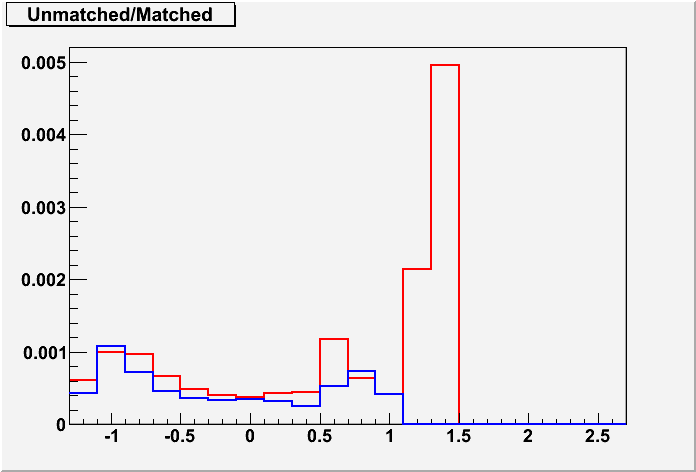
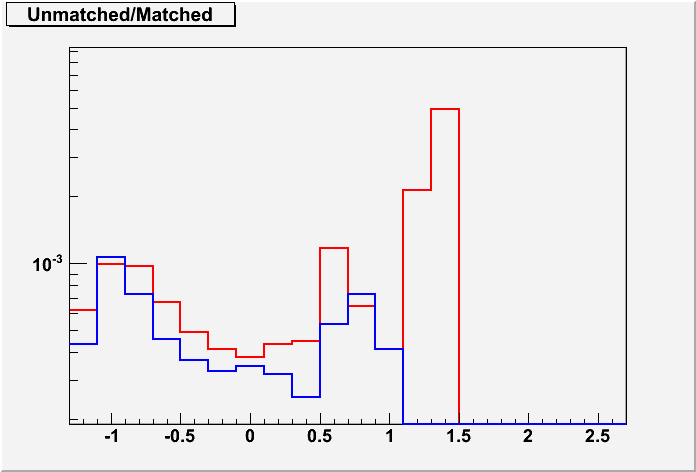
Shown below are plots of global tracks found in one production but not the other ("unmatched"), divided by the tracks found in both productions ("matched"), e.g 1.0 does not mean all tracks are lost, just that the number matched and unmatched is equal. Red is for those found only using the old errors, blue is for those found only using the new errors. Some plots are title "Unmatched/Matched" and others aren't, but that is what they all are.
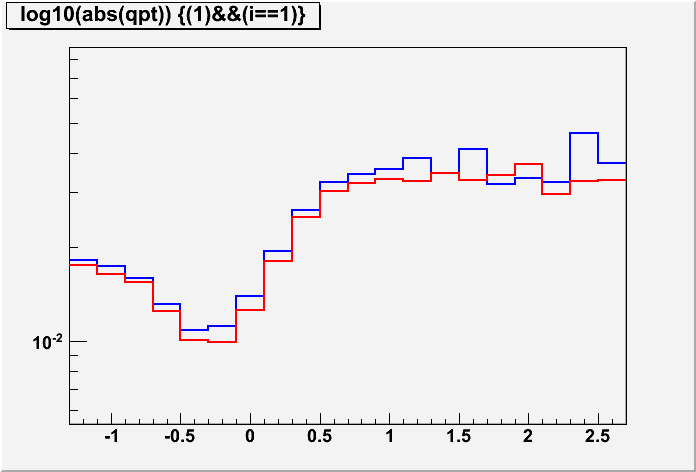
Each plot is shown in a pair of linear (left) and logarithmic (right) versions to help make details clearer.
A summary is at the bottom. It should be understood that this particular study does not clarify whether some tracks may have notable changes in pT as it doesn't take much of a change in curvature to significantly change the pT of a high pT track. Nor does it evaluate the nearly 1M tracks whose flag went from <0 to >0, nor the other nearly 1M whose flag went from >0 to <0.
Statistics:
Matched tracks: 47038275 (47M); 26466164 with both flag>0 (26M)
Unmatched from old errors: 659610 (660k), 134292 with flag>0 (134k)
Unmatched from new errors: 695900 (696k), 147745 with flag>0 (148k)
__________________________________
vs. log10(pT) of all tracks:
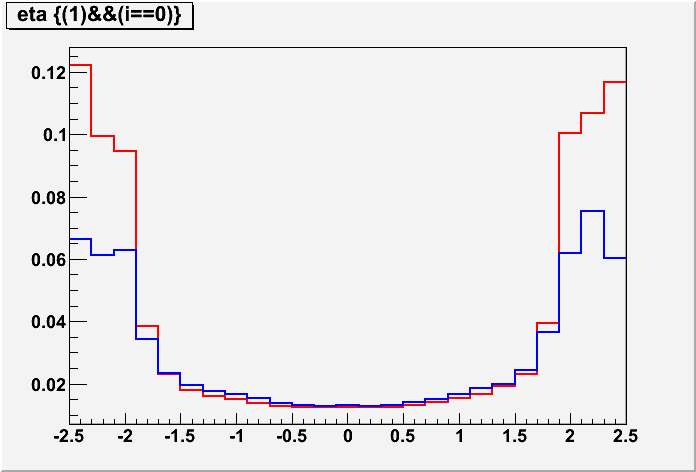
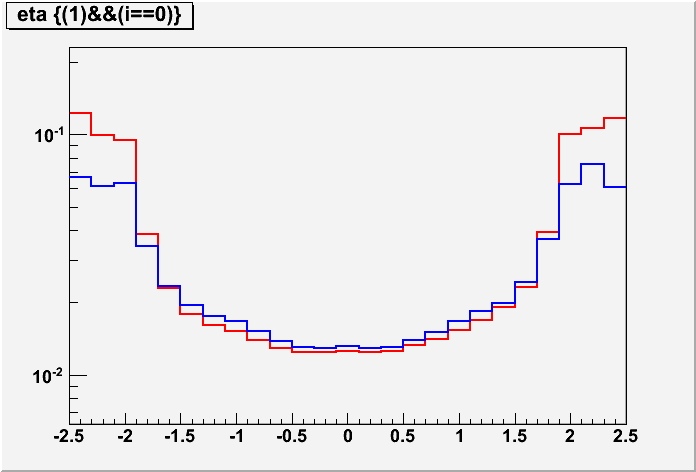
vs. eta of all tracks:
vs. Nhit of all tracks:
__________________________________
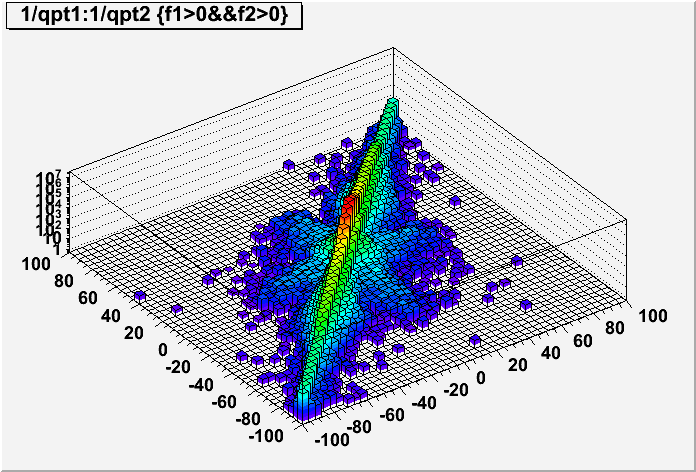
From the above plots, it looks like this is at worst an issue at the level of a few percent at high pT. Certainly I have matched more tracks than really should be matched, as evidenced by the "plus" feature visible in this q/pT vs q/pT plot for the matched tracks (the axes on this plot extend to pT of 10 MeV/c, which I think may be the lower bound of our tracking). The right plot shows the clean-up after requiring all tracks to have flag>0. This doesn't remove the entire background, but most of it. Note that this does not shift these tracks into the "unmatched" category, so they would require separate evaluation.
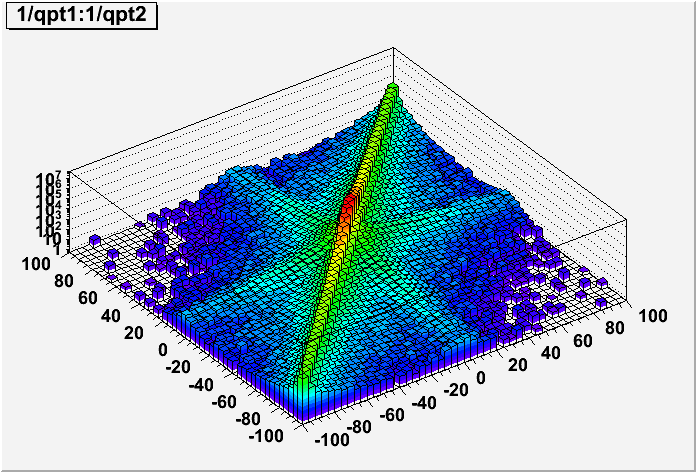
Side note: I have zoomed in and there is no gap in these plots near (0,0). This indicates that the changing of these hit errors clearly allows some high pT tracks to change charge sign smoothly across infinite pT.
There is also the issue of tracks which should be matched but aren't. I expect this happens at a small level, but I haven't tried to quantify it. Such tracks would appear in both unmatched sets, and could be responsible for making the blue and red curves a little more similar than they should be.
Moving forward with excluding tracks with a negative flag value...
vs. log10(pT) of flag>0 tracks:
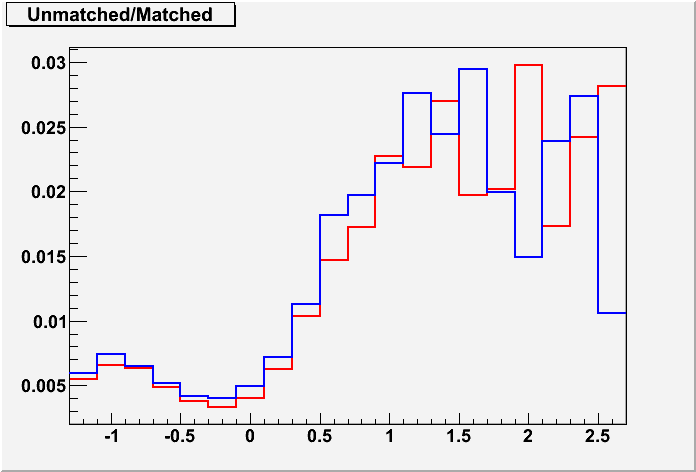
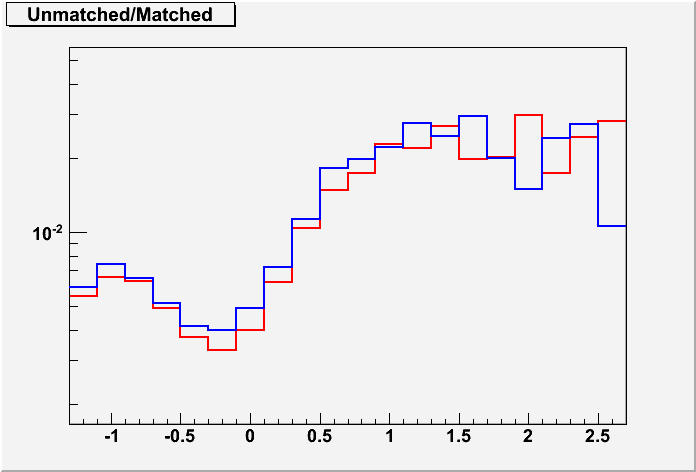
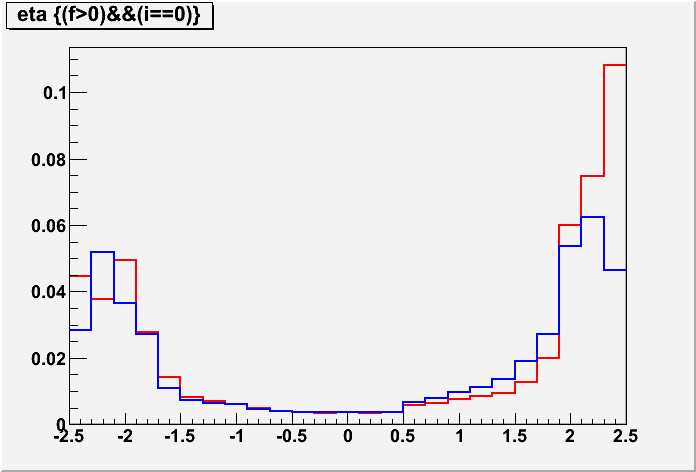
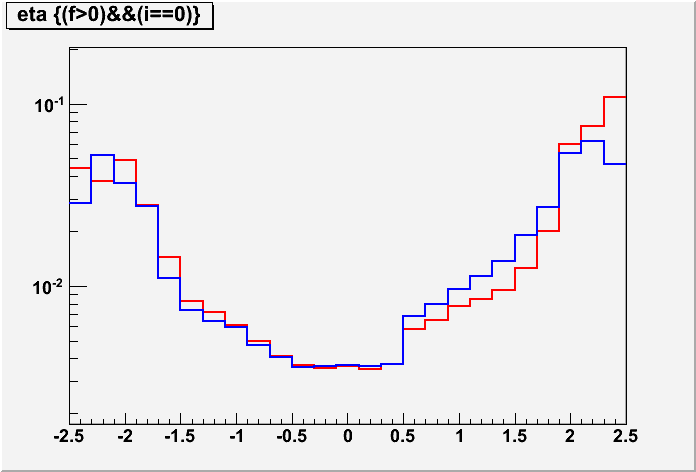
vs. eta of flag>0 tracks:
vs. Nhit of flag>0 tracks:
__________________________________
The flag cut brought the fraction down a little.
One thing I noted is that there are clearly some tracks which are the same, but are failing my track matching criteria. This can be seen by the band of matched tracks
We can see that very short tracks are the most volatile for being either lost or difficult to match between the two productions, which makes good sense, and it is best to avoid split tracks anyhow, so the following plots will start cutting on at least 23 hit points...
vs. log10(pT) of flag>0, Nhit>22 tracks:
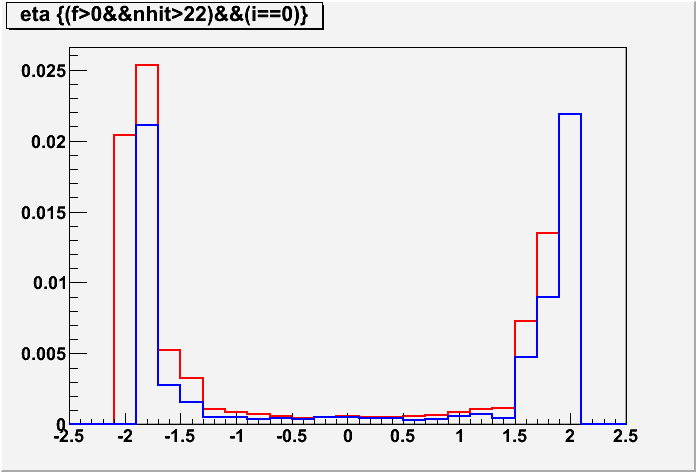
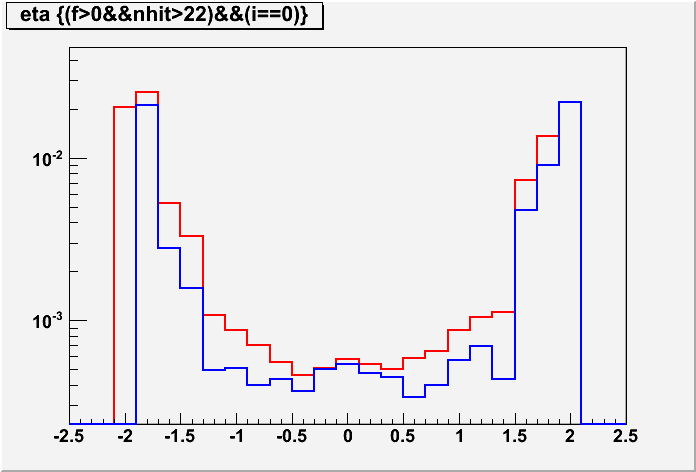
vs. eta of flag>0, Nhit>22 tracks:
__________________________________
The cut on number of hit points took a big bite out of the statistics, and brought the problem's level down below 1% at high pT. High pseudorapidity tracks are still quite volatile for being matched or now, and aren't of general physics interest. Cutting those out...
vs. log10(pT) of flag>0, Nhit>22, |η|<1.2 tracks:
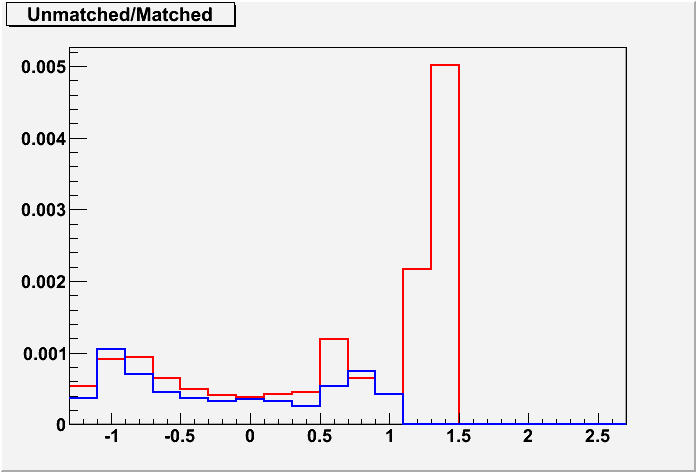
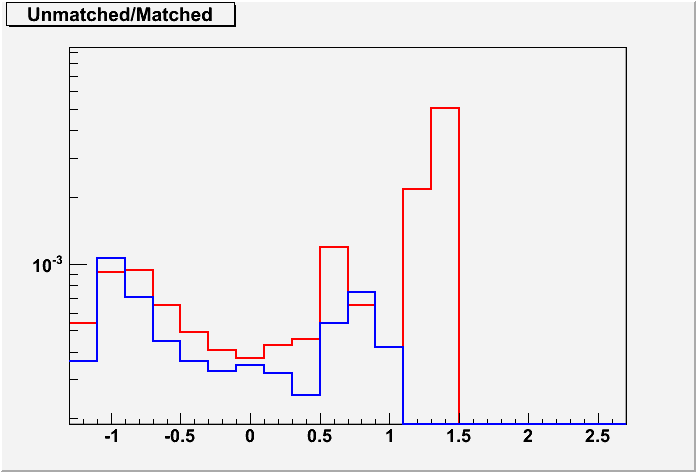
There weren't that many high pseudorapidity tracks anyhow, so that cut had little effect. Anyhow, for these "sweet spot" tracks, we see that the effect is on the order of 0.1% or less for most pT. There's a hint that the fraction increases at pT above 10 GeV/c, but even up to ~30 GeV/c it is still less than 1%.
Summary: The effect of changing hit errors is to lose primarily short, high-pT, high-η global tracks. Such tracks are generally lost from both of the track distributions, but it would be fair to say that more tracks are found using the old errors, particularly in the 0.5 < |η| < 1.2 range. At the extremes, these losses are around 10% or less, but are generally smaller than that. The losses also diminish for tighter quality cuts down to the sub-1% level.
_________
-Gene
- genevb's blog
- Login or register to post comments