Alignment residuals with ideal alignment vers. 2
Now that we have figured out how to do simulations without hadronic processes (i.e. only energy loss), here are some plots from simulating 0.5 GeV/c pi- using ideal geometry and large inner TPC hit errors (as we do for alignment).
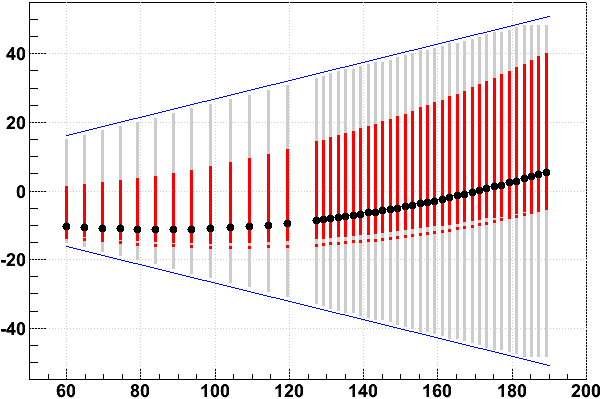
Acceptance cuts restrict to region shown in red, black points are a typical pi-, blue lines are sector boundaries:
Details: Excluding tracks which cross between sectors (definite artifacts seen there which merit a separate note), excluding tracks which cross the central membrane, requiring |η|<1 and Nhits>43).
Comments: Mix of red and gray at the bottom of the red band is because the red region is really made from tracks passing the cuts, and some tracks at the edge of the statistics become at little sparse.
Mean curvature and Pt per hit vs. local x:
Details: Curvature here is 1/(radius of curvature), and should grow with increasing radius as tracks lose energy. I also understand that curvature is based on only a small group of hits, so curvatures in distant places can be independent, while Pt is an aggregate quantity, taking into account all previous points as the fitter propagates from outside in.
Comments: Curvature behavior for outer sector looks OK, but why does curvature drop with increasing radius for inner sector? The outermost point seems to exhibit an odd behavior in the Pt plot. The points with large error bars are due to my binning: for example, I have a bin edge at 84.0, and padrow 6 hits are in the range [83.999992,84.000007]; maybe I'll adjust my bins slightly the next time I do these plots so this doesn't happen (sorry).
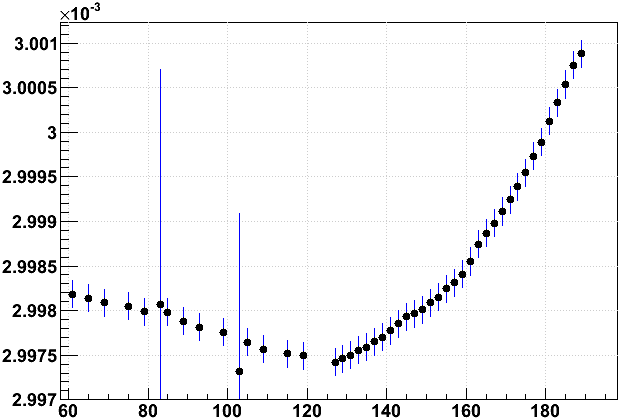
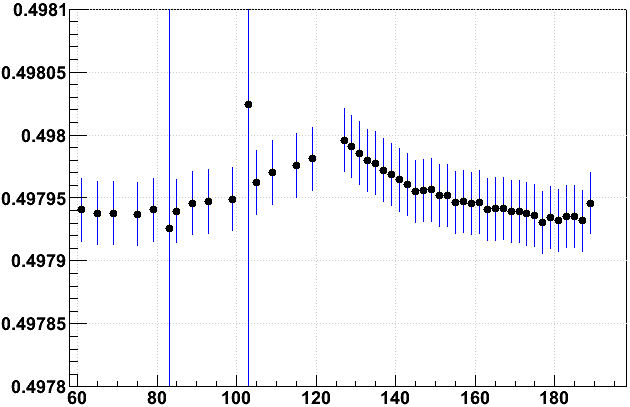
Residuals vs. local x, and their profile mean:
Comments: Again there is some issue with the outermost padrow (45). There also appears to be a kink at the innermost padrow of the outer sector (14). If this result stands, it demonstrates a bias which would affect our alignment calibration!
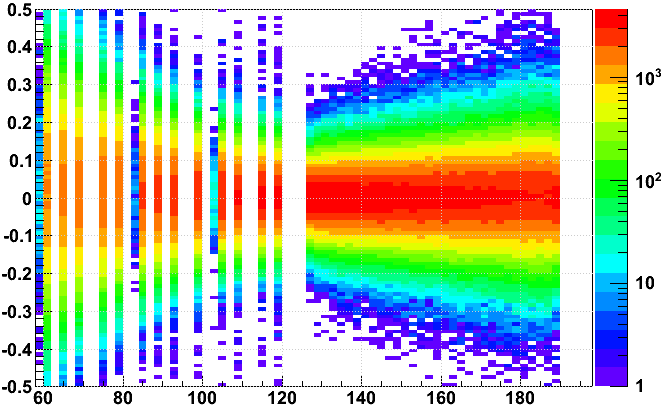
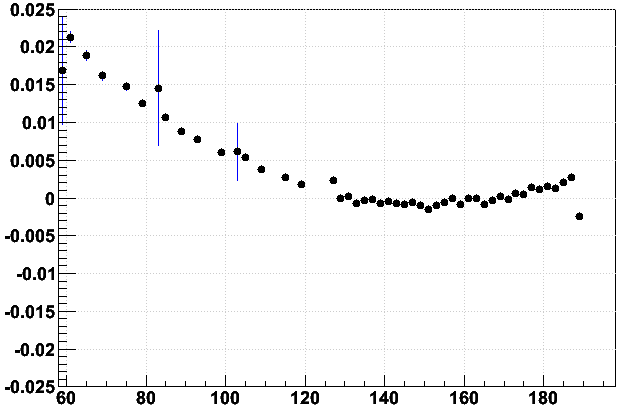
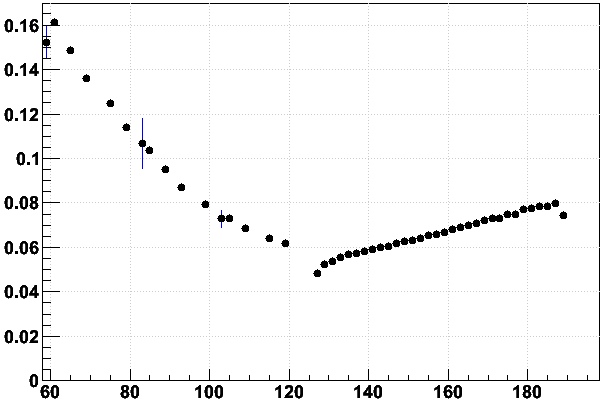
FitSlicesY() width and mean:
Comments: mean agrees with profile mean
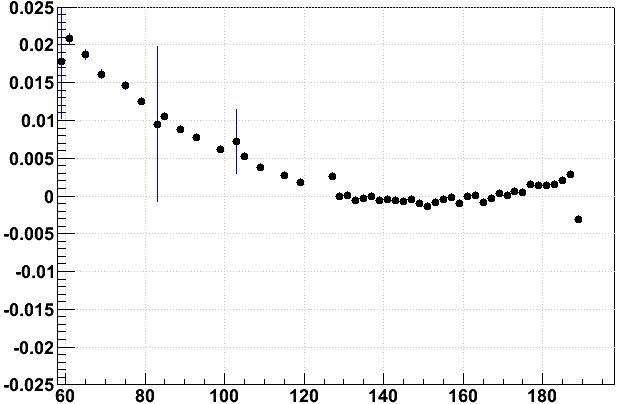
Zoom in on 2D of residuals for outmost 6 padrows (40-45):
Comments: The shift in residuals on the outermost padrow (local x = 189) looks real.
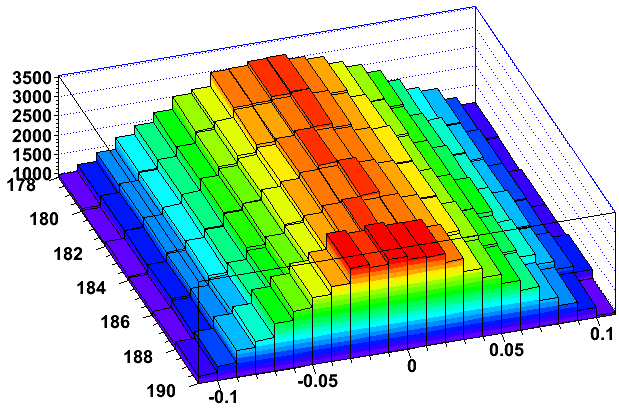
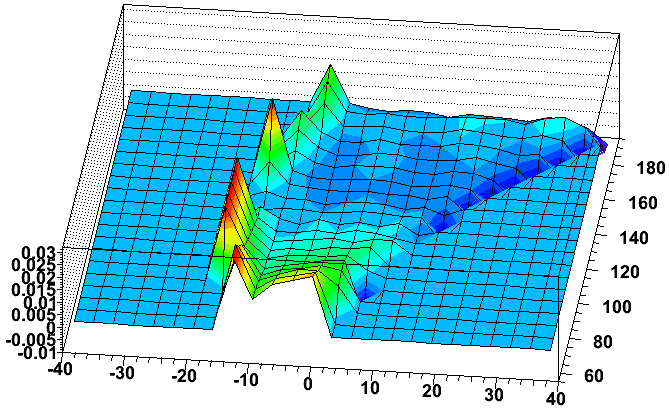
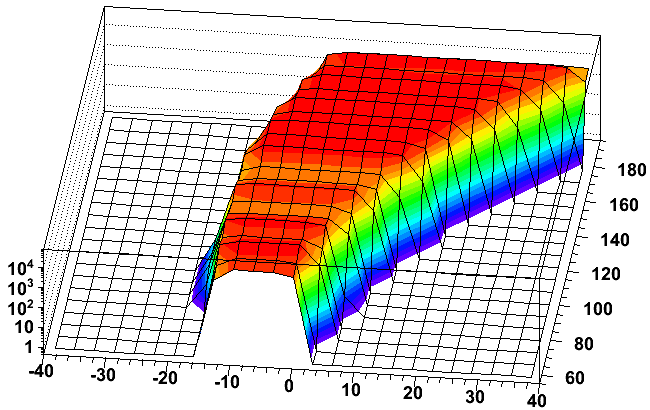
Residuals vs. local x and local y, and on the right the statistics for the left plot:
Comments: A variation in the rise of residuals at low local x over the sector face is evident. There also appear to be edge bin effects, as the troughs and crests at the edges are there even if I shrink or expand the acceptance.
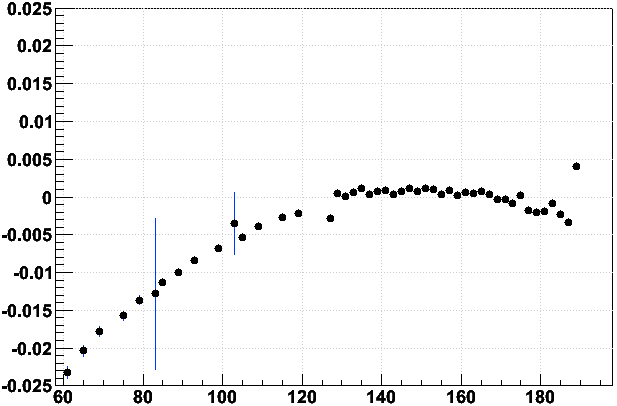
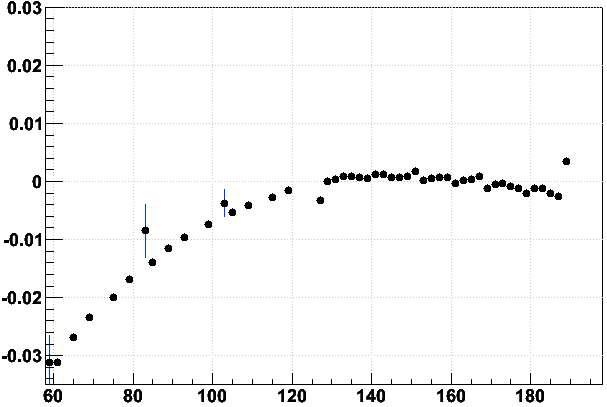
Residuals in pi+ and proton+:
Comments: Opposite charge sign flips all features, including those at the innermost and outermost padrows of the outer sector, so these effects are not shifts in the padrow positions. Protons have slightly larger residuals than pions:
-Gene
- genevb's blog
- Login or register to post comments
