- genevb's home page
- Posts
- 2025
- 2024
- 2023
- 2022
- September (1)
- 2021
- 2020
- 2019
- December (1)
- October (4)
- September (2)
- August (6)
- July (1)
- June (2)
- May (4)
- April (2)
- March (3)
- February (3)
- 2018
- 2017
- December (1)
- October (3)
- September (1)
- August (1)
- July (2)
- June (2)
- April (2)
- March (2)
- February (1)
- 2016
- November (2)
- September (1)
- August (2)
- July (1)
- June (2)
- May (2)
- April (1)
- March (5)
- February (2)
- January (1)
- 2015
- December (1)
- October (1)
- September (2)
- June (1)
- May (2)
- April (2)
- March (3)
- February (1)
- January (3)
- 2014
- December (2)
- October (2)
- September (2)
- August (3)
- July (2)
- June (2)
- May (2)
- April (9)
- March (2)
- February (2)
- January (1)
- 2013
- December (5)
- October (3)
- September (3)
- August (1)
- July (1)
- May (4)
- April (4)
- March (7)
- February (1)
- January (2)
- 2012
- December (2)
- November (6)
- October (2)
- September (3)
- August (7)
- July (2)
- June (1)
- May (3)
- April (1)
- March (2)
- February (1)
- 2011
- November (1)
- October (1)
- September (4)
- August (2)
- July (4)
- June (3)
- May (4)
- April (9)
- March (5)
- February (6)
- January (3)
- 2010
- December (3)
- November (6)
- October (3)
- September (1)
- August (5)
- July (1)
- June (4)
- May (1)
- April (2)
- March (2)
- February (4)
- January (2)
- 2009
- November (1)
- October (2)
- September (6)
- August (4)
- July (4)
- June (3)
- May (5)
- April (5)
- March (3)
- February (1)
- 2008
- 2005
- October (1)
- My blog
- Post new blog entry
- All blogs
Comments on Run 11 TPC anode current dE/dx corrections
Yi Guo presented his results on using the TPC anode currents to correct dE/dx at the Oct. 19, 2011 S&C meeting. The following comments are based on plots from that presentation as well as some additional plots he made afterwards (thank you, Yi!)...
I will start with Fig. 1, a plot of <dE/dx> vs. time during the Run 11 AuAu200 RFF data (please ignore the colors for now):
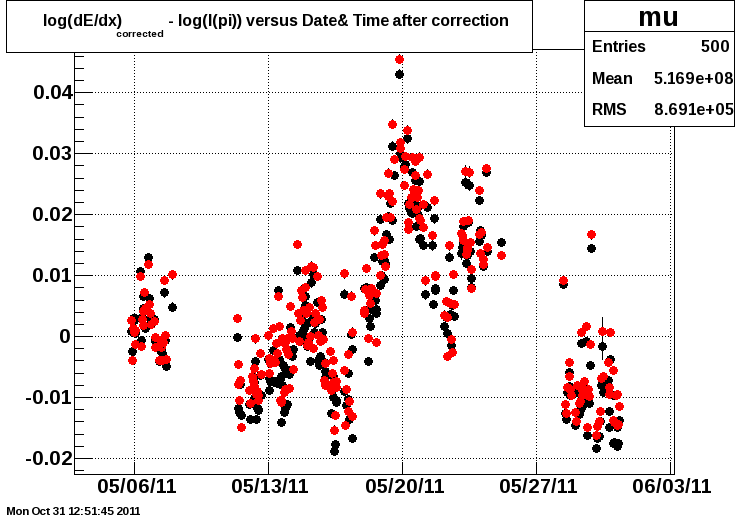
This plot demonstrates that there are un-corrected fluctuations in <dE/dx> from the expected value which reach as much as 3 or 4%. This is relevant in the context of the request which was made to the TPC group to only implement the differential anode current corrections to dE/dx if a significant improvement/benefit can be demonstrated.
The calibration was done using the anode current corrections, and here are the results:
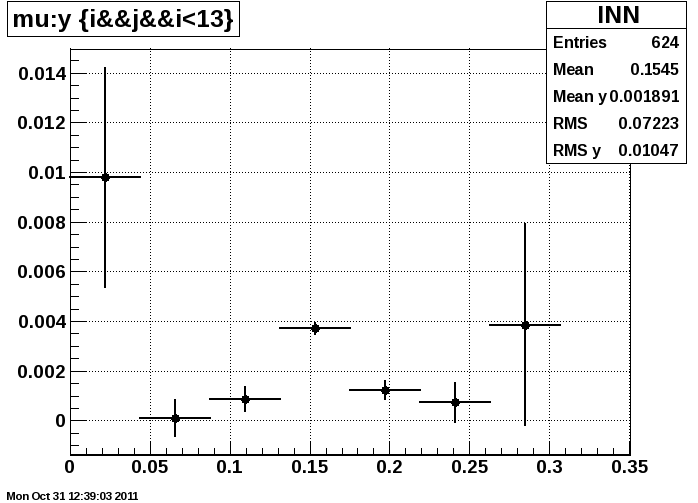
Figs. 2 & 3: <dE/dx> of hits (in fraction of the MIP peak dE/dx, e.g. 0.01 = 1%) vs. anode current for inner and outer sectors from RFF AuAu200 before corrections

Figs. 4 & 5: <dE/dx> of hits (in fraction of the MIP peak dE/dx, e.g. 0.01 = 1%) vs. anode current for inner and outer sectors from RFF AuAu200 after corrections

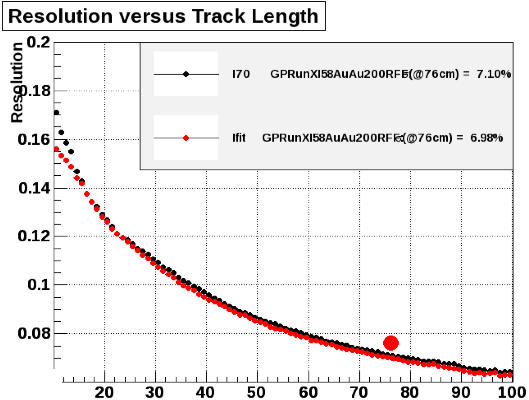
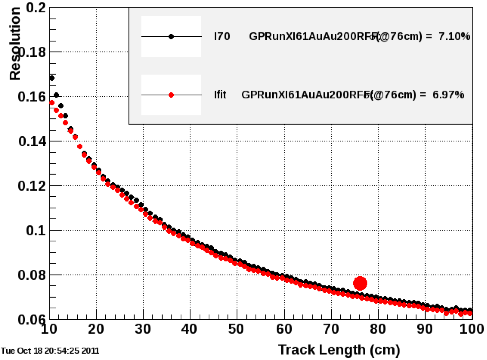
Figs. 6 & 7: Resolution of dE/dx of tracks (in fraction of the MIP peak dE/dx) vs. track length without (top) and with (bottom) anode current corrections. According to Yi Guo, these plots sample the range of TPC anode currents (i.e. they are not from a single run taken at a single anode current).
The following three questions remain:
(1) How is it possible that the variance in <dE/dx> does not more greatly affect the dE/dx resolution, going from Fig. 6 to Fig. 7?
(2) Even if the resolution isn't affected much for the bulk of the data, do we need to worry about the extremes of the current where there is the largest difference in <dE/dx>?
(3) Why is the anode current dependence not seen for FF data?
From discussions with Yuri and Yi Guo, I think the answers lie in the following points:
- The dE/dx of tracks is dominated by the dE/dx measurements of outer TPC hits.
- Outer TPC <dE/dx> varies less than inner TPC because there is less current drawn in the outer TPC (occpancy in the TPC falls off mildly with radius).
- The extent range of <dE/dx> in the outer TPC is approximately over ~0.015 (lowest to highest black points in Plot 2 above).
- The RMS of <dE/dx> in the outer TPC is much less, probably below 0.004 as using 0.015/sqrt(12) gets down to 0.004, and the distribution is certainly not flat over the 0.015.
Question (1):
If we do assume an RMS of 0.0040, then removing this quadratically from a resolution of 7.10% = 0.0710 results in an expected improved resolution of 0.0709. This is enough to conclude that the effect of removing the dependence on anode currents from <dE/dx> is small enough to be negligible for the data in bulk, answering question (1).
Question (2):
This requires considering the extremes of the range of 0.015 in <dE/dx>. The furthest extreme is perhaps at the highest currents, where the <dE/dx> of hits may be as much as 1.5% off. The anode current distributions are shown in the next figure, where the black curve is for the RFF data.
Fig. 8: Distribution of anode currents in the outer TPC for the FF and RFF datasets.

Using 1.5% <dE/dx> shift represents something like a shift of ±21% of one standard deviation of the dE/dx of "good" tracks (i.e. 0.0710). Note that many tracks have much worse than 7.1% as shown in Fig. 5 and 6 above.
So the relevant question to ask is, "If I mistake the mean of a Gaussian distribution by 21% of a standard deviation, how wrong will my yield be when I integrate over the dE/dx range?"
The answer depends on how much of the dE/dx distribution is being integrated over. If integrating over ±1σ (red vertical lines in Fig. 9 below), the answer is only 1.5% error. If integrating over ±2σ (blue vertical lines below), the answer is a mere 0.5%. And of course even these errors can be avoided by fitting the dE/dx distribution for the yield, allowing the mean not to be at exactly the expected position. It is also important to keep in mind that it is only a very small portion of the data (the high end tail of the distribution) which has currents at these extremes.
Fig. 9: hypothetical dE/dx distributions representing a gaussian shifted (black curve) by 21% of a standard deviation from expectation (dashed curve).

I believe this answers question (2) by demonstrating that this is a very small systematic with which to be concerned.
Question (3):
No answers. There is some suspicion of the content in the table of averaged anode currents, but nothing has been demonstrated and concluded. It should be kept in mind that this was the first year to record the differential anode currents and the recorded data deserves thorough vetting.
Conclusion:
Going back to Fig. 1, the colors represent before (black) and after (red) account for the differential anode currents. The data further demonstrate that any benefits from the differential anode current correction are negligible.
Given the fears which loom over using these differential anode data, as well as the fact that we do not have a clear answer for question (3) above, implying that there are things which remain not understood about the situation with these currents as used in this study by Yuri & Yi, it seems not worth the potential costs of using these corrections for Run 11. This is not to say that we shouldn't try to deal with it in future Runs!
However, the TPC group has decided to see if it is possible to demonstrate a benefit for some particular subset of the data. We await this demonstration before declaring ourselve ready to produce the Run 11 AuAu200 data, or consider moving forward with the current calibration, despite having the wrong code for it (P11id does not contain the code to use the anode currents, while the DB parameterization of the dE/dx was done using anode currents).
-Gene
(all data plots provided by Yi Guo)
Groups:
- genevb's blog
- Login or register to post comments