- genevb's home page
- Posts
- 2025
- 2024
- 2023
- 2022
- September (1)
- 2021
- 2020
- 2019
- December (1)
- October (4)
- September (2)
- August (6)
- July (1)
- June (2)
- May (4)
- April (2)
- March (3)
- February (3)
- 2018
- 2017
- December (1)
- October (3)
- September (1)
- August (1)
- July (2)
- June (2)
- April (2)
- March (2)
- February (1)
- 2016
- November (2)
- September (1)
- August (2)
- July (1)
- June (2)
- May (2)
- April (1)
- March (5)
- February (2)
- January (1)
- 2015
- December (1)
- October (1)
- September (2)
- June (1)
- May (2)
- April (2)
- March (3)
- February (1)
- January (3)
- 2014
- December (2)
- October (2)
- September (2)
- August (3)
- July (2)
- June (2)
- May (2)
- April (9)
- March (2)
- February (2)
- January (1)
- 2013
- December (5)
- October (3)
- September (3)
- August (1)
- July (1)
- May (4)
- April (4)
- March (7)
- February (1)
- January (2)
- 2012
- December (2)
- November (6)
- October (2)
- September (3)
- August (7)
- July (2)
- June (1)
- May (3)
- April (1)
- March (2)
- February (1)
- 2011
- November (1)
- October (1)
- September (4)
- August (2)
- July (4)
- June (3)
- May (4)
- April (9)
- March (5)
- February (6)
- January (3)
- 2010
- December (3)
- November (6)
- October (3)
- September (1)
- August (5)
- July (1)
- June (4)
- May (1)
- April (2)
- March (2)
- February (4)
- January (2)
- 2009
- November (1)
- October (2)
- September (6)
- August (4)
- July (4)
- June (3)
- May (5)
- April (5)
- March (3)
- February (1)
- 2008
- 2005
- October (1)
- My blog
- Post new blog entry
- All blogs
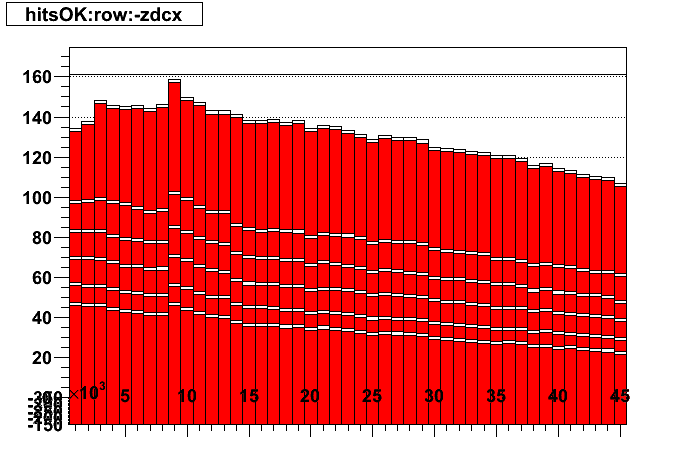
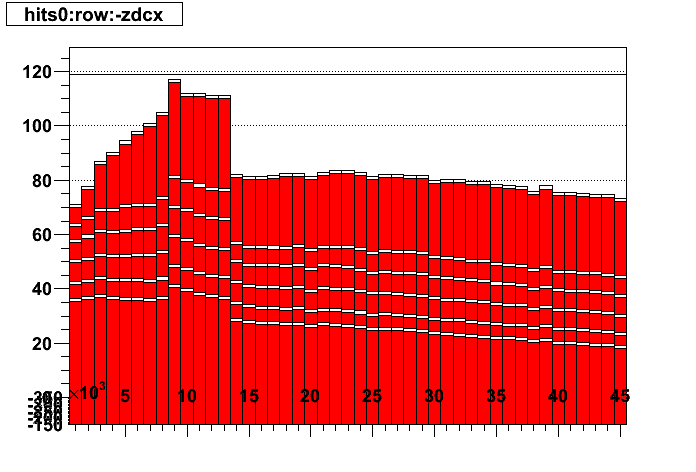
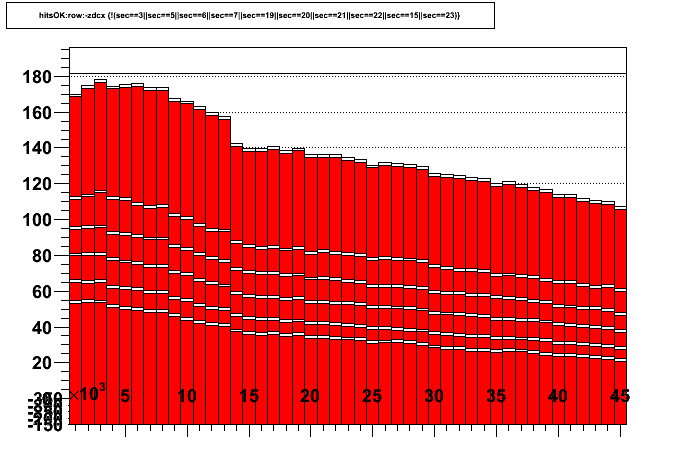
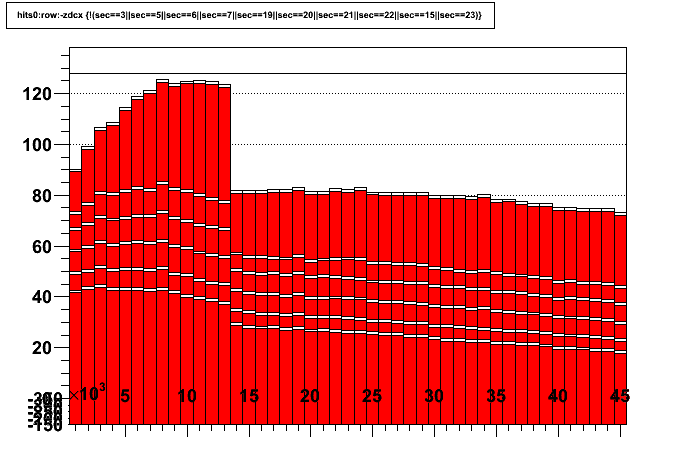
Hit occupancy with luminosity in Run 12 pp510
Mean number of TPC hits per padrow per event averaged over sectors vs. luminosity (depth in the histograms).
Hits available to tracking exclude those with flag & FCF_CHOPPED or flag & FCF_SANITY. I have not investigated which flags are set for the hits that fail the flag=0 cut.
Good sectors exclude 3,5,6,7,15,19,20,21,22,23 (meant to exclude portions of the TPC where there are dead channels or low gain regions).
Runs used (50 events of zerobias data from each): 13077066, 13077068, 13077073, 13077076, 13077081, 13078001, 13078006, 13078014, 13078028, 13078035, 13078039, 13078043, 13078048, 13078051, 13078058, 13078070, 13099025 (this last run is the lone high luminosity run in this sample).
______
Here are the fraction of hits available to tracking (in good sectors) which have their flags set:
I found no other flags set except for a couple hits with FCF_SANITY. We see FCF_ONEPAD at the few percent level, increasing with luminosity (occupancy?). Similarly for FCF_MERGED, but at the 10s of percent level (nearly reaching 50%). FCF_BIG_CHARGE is at a very small level with no clear pattern in this data. FCF_CHOPPED is also at the sub-1% level, with the only obvious pattern being more of them in the outer sectors than inner.
-Gene
| Hits available to tracking, all sectors | Hits with flag=0, all sectors |
|---|---|
 |
 |
| Hits available to tracking, good sectors | Hits with flag=0, good sectors |
 |
 |
Hits available to tracking exclude those with flag & FCF_CHOPPED or flag & FCF_SANITY. I have not investigated which flags are set for the hits that fail the flag=0 cut.
Good sectors exclude 3,5,6,7,15,19,20,21,22,23 (meant to exclude portions of the TPC where there are dead channels or low gain regions).
Runs used (50 events of zerobias data from each): 13077066, 13077068, 13077073, 13077076, 13077081, 13078001, 13078006, 13078014, 13078028, 13078035, 13078039, 13078043, 13078048, 13078051, 13078058, 13078070, 13099025 (this last run is the lone high luminosity run in this sample).
______
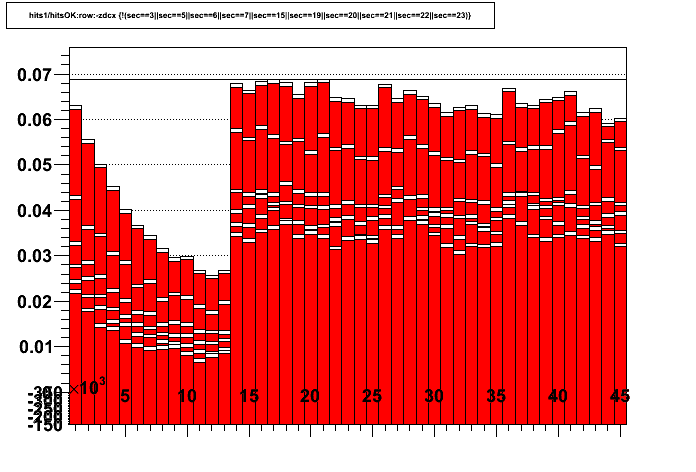
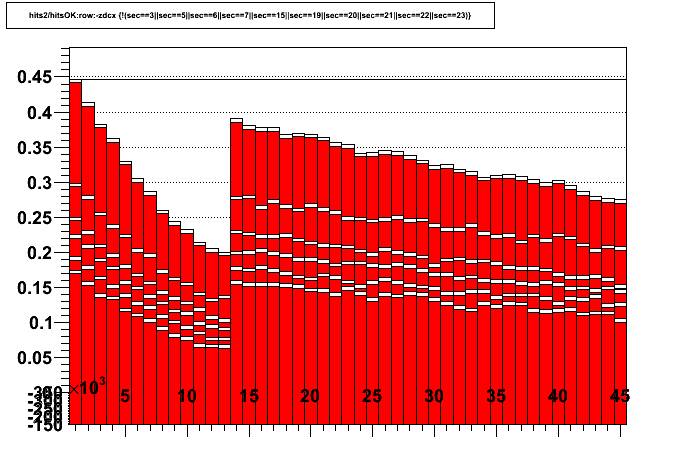
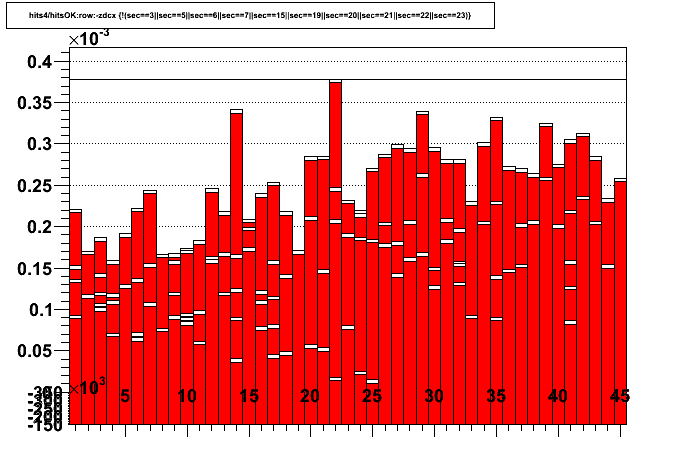
Here are the fraction of hits available to tracking (in good sectors) which have their flags set:
| FCF_ONEPAD (1) | FCF_MERGED (2) |
|---|---|
 |
 |
| FCF_BIG_CHARGE (8) | FCF_CHOPPED (256) |
 |
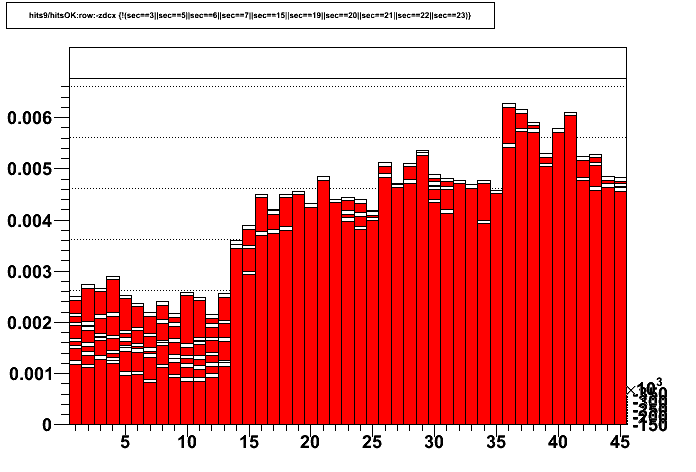 |
I found no other flags set except for a couple hits with FCF_SANITY. We see FCF_ONEPAD at the few percent level, increasing with luminosity (occupancy?). Similarly for FCF_MERGED, but at the 10s of percent level (nearly reaching 50%). FCF_BIG_CHARGE is at a very small level with no clear pattern in this data. FCF_CHOPPED is also at the sub-1% level, with the only obvious pattern being more of them in the outer sectors than inner.
-Gene
Groups:
- genevb's blog
- Login or register to post comments
