- genevb's home page
- Posts
- 2025
- 2024
- 2023
- 2022
- September (1)
- 2021
- 2020
- 2019
- December (1)
- October (4)
- September (2)
- August (6)
- July (1)
- June (2)
- May (4)
- April (2)
- March (3)
- February (3)
- 2018
- 2017
- December (1)
- October (3)
- September (1)
- August (1)
- July (2)
- June (2)
- April (2)
- March (2)
- February (1)
- 2016
- November (2)
- September (1)
- August (2)
- July (1)
- June (2)
- May (2)
- April (1)
- March (5)
- February (2)
- January (1)
- 2015
- December (1)
- October (1)
- September (2)
- June (1)
- May (2)
- April (2)
- March (3)
- February (1)
- January (3)
- 2014
- December (2)
- October (2)
- September (2)
- August (3)
- July (2)
- June (2)
- May (2)
- April (9)
- March (2)
- February (2)
- January (1)
- 2013
- December (5)
- October (3)
- September (3)
- August (1)
- July (1)
- May (4)
- April (4)
- March (7)
- February (1)
- January (2)
- 2012
- December (2)
- November (6)
- October (2)
- September (3)
- August (7)
- July (2)
- June (1)
- May (3)
- April (1)
- March (2)
- February (1)
- 2011
- November (1)
- October (1)
- September (4)
- August (2)
- July (4)
- June (3)
- May (4)
- April (9)
- March (5)
- February (6)
- January (3)
- 2010
- December (3)
- November (6)
- October (3)
- September (1)
- August (5)
- July (1)
- June (4)
- May (1)
- April (2)
- March (2)
- February (4)
- January (2)
- 2009
- November (1)
- October (2)
- September (6)
- August (4)
- July (4)
- June (3)
- May (5)
- April (5)
- March (3)
- February (1)
- 2008
- 2005
- October (1)
- My blog
- Post new blog entry
- All blogs
Sti Track Permutations
As part of closing RT Ticket 2271, we implemented some protection against unreasonably long track-finding occurrences ("hanging") by limiting the number of "permutations" the tracker may consider for a track, and cumulatively for an event. In making sure we got reasonable choices, I printed out the number of track-wise and event-wise permutations for each track in the first 8 events of 9 of our nightly test jobs and made myself an ntuple. I found some interesting features which I will present here. I do not claim from these plots that there is anything wrong, but the features do invite some explanation of Sti's behavior...
_____________________
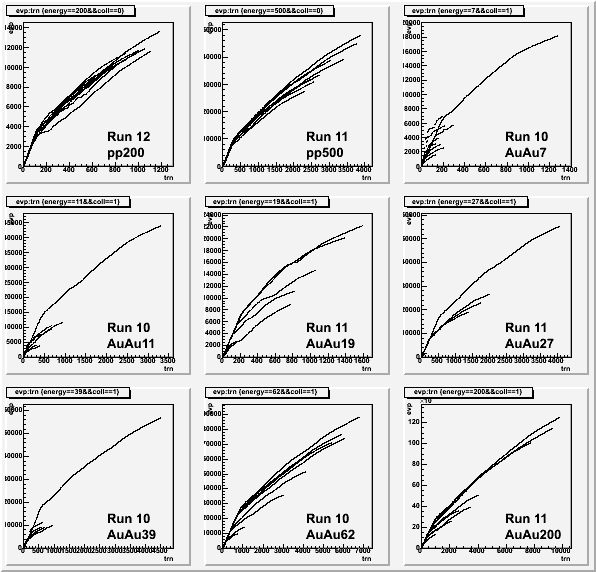
First I show the growing number of permutations in an event vs. the track number (i.e. 1 on the horizontal axis is the first track seed extended in that event, 2 is the next seed extended, etc.). The total permutations in the event will now be using in halting the tracking. We can see that this can exceed 105 for what appear to be ordinary AuAu200 events, so the limit should be much higher than this (suggested: 107). There are 8 curves per plot, representing the 8 events examined in that dataset:
The above plot shows some interesting features: a steep rise at the beginning, and then a shallower increase afterwards. Suspecting this to be something like good, long tracks, followed by lesser quality shorter tracks, I tried scaling both axes by [approximately*] the total number of tracks in the event (sort of an occupancy or multiplicity scaling), which makes the horizontal axis for every event go from 0 to ~1:
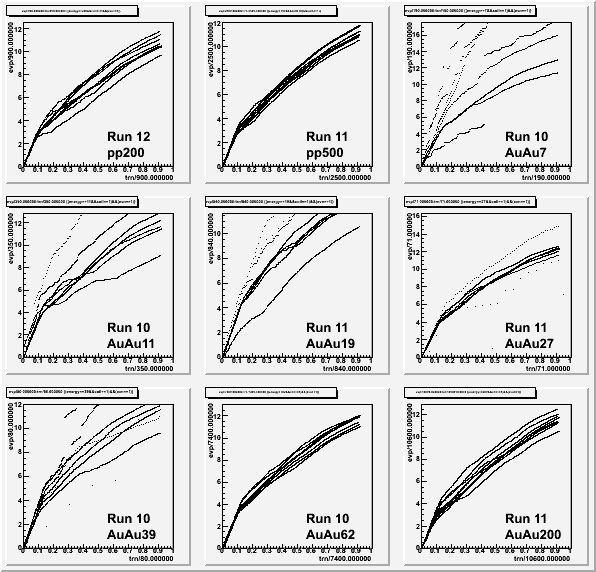
The low energy datasets look a bit rough, but this may be a matter of statistics, as higher occupancy datasets seem to scale well and all types of events generally agree. So it appears to be some consistent behavior from Sti.
Next is the distribution of track permutations for each dataset (log-log plot)
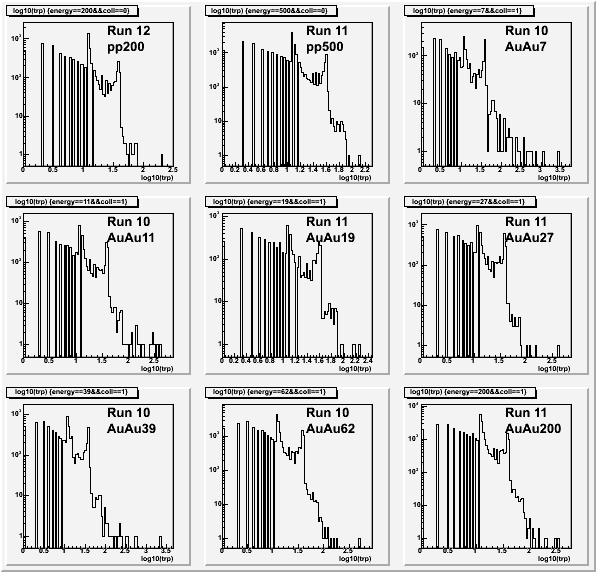
In none of these examined events do the permutations exceed 104, so that seems a reasonable limit (besides, this limit is not used to halt events, but just to stop permutations for that track).
The peaks appear to be at ~13 permutations and ~45, corresponding to tracking through the inner-only sectors and the inner+outer. Makes some sense, but is that all there is to it?
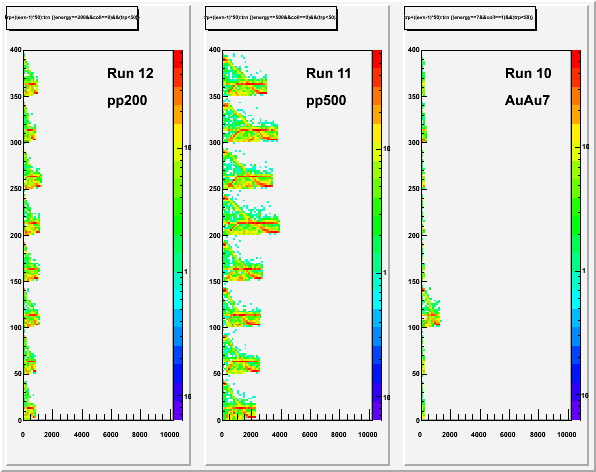
Plotting this quantity (track permutations) vs. track number (described earlier), and offsetting events by 50 vertically (first event uses 0..49, second event uses 50..99; I put a cut to use only those tracks with less than 50 permutations) shows some additional features (color axis is logarithmic):

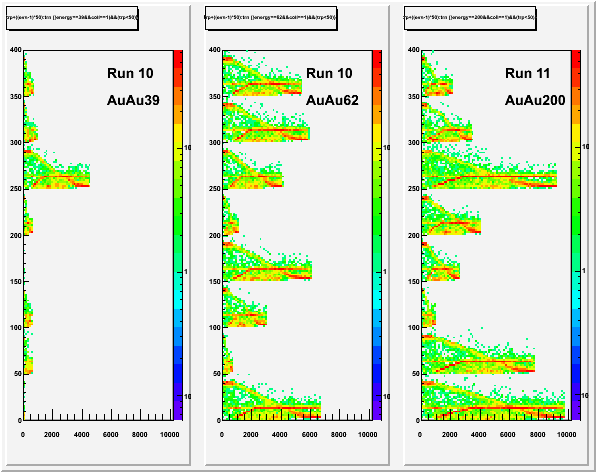
Every event looks quite similar, but could be even more similar if we repeat the previously used horizontal axis scaling (dividing by the number of tracks in the event). The result, overlapping all 8 events in each dataset, is here:
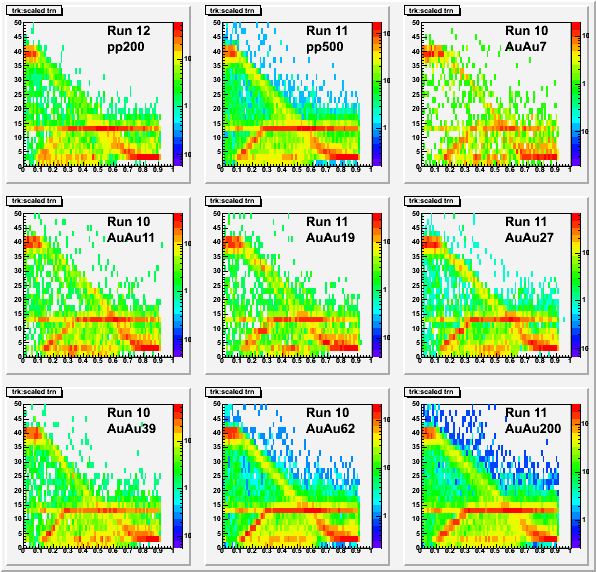
All events in all datasets appear to have the same pattern/features! It is this consistency of pattern that makes for the evident scaling on the second plot set on this page (long tracks are found first which a steady number of permutations per track, then the shorter tracks). They do not necessarily represent any problem, but what do they mean?
Some initial hypotheses (along with Victor):
- Group near 45 for first few tracks, then dropping towards 0:
- Good tracks, starting out the outermost radii. After exhausting the seeds which start at the outmost radii, moving inwards gradually so tracks must get shorter and shorter.
- Group near 13 early in the track finding:
- Tracks broken by GridLeak? Why aren't these found until later when we get to using seeds that start at the outer radius of the inner sectors?
- Group rising from 0 to 13, then saturating (seems generally distinct from the previous group, which peaks early and drops off):
- Same question about why GridLeak-broken tracks appear over a range of track numbers, and no obvious explanations for the rise from 0.
- Group near 0 in the middle of track-finding:
- ?
______________________________
-Gene
* For each event, I plotted the distribution of track numbers from my ntuple, letting ROOT decide the histogram range, and then grabbed the X max of the created histogram as my approximation of the total number of tracks. This is probably off by a factor of ~8%, but systematically so for all.
Groups:
- genevb's blog
- Login or register to post comments