- genevb's home page
- Posts
- 2025
- 2024
- 2023
- 2022
- September (1)
- 2021
- 2020
- 2019
- December (1)
- October (4)
- September (2)
- August (6)
- July (1)
- June (2)
- May (4)
- April (2)
- March (3)
- February (3)
- 2018
- 2017
- December (1)
- October (3)
- September (1)
- August (1)
- July (2)
- June (2)
- April (2)
- March (2)
- February (1)
- 2016
- November (2)
- September (1)
- August (2)
- July (1)
- June (2)
- May (2)
- April (1)
- March (5)
- February (2)
- January (1)
- 2015
- December (1)
- October (1)
- September (2)
- June (1)
- May (2)
- April (2)
- March (3)
- February (1)
- January (3)
- 2014
- December (2)
- October (2)
- September (2)
- August (3)
- July (2)
- June (2)
- May (2)
- April (9)
- March (2)
- February (2)
- January (1)
- 2013
- December (5)
- October (3)
- September (3)
- August (1)
- July (1)
- May (4)
- April (4)
- March (7)
- February (1)
- January (2)
- 2012
- December (2)
- November (6)
- October (2)
- September (3)
- August (7)
- July (2)
- June (1)
- May (3)
- April (1)
- March (2)
- February (1)
- 2011
- November (1)
- October (1)
- September (4)
- August (2)
- July (4)
- June (3)
- May (4)
- April (9)
- March (5)
- February (6)
- January (3)
- 2010
- December (3)
- November (6)
- October (3)
- September (1)
- August (5)
- July (1)
- June (4)
- May (1)
- April (2)
- March (2)
- February (4)
- January (2)
- 2009
- November (1)
- October (2)
- September (6)
- August (4)
- July (4)
- June (3)
- May (5)
- April (5)
- March (3)
- February (1)
- 2008
- 2005
- October (1)
- My blog
- Post new blog entry
- All blogs
Luminosity systematics for Run 12 pp510 TPC hit errors
I ran the TPC hit error calibration for 500 events from 3 runs, using the following chain in SL13b:
DbV20130415,pp2012b,ITTF,beamline,VFPPVnoCTB,geant,BEmcChkStat,btof,Corr4,OSpaceZ2,OGridLeak3D,-hitfilt
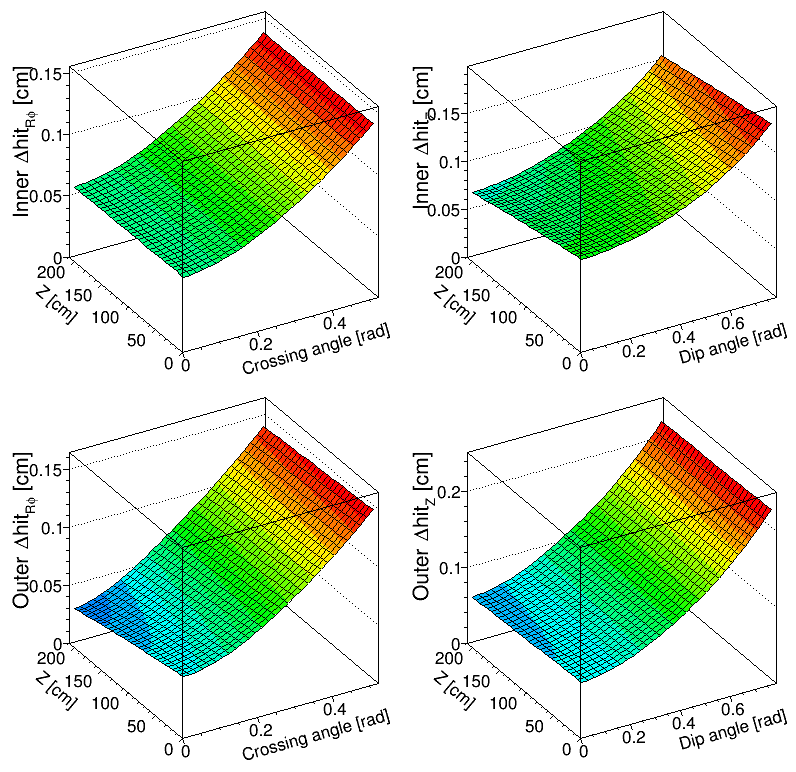
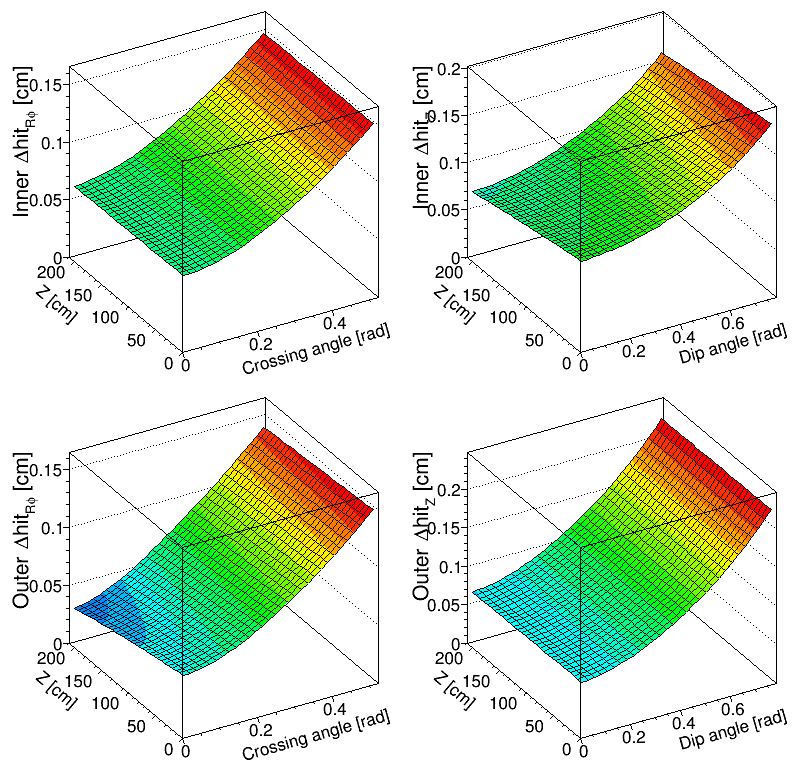
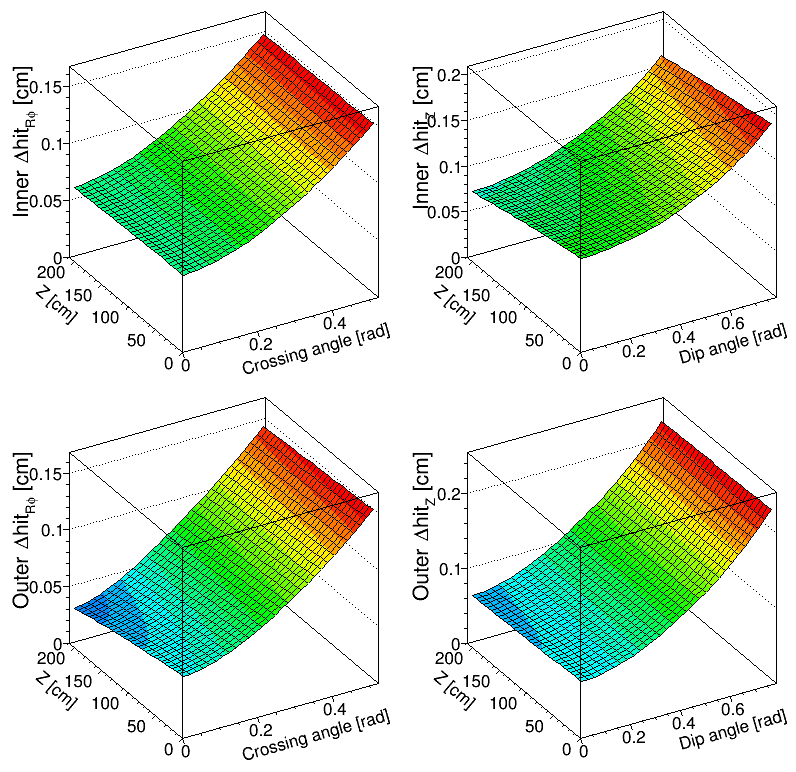
Here are the three sets of TPC hit errors plotted (open the image in a new tab or window to see full size so that the axes are legible):
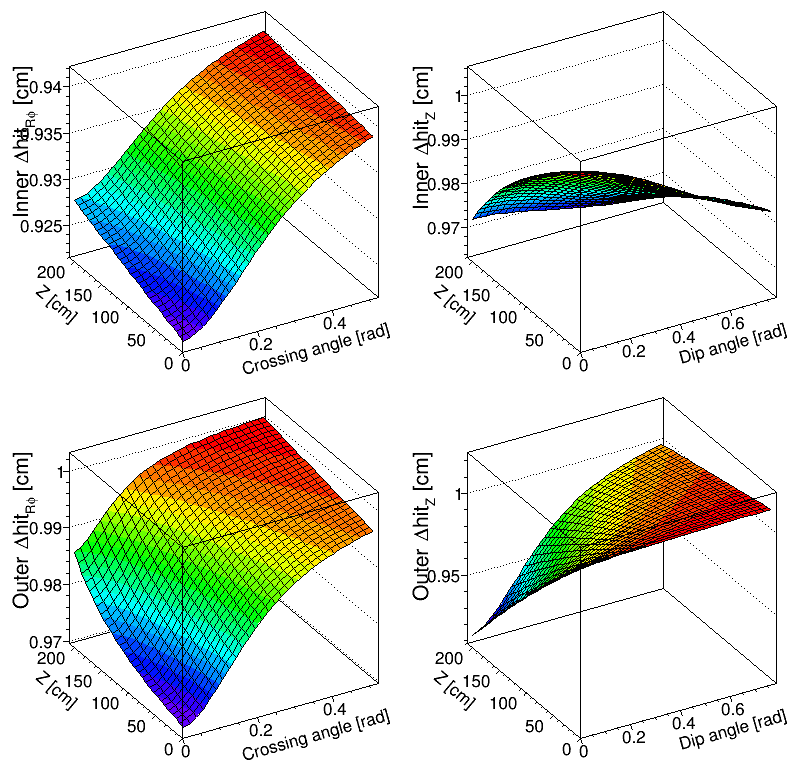
And here are the ratios between them:
The low and high luminosity hit errors are well within ±10% (generally much less) of the mid luminosity errors.
-Gene
DbV20130415,pp2012b,ITTF,beamline,VFPPVnoCTB,geant,BEmcChkStat,btof,Corr4,OSpaceZ2,OGridLeak3D,-hitfilt
| Low | Mid | High | |
|---|---|---|---|
| Run # | 13096006 | 13108001 | 13108071 |
| ZDCx [MHz] | 0.172 | 0.252 | 0.355 |
| BBCx [MHz] | 1.94 | 2.89 | 4.09 |
| TPC Hit Error Coefficients (6 inner, 6 outer) |
0.003341787 9.388876e-05 0.051278 0.00473453 0.002114308 0.02065579 0.0009628346 0.0008208762 0.05992494 0.003797901 0.0005902361 0.04837168 |
0.003884301 0.0001321844 0.05766822 0.004991736 0.001960115 0.02221587 0.0009935053 0.0008843312 0.05981651 0.004514012 0.0001670887 0.04776563 |
0.003819716 0.0002417769 0.05805366 0.005408129 0.002370836 0.02273012 0.001039648 0.0008773184 0.06265231 0.004088022 0.0005653975 0.04954803 |
Here are the three sets of TPC hit errors plotted (open the image in a new tab or window to see full size so that the axes are legible):
| Low | Mid | High |
|---|---|---|
 |
 |
 |
And here are the ratios between them:
| Low/Mid | High/Mid |
|---|---|
 |
 |
The low and high luminosity hit errors are well within ±10% (generally much less) of the mid luminosity errors.
-Gene
Groups:
- genevb's blog
- Login or register to post comments