- genevb's home page
- Posts
- 2025
- 2024
- 2023
- 2022
- September (1)
- 2021
- 2020
- 2019
- December (1)
- October (4)
- September (2)
- August (6)
- July (1)
- June (2)
- May (4)
- April (2)
- March (3)
- February (3)
- 2018
- 2017
- December (1)
- October (3)
- September (1)
- August (1)
- July (2)
- June (2)
- April (2)
- March (2)
- February (1)
- 2016
- November (2)
- September (1)
- August (2)
- July (1)
- June (2)
- May (2)
- April (1)
- March (5)
- February (2)
- January (1)
- 2015
- December (1)
- October (1)
- September (2)
- June (1)
- May (2)
- April (2)
- March (3)
- February (1)
- January (3)
- 2014
- December (2)
- October (2)
- September (2)
- August (3)
- July (2)
- June (2)
- May (2)
- April (9)
- March (2)
- February (2)
- January (1)
- 2013
- December (5)
- October (3)
- September (3)
- August (1)
- July (1)
- May (4)
- April (4)
- March (7)
- February (1)
- January (2)
- 2012
- December (2)
- November (6)
- October (2)
- September (3)
- August (7)
- July (2)
- June (1)
- May (3)
- April (1)
- March (2)
- February (1)
- 2011
- November (1)
- October (1)
- September (4)
- August (2)
- July (4)
- June (3)
- May (4)
- April (9)
- March (5)
- February (6)
- January (3)
- 2010
- December (3)
- November (6)
- October (3)
- September (1)
- August (5)
- July (1)
- June (4)
- May (1)
- April (2)
- March (2)
- February (4)
- January (2)
- 2009
- November (1)
- October (2)
- September (6)
- August (4)
- July (4)
- June (3)
- May (5)
- April (5)
- March (3)
- February (1)
- 2008
- 2005
- October (1)
- My blog
- Post new blog entry
- All blogs
Run 12 pp200 production peek at dE/dx in the MuDst
These are plots of primary track dE/dx nSigma quantities stored in the MuDsts with no cuts other than nSigmaPion > -5e5 (there is some class of tracks with very large negative nSigmaPion). Very important note: according to the StMuTrack class, the nSigma quantities are scaled by a factor of 1000 in the MuDsts (via a factor called __SIGMA_SCALE__), so 1000 is equal to 1.0 sigma.
___________
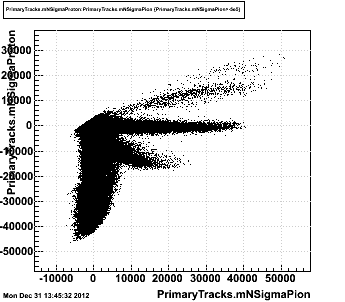
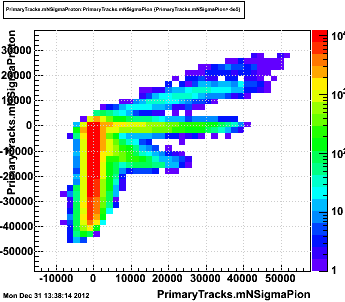
nSigmaProton vs. nSigmaPion from a random run (day 67):
(scatter plot, and zcol in logz plot of the same data)
___________
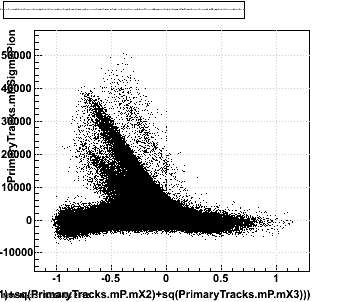
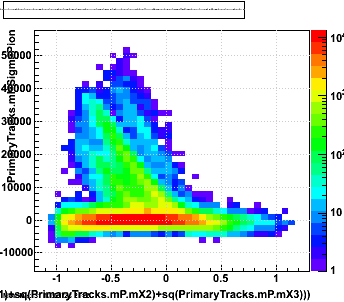
nSigmaPion vs. log10(momentum), same data, scatter and zcol in logz:
___________
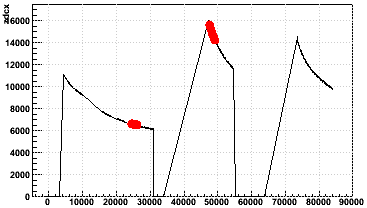
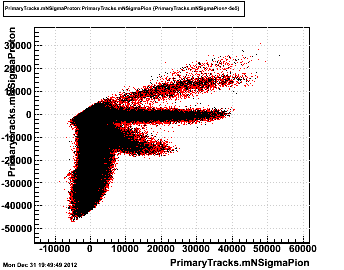
Two files taken at similar times but with very different luminosities (16 kHz was near the maximum instantaneous luminosity for the Run 12 pp200 data), highlighted in red in the zdcx [Hz] vs. time [sec] plot on the left. These are then compared on the right for nSigmaProton vs. nSigmaPion, run 13068034 (black) and run 13068057 (red), showing no obvious differences.
___________
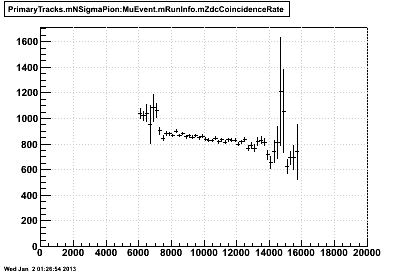
Profile of nSigmaPion vs. zdcx [Hz] from 337 st_physics MuDst files currently located under /star/data41/reco/pp200_production_2012/ReversedFullField/P12id/2012/:
___________
Update (January 3)
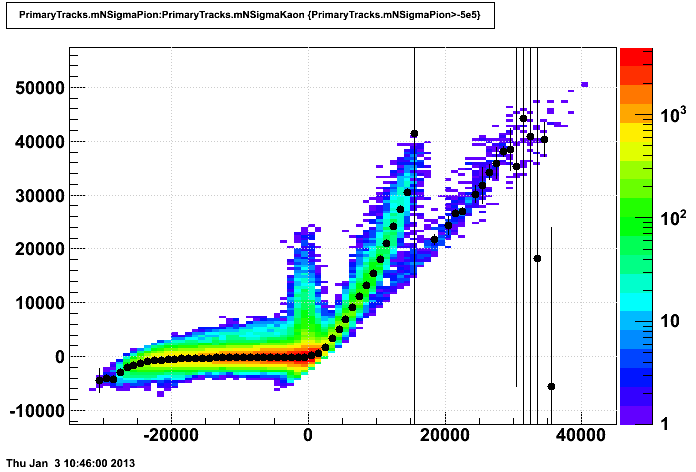
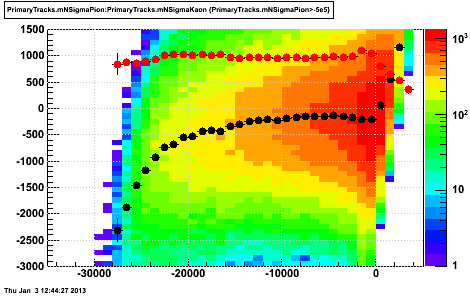
A closer look using nSigmaPion vs. nSigmaKaon for a few files from day 67. As the closest particle in dE/dx (other than electrons and muons, of which we expect there to be an almost negligible amount, particularly in the primary tracks), this provides an easy way to find well isolated pions. Black dots are from FitSlices peak positions of the 2D histogram:
Zooming in on the FitSlices in the region near nSigmaPion=0, we can see the region of low nSigmaKaon (horizontal axis) where the pions are essentially uncomtaminated. Here, black dots are the FitSlices peak positions, and red dots are the FitSlices peak widths (not shifted to move with the peaks).
At no place in this region do the FitSlices peak positions sit at zero, and they're deviation from zero grows with increasing distance from the kaons (i.e. at decreasing low momentum where the bands separate). This latter correlation is probably just an artifact of the relationship between nSigmaPion and nSigmaKaon: a track whose dE/dx measurement fluctuates low will get more negative values of both nSigmaPion and nSigmaKaon. The peak widths are well situated at ~1.0 sigma (remember, 1000 on this plot is 1.0 sigma due to scaling in the MuDst.)
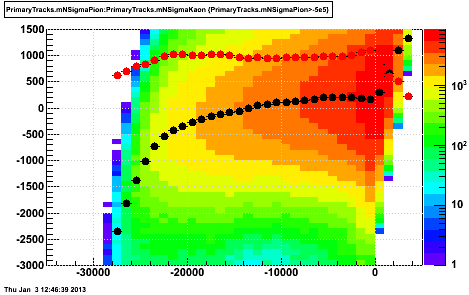
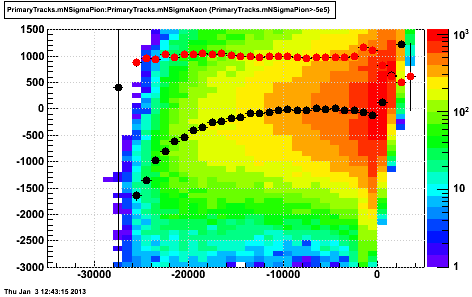
For comparision, here are the same plots for some random P11id 2009 pp200 data (first plot) and P12id 2012 UU193 data (second plot). The UU data looks similar, but is shifted up slightly compared to the above P12id 2012 pp200 data. The 2009 pp200 data is shifted upward significantly, even crossing zero.
Code: to generate the above plots:
___________
Update 2 (January 3)
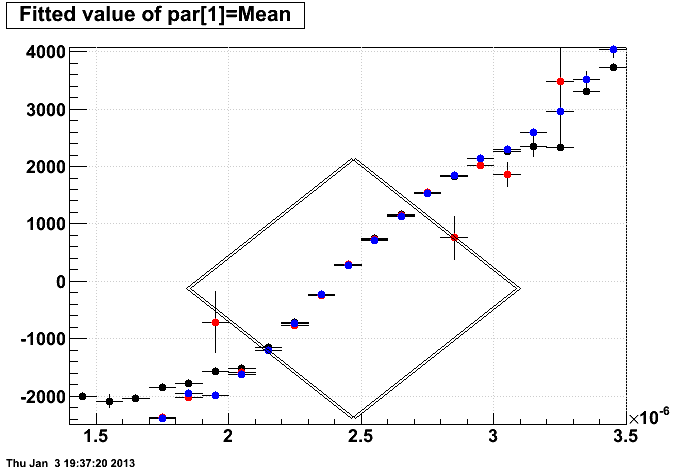
Focusing on the shifted nSigmaPion peak positions, I looked at whether the nSigma is shifted but the dE/dx is not. Here is nSigmaPion peak position (from FitSlices) vs. dE/dx for primary tracks with momenta in the range [0.48,0.56 GeV/c], around the MIP point for pions (no other cuts). Data are Run 12 pp200 (red), Run 12 UU (blue), Run 9 pp200 (black). In the region of pions (near nSigmaPion ~= 0, highlighted by the large diamond outline), all three datasets overlap. Conclusion: it is not a case of dE/dx being OK while nSigma is shifted.
While at it, I plotted the dE/dx distributions in the same momentum range for the three datasets (same colors), where shifts between the datasets can be seen. However, these should probably be taken with the understanding that I've done almost nothing to insure the purity of the pion tracks. First are normalized versions of the distributions to help in a visual comparison:
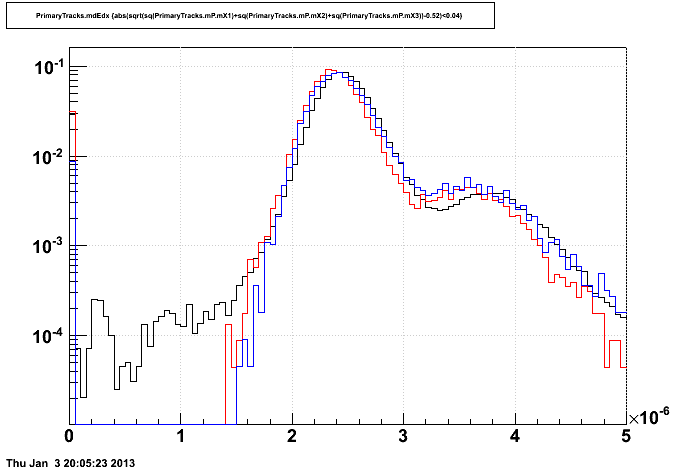
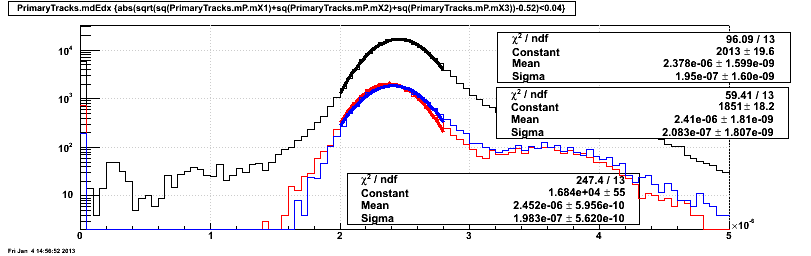
Gaussian fits around the peak in the range [2.0e-6,2.8e-6] lead to the following peak positions in the non-normalized distributions (normalizing screws up the fits):
___________
-Gene
___________
nSigmaProton vs. nSigmaPion from a random run (day 67):
(scatter plot, and zcol in logz plot of the same data)
___________
nSigmaPion vs. log10(momentum), same data, scatter and zcol in logz:
___________
Two files taken at similar times but with very different luminosities (16 kHz was near the maximum instantaneous luminosity for the Run 12 pp200 data), highlighted in red in the zdcx [Hz] vs. time [sec] plot on the left. These are then compared on the right for nSigmaProton vs. nSigmaPion, run 13068034 (black) and run 13068057 (red), showing no obvious differences.
___________
Profile of nSigmaPion vs. zdcx [Hz] from 337 st_physics MuDst files currently located under /star/data41/reco/pp200_production_2012/ReversedFullField/P12id/2012/:
___________
Update (January 3)
A closer look using nSigmaPion vs. nSigmaKaon for a few files from day 67. As the closest particle in dE/dx (other than electrons and muons, of which we expect there to be an almost negligible amount, particularly in the primary tracks), this provides an easy way to find well isolated pions. Black dots are from FitSlices peak positions of the 2D histogram:
Zooming in on the FitSlices in the region near nSigmaPion=0, we can see the region of low nSigmaKaon (horizontal axis) where the pions are essentially uncomtaminated. Here, black dots are the FitSlices peak positions, and red dots are the FitSlices peak widths (not shifted to move with the peaks).
At no place in this region do the FitSlices peak positions sit at zero, and they're deviation from zero grows with increasing distance from the kaons (i.e. at decreasing low momentum where the bands separate). This latter correlation is probably just an artifact of the relationship between nSigmaPion and nSigmaKaon: a track whose dE/dx measurement fluctuates low will get more negative values of both nSigmaPion and nSigmaKaon. The peak widths are well situated at ~1.0 sigma (remember, 1000 on this plot is 1.0 sigma due to scaling in the MuDst.)
For comparision, here are the same plots for some random P11id 2009 pp200 data (first plot) and P12id 2012 UU193 data (second plot). The UU data looks similar, but is shifted up slightly compared to the above P12id 2012 pp200 data. The 2009 pp200 data is shifted upward significantly, even crossing zero.
Code: to generate the above plots:
gStyle->SetPalette(1);gStyle->SetOptStat(0);gStyle->SetGridColor(kGray);gStyle->SetNdivisions(505);
MuDst.Draw("PrimaryTracks.mNSigmaPion:PrimaryTracks.mNSigmaKaon>>hskz(40,-35000,5000,45,-3000,1500)","PrimaryTracks.mNSigmaPion>-5e5","zcol");
gPad->SetLogz();
hskz->FitSlicesY();
hskz_1->SetMarkerStyle(8);
hskz_2->SetMarkerStyle(8);
hskz_2->SetMarkerColor(2);
hskz_1->Draw("same");
hskz_2->Draw("same");
___________
Update 2 (January 3)
Focusing on the shifted nSigmaPion peak positions, I looked at whether the nSigma is shifted but the dE/dx is not. Here is nSigmaPion peak position (from FitSlices) vs. dE/dx for primary tracks with momenta in the range [0.48,0.56 GeV/c], around the MIP point for pions (no other cuts). Data are Run 12 pp200 (red), Run 12 UU (blue), Run 9 pp200 (black). In the region of pions (near nSigmaPion ~= 0, highlighted by the large diamond outline), all three datasets overlap. Conclusion: it is not a case of dE/dx being OK while nSigma is shifted.
While at it, I plotted the dE/dx distributions in the same momentum range for the three datasets (same colors), where shifts between the datasets can be seen. However, these should probably be taken with the understanding that I've done almost nothing to insure the purity of the pion tracks. First are normalized versions of the distributions to help in a visual comparison:
Gaussian fits around the peak in the range [2.0e-6,2.8e-6] lead to the following peak positions in the non-normalized distributions (normalizing screws up the fits):
- Run 12 pp200: (2.378 ± 0.002) x 10-6
- Run 12 UU193: (2.410 ± 0.002) x 10-6
- Run 9 pp200: (2.452 ± 0.001) x 10-6
___________
-Gene
Groups:
- genevb's blog
- Login or register to post comments