- genevb's home page
- Posts
- 2025
- 2024
- 2023
- 2022
- September (1)
- 2021
- 2020
- 2019
- December (1)
- October (4)
- September (2)
- August (6)
- July (1)
- June (2)
- May (4)
- April (2)
- March (3)
- February (3)
- 2018
- 2017
- December (1)
- October (3)
- September (1)
- August (1)
- July (2)
- June (2)
- April (2)
- March (2)
- February (1)
- 2016
- November (2)
- September (1)
- August (2)
- July (1)
- June (2)
- May (2)
- April (1)
- March (5)
- February (2)
- January (1)
- 2015
- December (1)
- October (1)
- September (2)
- June (1)
- May (2)
- April (2)
- March (3)
- February (1)
- January (3)
- 2014
- December (2)
- October (2)
- September (2)
- August (3)
- July (2)
- June (2)
- May (2)
- April (9)
- March (2)
- February (2)
- January (1)
- 2013
- December (5)
- October (3)
- September (3)
- August (1)
- July (1)
- May (4)
- April (4)
- March (7)
- February (1)
- January (2)
- 2012
- December (2)
- November (6)
- October (2)
- September (3)
- August (7)
- July (2)
- June (1)
- May (3)
- April (1)
- March (2)
- February (1)
- 2011
- November (1)
- October (1)
- September (4)
- August (2)
- July (4)
- June (3)
- May (4)
- April (9)
- March (5)
- February (6)
- January (3)
- 2010
- December (3)
- November (6)
- October (3)
- September (1)
- August (5)
- July (1)
- June (4)
- May (1)
- April (2)
- March (2)
- February (4)
- January (2)
- 2009
- November (1)
- October (2)
- September (6)
- August (4)
- July (4)
- June (3)
- May (5)
- April (5)
- March (3)
- February (1)
- 2008
- 2005
- October (1)
- My blog
- Post new blog entry
- All blogs
RT 2495 notes
Notes and observations for RT 2495:
Focusing on one observation, Mustafa sees pions that are less efficiently reconstructed in real data during embedding than in the simulated data for sector 7 (notable here) for UU193 reconstructed in SL12d_embed.
Sectors 5,6,7 all had their innermost RDO 1 dead during this period of time. In principle, all three of these sectors should see similar inefficiencies due to the dead RDO. I checked the tpcRDOMask table in the DB and they are all properly set for this period.
I processed 100 events from run 13133061 in both SL12d and SL12d_embed and found that the standard reconstruction chain used for the P12id UU production gives the exact same hits in both libraries. However, running the embedding chain provided by Mustafa sees some mild differences:
It may be an artifact of PID cuts...that's next to be examined...
______________________________
UPDATE (2013-08-02)
There is definitely something odd about dE/dx in sector 7. Here is a plot of <nσπ> vs. pT (error bars are RMS, not error-on-mean) for 4 parts of the west-bound (η>0), negatively-charged tracks: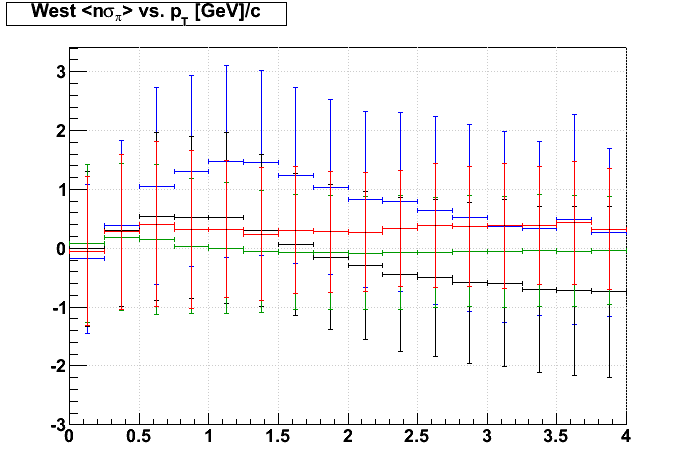
There is a clear shift in the sector 7 real data. Here now are the actual nσπ distributions for all 4 cases, where dark colors represent pT<0.5 GeV/c, and lighter colors are 0.5<pT<1.5 GeV/c. First plot is from SL12d_embed π- embedding sample, and second plot is from P12id production:
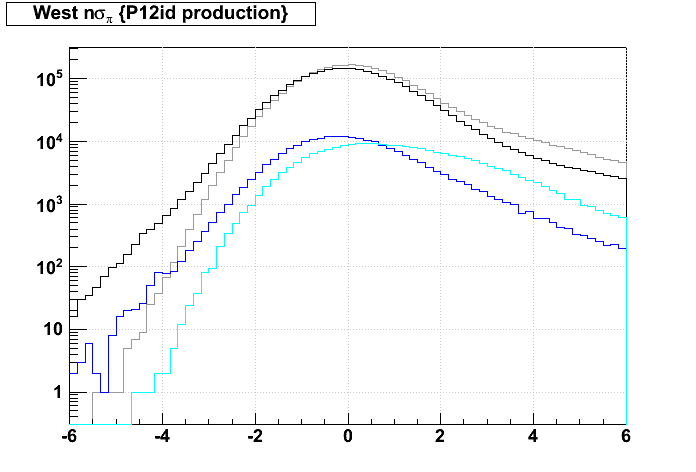
While mid-pT curves are different from low-pT due in large part to contamination from other species (more so in the real data than the simulation, which is embedded pions, though no cut was made to select only the resulting pions as opposed to secondaries), the light blue curve, for sector 7 mid-pT, shows a clearly different distribution from all the rest. And this effect is there in the P12id production, but not so much the simulated data for sector 7.
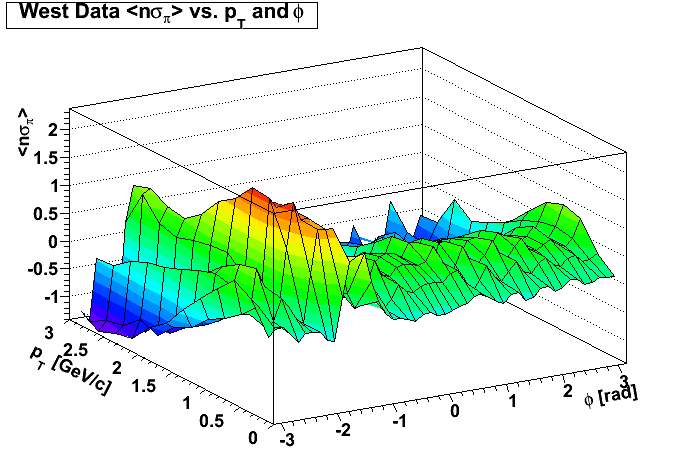
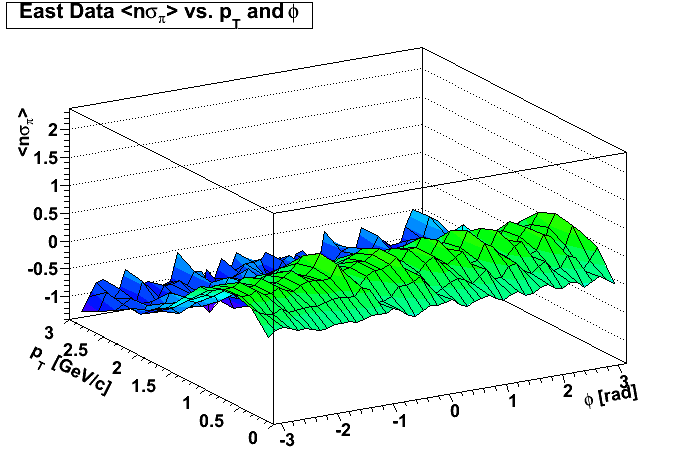
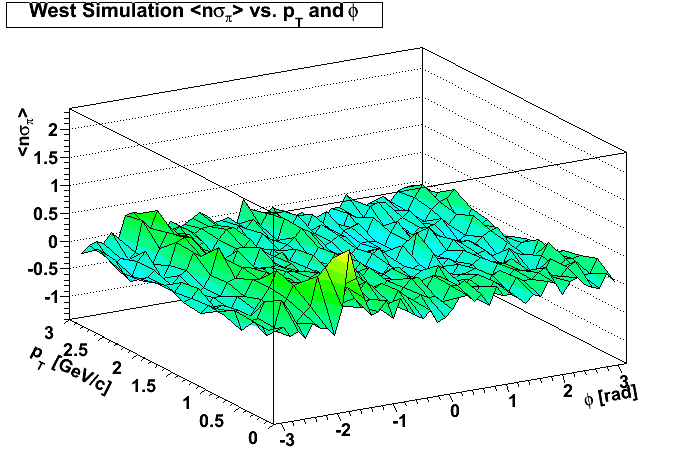
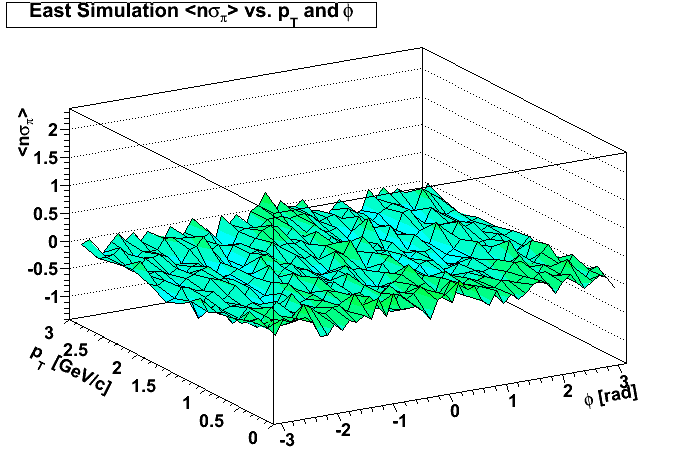
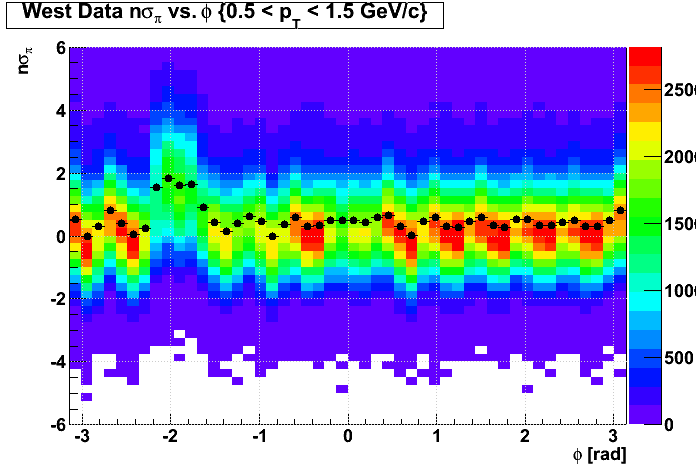
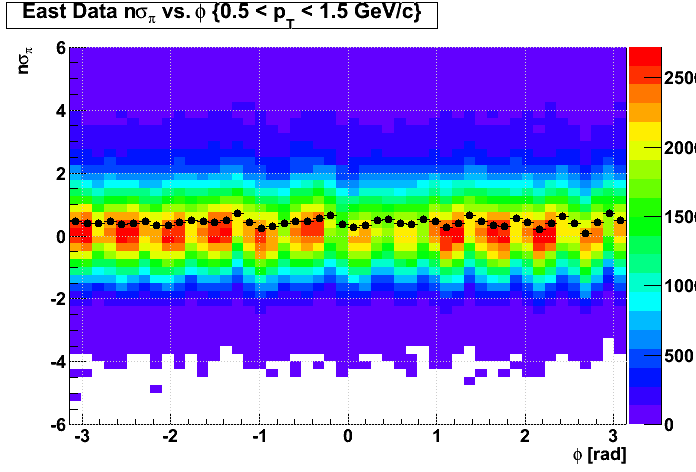
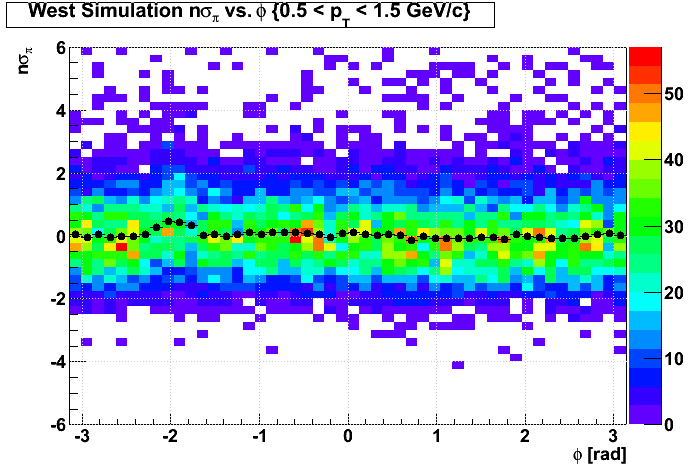
To get a better view, I looked at <nσπ> vs. φ and pT, as well as nσπ vs. φ at mid-pT, and the results show clearly that sector 7 has some unusually high nσπ:
In the below nσπ distribution plots, the profile of the histogram (i.e. the mean within these nσπ and mid-pT ranges) is shown as black points:
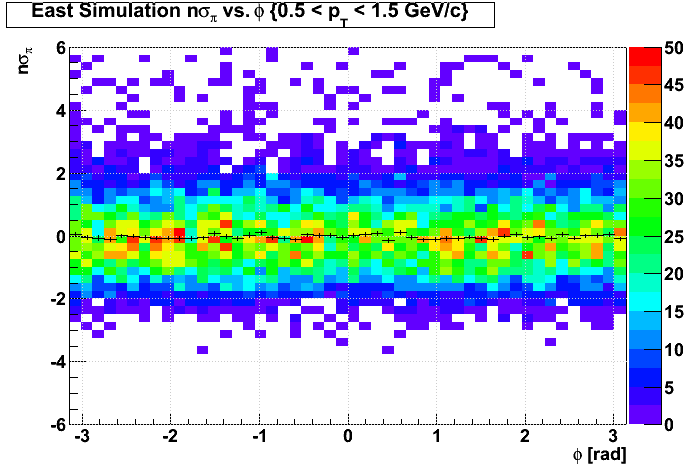
It is interesting to note that the simulated data does also have a slightly elevated nσπ in sector 7, but nowhere near as high as in the real data. It is also quite evident that a cut on |nσπ|<2, as used in the embedding QA, will be less efficient in the real data than in the simulated data, which is a problem for determining efficiencies from embedding!
____________
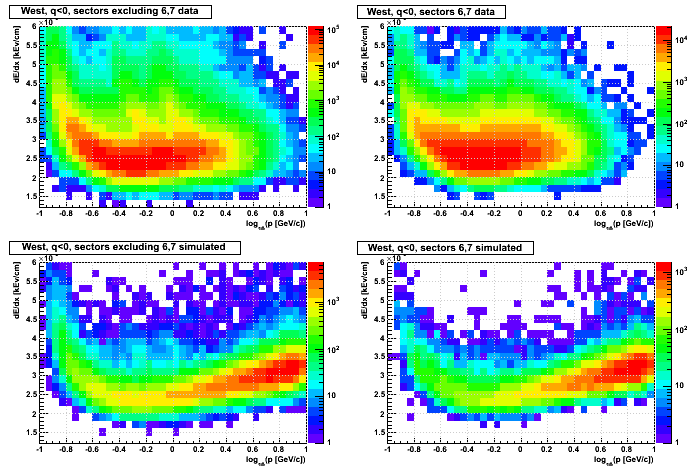
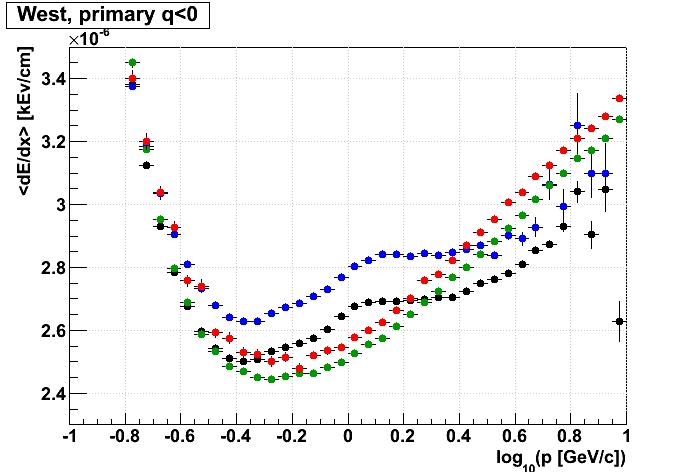
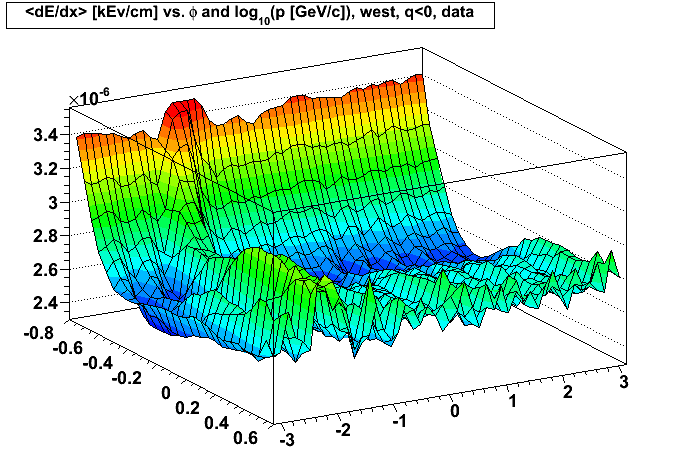
Looking directly at dE/dx
nσπ involves the dE/dx of tracks. So here then are some plots for dE/dx of the same data (colors are the same as before on the 1-D profile data, except that you will see for reasons explained in a moment that I have also grouped sector 6 along with sector 7):
Now it is clear that tracks going into sector 7 see larger dE/dx than tracks in other sectors. Some additional features observable:
The hit charges show no obvious deviation for sector 7. One might say sectors 5,6,7 are all slightly elevated above other sectors, but the dE/dx issue is clearly only a problem for sector 7, not sectors 5 & 6, so the issue does not seem to be with the hit charge.
This leaves some issue with the calibration (or application thereof) of the dE/dx determination from hit charge in sector 7...
Focusing on one observation, Mustafa sees pions that are less efficiently reconstructed in real data during embedding than in the simulated data for sector 7 (notable here) for UU193 reconstructed in SL12d_embed.
Sectors 5,6,7 all had their innermost RDO 1 dead during this period of time. In principle, all three of these sectors should see similar inefficiencies due to the dead RDO. I checked the tpcRDOMask table in the DB and they are all properly set for this period.
I processed 100 events from run 13133061 in both SL12d and SL12d_embed and found that the standard reconstruction chain used for the P12id UU production gives the exact same hits in both libraries. However, running the embedding chain provided by Mustafa sees some mild differences:
- In particular, anode channel 3-4 was operated at ~750V, which should lead to no real signals. Noise hits are still there in the data, so the corresponding rows of sector 3 aren't completely empty, but the simulation generates no hits here.
- When looking at sector 7, I saw just a handfull of hits different over the 100 events, and these were generally in the vicinity of simulated tracks, so the hits were likely altered by the mixing of simulated and real data. This does not appear to be a concern.
It may be an artifact of PID cuts...that's next to be examined...
______________________________
UPDATE (2013-08-02)
There is definitely something odd about dE/dx in sector 7. Here is a plot of <nσπ> vs. pT (error bars are RMS, not error-on-mean) for 4 parts of the west-bound (η>0), negatively-charged tracks:
- black: real data, excluding φ near sector 7
- blue: real data, φ near sector 7
- green: simulated data, exclude φ near sector 7
- red: simulated data, φ near sector 7
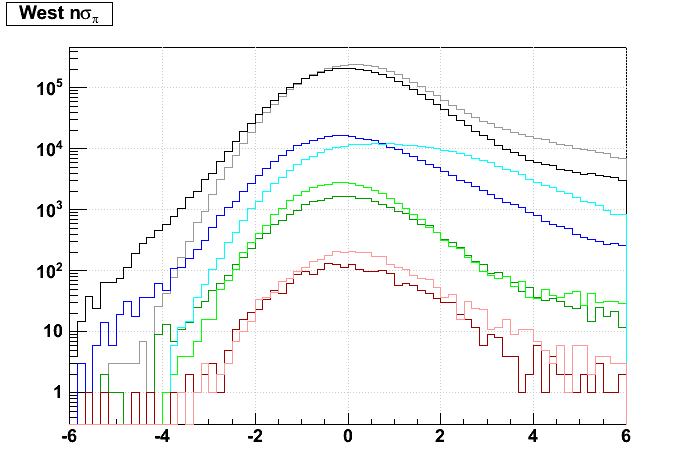
There is a clear shift in the sector 7 real data. Here now are the actual nσπ distributions for all 4 cases, where dark colors represent pT<0.5 GeV/c, and lighter colors are 0.5<pT<1.5 GeV/c. First plot is from SL12d_embed π- embedding sample, and second plot is from P12id production:
While mid-pT curves are different from low-pT due in large part to contamination from other species (more so in the real data than the simulation, which is embedded pions, though no cut was made to select only the resulting pions as opposed to secondaries), the light blue curve, for sector 7 mid-pT, shows a clearly different distribution from all the rest. And this effect is there in the P12id production, but not so much the simulated data for sector 7.
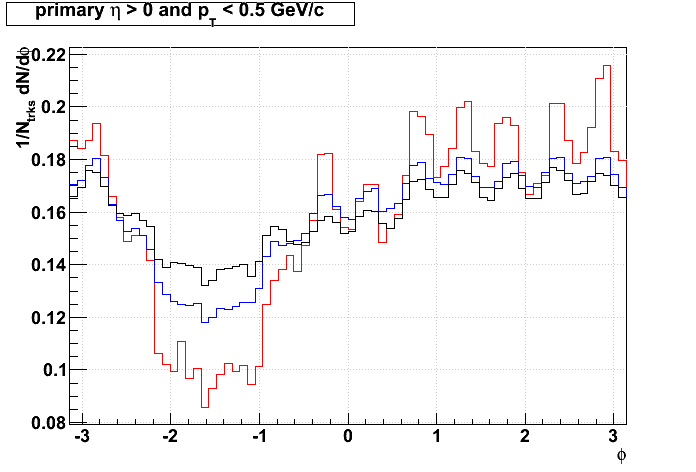
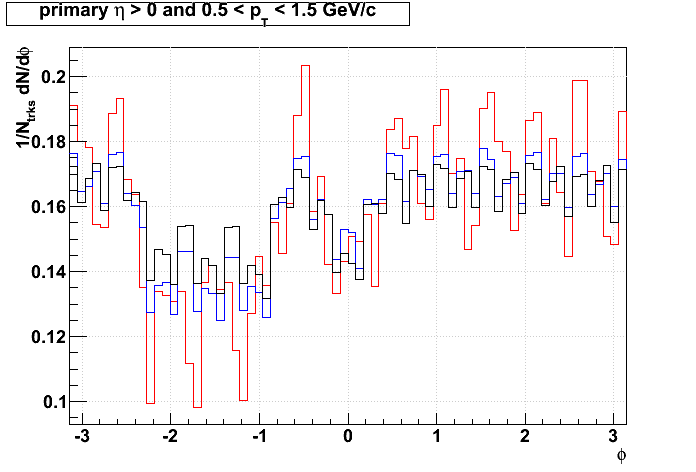
To get a better view, I looked at <nσπ> vs. φ and pT, as well as nσπ vs. φ at mid-pT, and the results show clearly that sector 7 has some unusually high nσπ:
In the below nσπ distribution plots, the profile of the histogram (i.e. the mean within these nσπ and mid-pT ranges) is shown as black points:
It is interesting to note that the simulated data does also have a slightly elevated nσπ in sector 7, but nowhere near as high as in the real data. It is also quite evident that a cut on |nσπ|<2, as used in the embedding QA, will be less efficient in the real data than in the simulated data, which is a problem for determining efficiencies from embedding!
____________
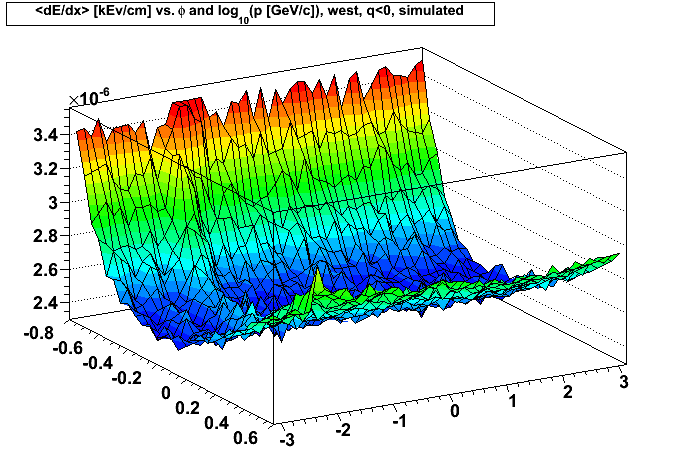
Looking directly at dE/dx
nσπ involves the dE/dx of tracks. So here then are some plots for dE/dx of the same data (colors are the same as before on the 1-D profile data, except that you will see for reasons explained in a moment that I have also grouped sector 6 along with sector 7):
Now it is clear that tracks going into sector 7 see larger dE/dx than tracks in other sectors. Some additional features observable:
- The simulated pions are thrown flatter in p than the p distribution of the real data, and so are weighted more heavily at high log10(p). This is not a problem
- The real data has bands from other species entering at mid-p, but the simulated data is predominantly pions. This shows up in the 1-D profile plot where the two curves for real data have bumps near log10(p) of 0.
- I have defined the φ of the track at the primary vertex. This implies a different range of φ values for tracks which are predominantly in sector 7 as a function of pT, and thus p. The result is that the elevated dE/dx band in the real data reaches over into the φ normally associated with sector 6 at low p, which is also why I grouped sector 6 with sector 7 in the previous dE/dx plots.
- The simulated data shows a hint of the same elevated dE/dx band, but clearly not to the same degree of elevation.
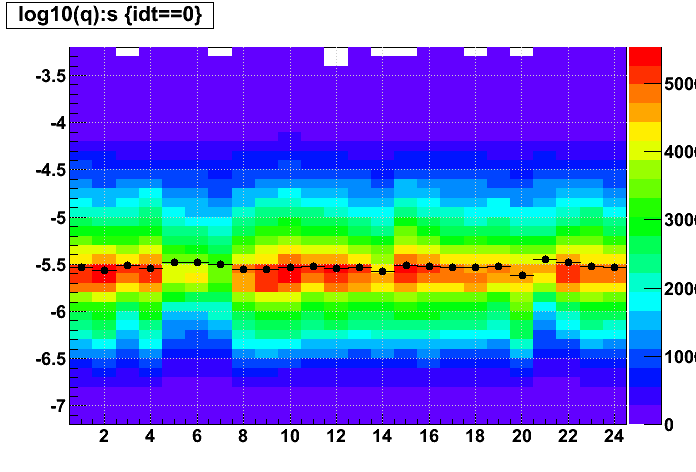
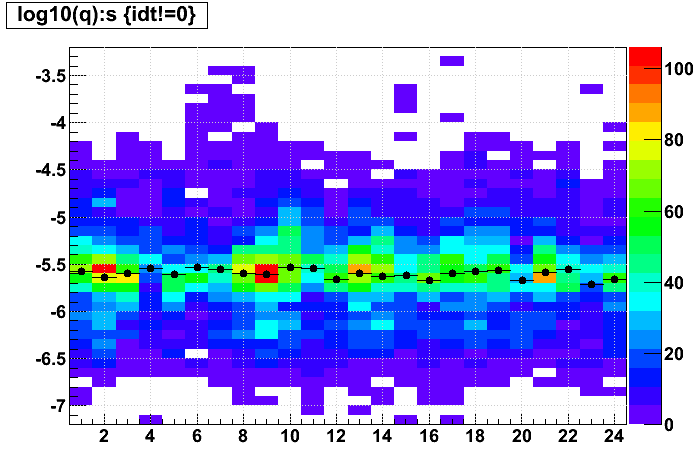
The hit charges show no obvious deviation for sector 7. One might say sectors 5,6,7 are all slightly elevated above other sectors, but the dE/dx issue is clearly only a problem for sector 7, not sectors 5 & 6, so the issue does not seem to be with the hit charge.
This leaves some issue with the calibration (or application thereof) of the dE/dx determination from hit charge in sector 7...
Groups:
- genevb's blog
- Login or register to post comments