GMT Pedestal STD issues
INTRODUCTION:
After Maxence showed me the distribution of STD (standard deviation) values that are used by the current GMT cluster finder, which spanned a rather large range of values, I became concerned that the method of doing single-event pedestals (PED) may not be providing sufficient accuracy of the pedestal STD. This can be relevant because a cut is placed on finding hits using pedestal-subtracted ADCs which are greater than 5*STD. An inaccurately small value of STD will lead to a lot of noise being reported as GMT signals, and an inaccurately larger STD will suppress real signals!
I processed a few thousand events from file st_physics_14109022_raw_7240005 to learn more.
CONCLUSIONS:
While the PED valus are reasonably calculated from single events (15 timebins), they can benefit from using a few events, and more importantly, we need to use at least a few events (perhaps 5) worth of data to get reasonable STD values.
Also, I see that the STD calculation is two-pass in order to find potential hits (outliers) and exclude them from the pedestal and STD calculation, using a cut on ADC - PED > 3*STD using PED and STD from a first non-exclusive pass. Signal exclusion is even more important for the STD calculation than the PED calculation, and must be better implemented than this as there are some real signals which are not presently being excluded.
I propose a possible improvement: the first 5 GMT-inclusive events be used to calculate the PED and STD values which then get used for the rest of the file. This means those PED and STD values are not available for the first 4 events. Since the fraction of GMT-inclusive events that have real signals is small, it is unlikely that any data is lost by simply not reporting any hits in those first 4 events. Should the STD calculation get an odd result due to a real signal in those first 5 events (and one could get fancy with figuring that out, but a STD value of larger than 75 seems like a reasonable flag) for an individual channel, then that channel would start over and use the next 5 events to recalculated PED and STD. The rest of the channels would be ready for use.
DETAILS:
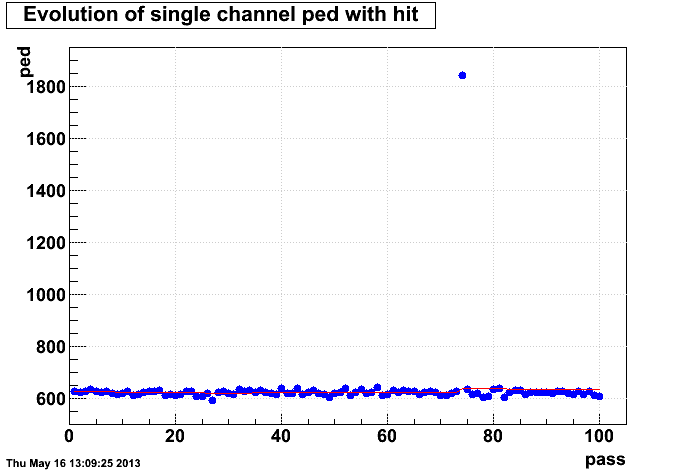
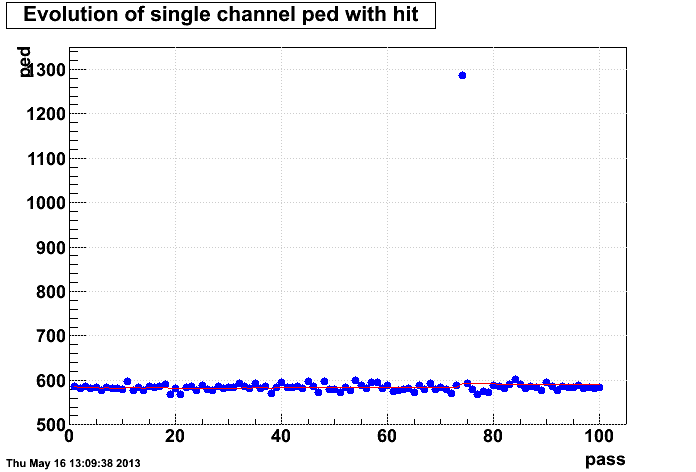
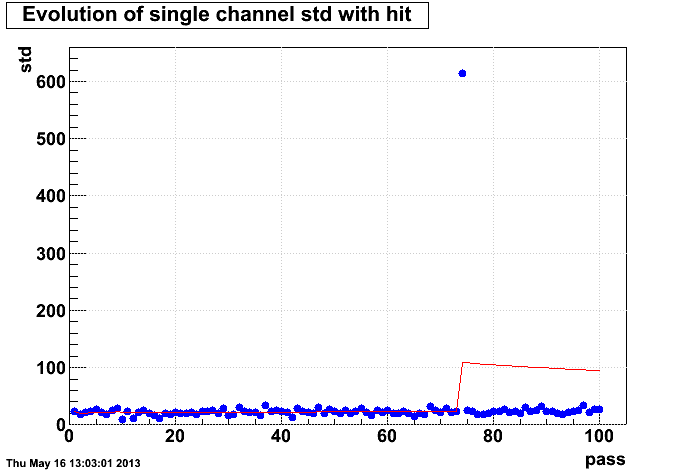
In all plots, blue points represent single-event calculations of STD and PED (utilizing 15 timebins of ADC values), while the multi-event calculations are shown in red.
Here are examples of the evolution of PED and STD versus events that have GMT data (e.g. "pass" at calculating the values), looking at just a single channel:
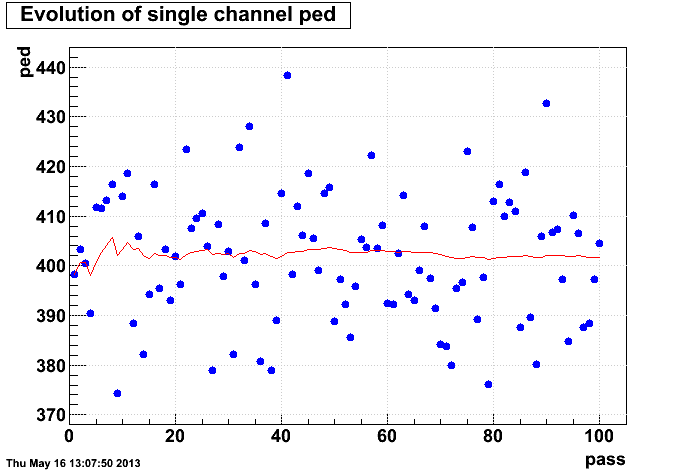
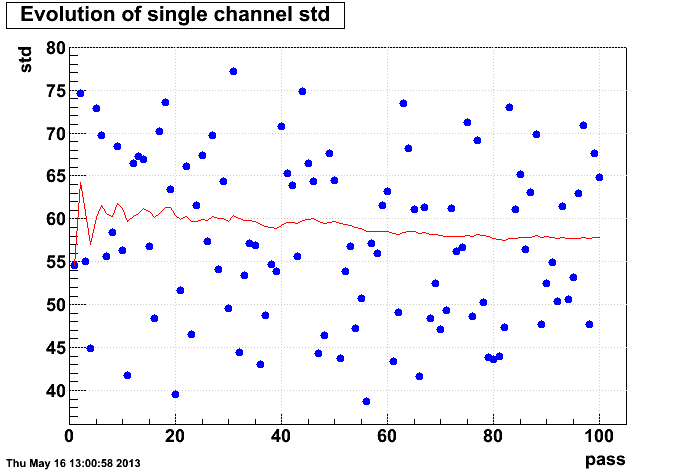
While the single-event PED has some spread, that spread isn't on the order of a real signal. However, the single-event STD can easily be a factor of ±30% off.
Here are "profs" plots of PED and STD values using all channels, versus pass number for the first 15 passes (error bars represent the "spread" in values):
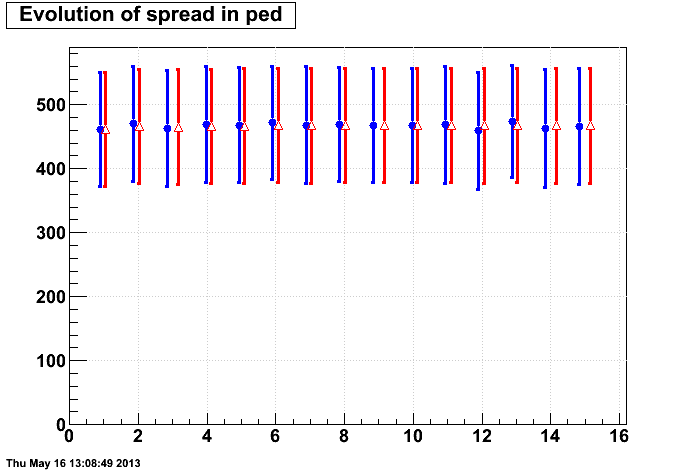
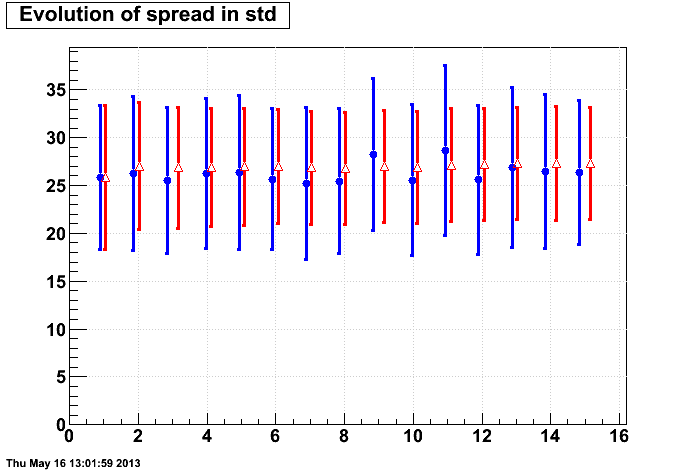
Again, PED doesn't show any significant change in spreads. STD shows a notable reduction in spread within a few events. On this plot, it doesn't look like that reduction matters much. But this obscures what is happening to individual channels.
Here are the distributions of all PED and STD values, where red now represent the multi-event results afer the 100th pass, and green is after just the 5th pass:
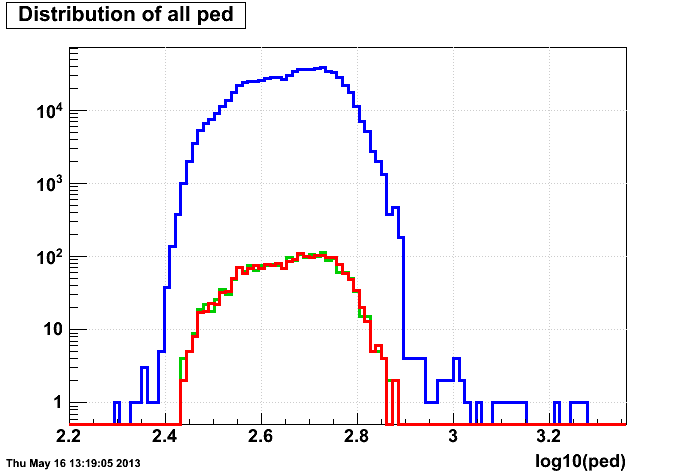
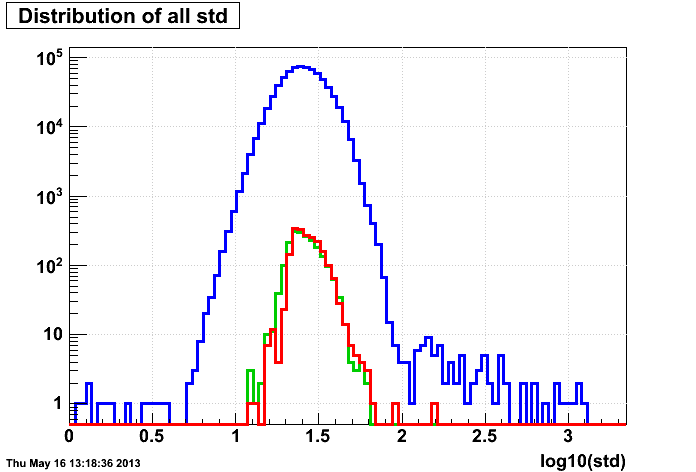
First, one can see in the single-event calculations two classes of problems which led to this investigation: (1) outliers at low and high STD, and (2) even the non-outliers have a large range of values.
It is evident that outliers of both PED and STD are eradicated by using just 5 passes (so both PED and STD benefit!), and that the range of the STD values is significantly reduced. Going to 100 passes doesn't improve much upon 5 in any way, and in fact some new outliers in STD are introduced! These are two channels that have real signals, which clearly ruin the existing non-signal-excluding STD calculation, principally because these deviations come in as the square of their difference from the mean. The real signals come later than the 5th event, so the 5-event calculations do not have the outliers.
Here are the PED and STD evolutions for these two channels that have clear real signals:
(NOTE: in these two clear signal occurences, neither are reported with the current code because the signal-pedestal is less than 5*STD! ...and they are not excluded from the PED and STD second-pass calculation because signal-pedestal is even less than 3*STD!):
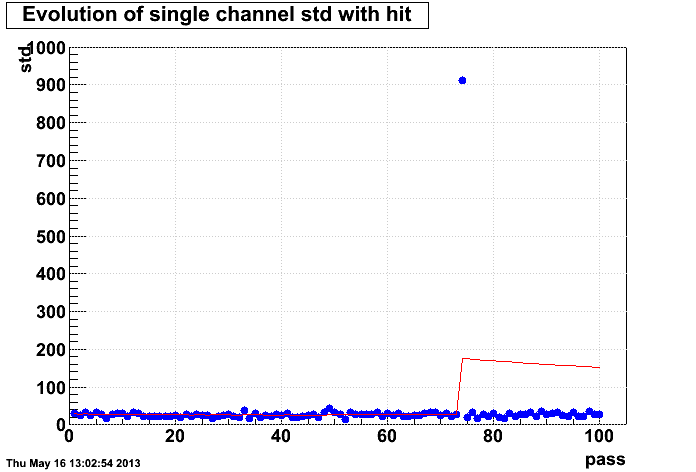
...and the second:
-Gene
Groups:
- genevb's blog
- Login or register to post comments
