- genevb's home page
- Posts
- 2025
- 2024
- 2023
- 2022
- September (1)
- 2021
- 2020
- 2019
- December (1)
- October (4)
- September (2)
- August (6)
- July (1)
- June (2)
- May (4)
- April (2)
- March (3)
- February (3)
- 2018
- 2017
- December (1)
- October (3)
- September (1)
- August (1)
- July (2)
- June (2)
- April (2)
- March (2)
- February (1)
- 2016
- November (2)
- September (1)
- August (2)
- July (1)
- June (2)
- May (2)
- April (1)
- March (5)
- February (2)
- January (1)
- 2015
- December (1)
- October (1)
- September (2)
- June (1)
- May (2)
- April (2)
- March (3)
- February (1)
- January (3)
- 2014
- December (2)
- October (2)
- September (2)
- August (3)
- July (2)
- June (2)
- May (2)
- April (9)
- March (2)
- February (2)
- January (1)
- 2013
- December (5)
- October (3)
- September (3)
- August (1)
- July (1)
- May (4)
- April (4)
- March (7)
- February (1)
- January (2)
- 2012
- December (2)
- November (6)
- October (2)
- September (3)
- August (7)
- July (2)
- June (1)
- May (3)
- April (1)
- March (2)
- February (1)
- 2011
- November (1)
- October (1)
- September (4)
- August (2)
- July (4)
- June (3)
- May (4)
- April (9)
- March (5)
- February (6)
- January (3)
- 2010
- December (3)
- November (6)
- October (3)
- September (1)
- August (5)
- July (1)
- June (4)
- May (1)
- April (2)
- March (2)
- February (4)
- January (2)
- 2009
- November (1)
- October (2)
- September (6)
- August (4)
- July (4)
- June (3)
- May (5)
- April (5)
- March (3)
- February (1)
- 2008
- 2005
- October (1)
- My blog
- Post new blog entry
- All blogs
2013 Beam Position Monitor data
Updated on Thu, 2013-10-24 15:57. Originally created by genevb on 2013-10-24 13:05.
Similar to another blog entry about observations at STAR, this blog entry is in the vein of trying to understand a possible change in the collision environment at STAR around the time of the PXL insertion (day 128 or 129, or May 8th or 9th) during Run 13. Here I will take a look at Beam Position Monitor (BPM) data.
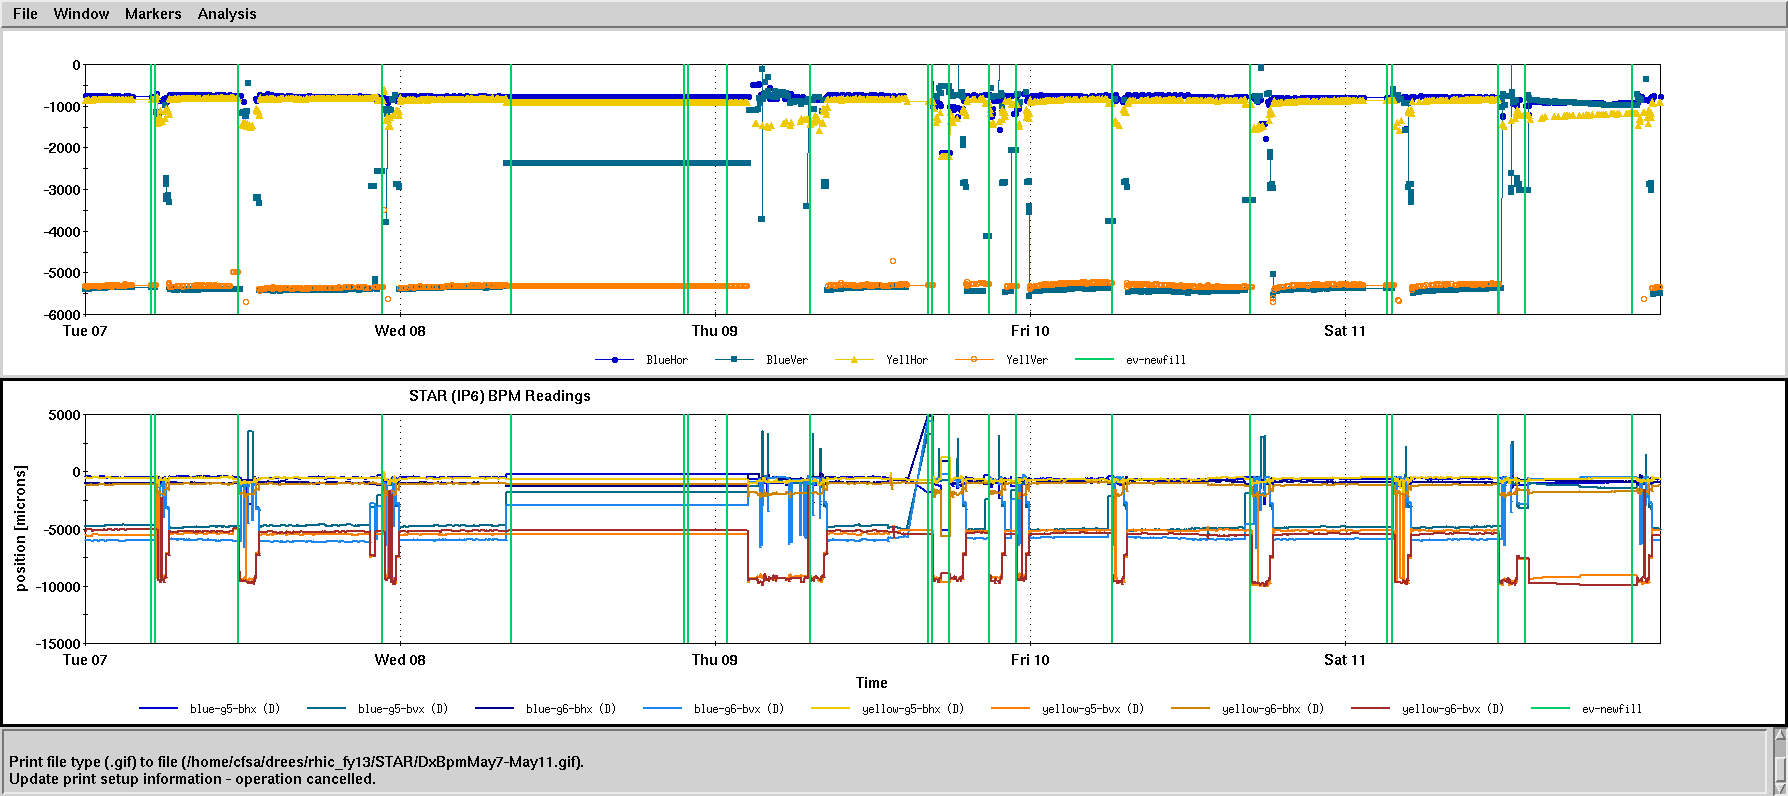
In the past, I requested BPM data from C-AD (Angelika Drees), who would make plots for me. I did the same this year, asking her whether any changes occurred in the beam positions at STAR around the days in question. She sent the following plot, from which neither of us discerned any notable changes (vertical axis is in microns; open the image in a new window/tab to see full resolution):
Angelika also noted that STAR has access to the data and may also be recording it. Sure enough, I found this to be true (see here, and particularly here). I put this data into an ntuple and started making plots. Each beam (x2) is monitored for vertical and horizontal positions (x2) on either side of STAR (x2), so 2x2x2 = 8 channels of relevant beam position data. As the observed issue is with the vertical positon of the beam, I will plot here the 4 vertical positions of the blue & yellow beams at positions 5 & 6, using the same color scheme as in Angelika's plot, but for the entire Run 13:
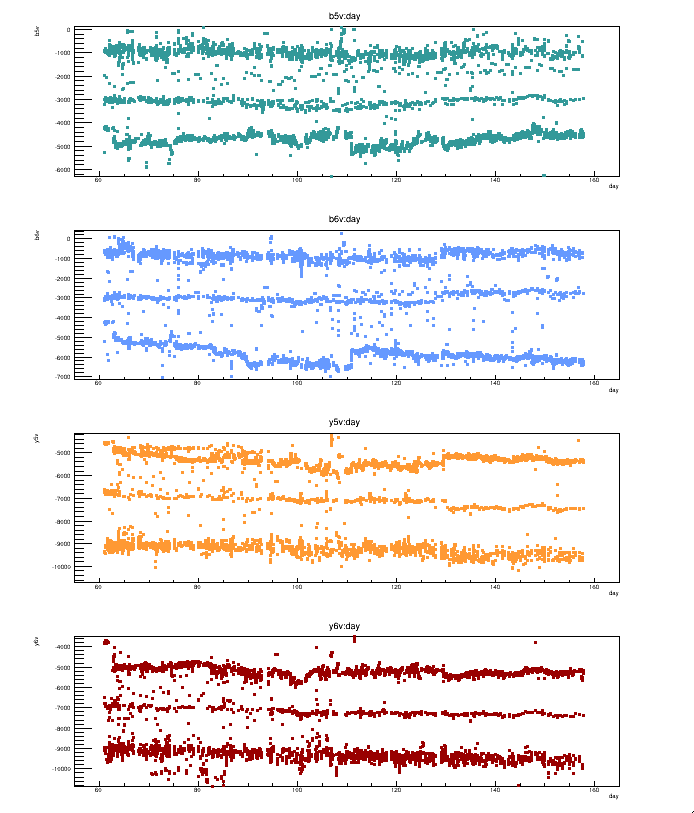
To interpret these plots, one needs to understand the multiple bands. In the case of the two blue beam positions (upper two panels), the beams are colliding when they are at the lowest vertical positions, and not colliding in the uppermost. The middle band appears to be at the preparation-for-collision stage near the start of each fill. The yellow beam (lower two panels) is reversed: high when colliding, low when not (this makes a little more sense when you put them on the same plot as Angelika did, vertically separating the beams and bringing them together for collision).
While there are a few things that happen in the plots, we do see some shifts right around day 129, each of which are a few hundred microns:
______
We can further replicate what Angelika showed by taking the average of the positions at 5 & 6 to obtain "BlueVer" and "YellVer" (again, same colors as her plot), and can additional take the position 6 minus 5 difference to see how slope can be affected. For these plots, I have cut to include only beam positions consistent with colliding.
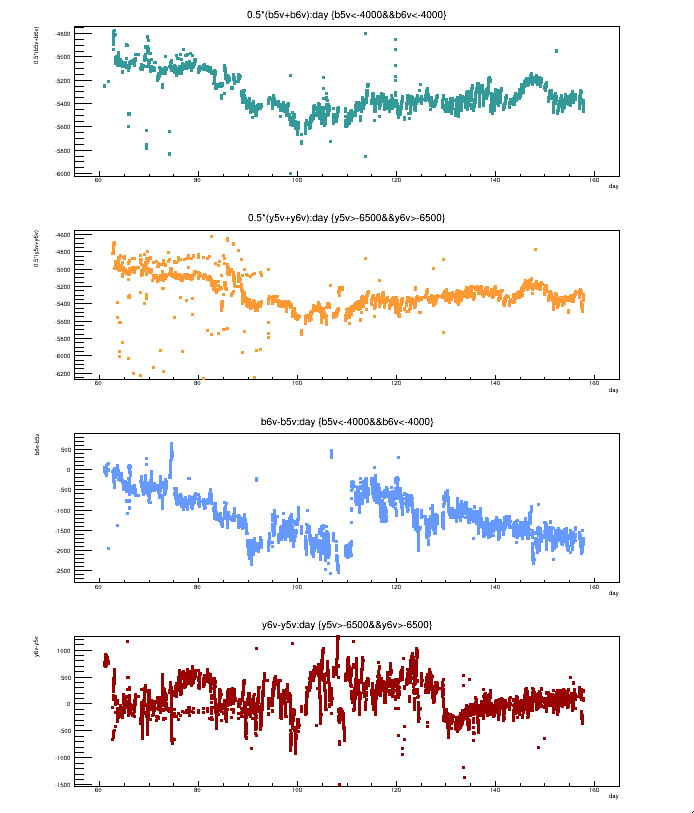
The two beams seem to go up and down together of the course of Run 13, and, as expected from the invidivual channels, there is no notable shift in either beam's average position (blue, yellow) around day 129. There is a very clear shift in yellow's slope, though the magnitude of that shift requires knowing the separation between the BPM 5 & 6 positions along the beamline. But this does indicate a possible change in the collision environment at STAR around the time in question, and the initial BeamLine calibration studies have shown a step in the slope (as well as the intercept) at that time.
It should be pointed out that there is also a notable shift in blue's slope around day 111 (April 21), but there were no corresponding notable steps in the calibration results around that day. Curiously, blue's slope is also showing an otherwise rather continual downward trend over the course of the Run.
______
Any feedback on these or other features in the above plots is welcome.
-Gene
In the past, I requested BPM data from C-AD (Angelika Drees), who would make plots for me. I did the same this year, asking her whether any changes occurred in the beam positions at STAR around the days in question. She sent the following plot, from which neither of us discerned any notable changes (vertical axis is in microns; open the image in a new window/tab to see full resolution):
Angelika also noted that STAR has access to the data and may also be recording it. Sure enough, I found this to be true (see here, and particularly here). I put this data into an ntuple and started making plots. Each beam (x2) is monitored for vertical and horizontal positions (x2) on either side of STAR (x2), so 2x2x2 = 8 channels of relevant beam position data. As the observed issue is with the vertical positon of the beam, I will plot here the 4 vertical positions of the blue & yellow beams at positions 5 & 6, using the same color scheme as in Angelika's plot, but for the entire Run 13:
To interpret these plots, one needs to understand the multiple bands. In the case of the two blue beam positions (upper two panels), the beams are colliding when they are at the lowest vertical positions, and not colliding in the uppermost. The middle band appears to be at the preparation-for-collision stage near the start of each fill. The yellow beam (lower two panels) is reversed: high when colliding, low when not (this makes a little more sense when you put them on the same plot as Angelika did, vertically separating the beams and bringing them together for collision).
While there are a few things that happen in the plots, we do see some shifts right around day 129, each of which are a few hundred microns:
- upward for blue @ 6 when not colliding
- upward for yellow @ 5 when colliding
- downward for yellow @ 6 when colliding
______
We can further replicate what Angelika showed by taking the average of the positions at 5 & 6 to obtain "BlueVer" and "YellVer" (again, same colors as her plot), and can additional take the position 6 minus 5 difference to see how slope can be affected. For these plots, I have cut to include only beam positions consistent with colliding.
The two beams seem to go up and down together of the course of Run 13, and, as expected from the invidivual channels, there is no notable shift in either beam's average position (blue, yellow) around day 129. There is a very clear shift in yellow's slope, though the magnitude of that shift requires knowing the separation between the BPM 5 & 6 positions along the beamline. But this does indicate a possible change in the collision environment at STAR around the time in question, and the initial BeamLine calibration studies have shown a step in the slope (as well as the intercept) at that time.
It should be pointed out that there is also a notable shift in blue's slope around day 111 (April 21), but there were no corresponding notable steps in the calibration results around that day. Curiously, blue's slope is also showing an otherwise rather continual downward trend over the course of the Run.
______
Any feedback on these or other features in the above plots is welcome.
-Gene
»
- genevb's blog
- Login or register to post comments