- genevb's home page
- Posts
- 2025
- 2024
- 2023
- 2022
- September (1)
- 2021
- 2020
- 2019
- December (1)
- October (4)
- September (2)
- August (6)
- July (1)
- June (2)
- May (4)
- April (2)
- March (3)
- February (3)
- 2018
- 2017
- December (1)
- October (3)
- September (1)
- August (1)
- July (2)
- June (2)
- April (2)
- March (2)
- February (1)
- 2016
- November (2)
- September (1)
- August (2)
- July (1)
- June (2)
- May (2)
- April (1)
- March (5)
- February (2)
- January (1)
- 2015
- December (1)
- October (1)
- September (2)
- June (1)
- May (2)
- April (2)
- March (3)
- February (1)
- January (3)
- 2014
- December (2)
- October (2)
- September (2)
- August (3)
- July (2)
- June (2)
- May (2)
- April (9)
- March (2)
- February (2)
- January (1)
- 2013
- December (5)
- October (3)
- September (3)
- August (1)
- July (1)
- May (4)
- April (4)
- March (7)
- February (1)
- January (2)
- 2012
- December (2)
- November (6)
- October (2)
- September (3)
- August (7)
- July (2)
- June (1)
- May (3)
- April (1)
- March (2)
- February (1)
- 2011
- November (1)
- October (1)
- September (4)
- August (2)
- July (4)
- June (3)
- May (4)
- April (9)
- March (5)
- February (6)
- January (3)
- 2010
- December (3)
- November (6)
- October (3)
- September (1)
- August (5)
- July (1)
- June (4)
- May (1)
- April (2)
- March (2)
- February (4)
- January (2)
- 2009
- November (1)
- October (2)
- September (6)
- August (4)
- July (4)
- June (3)
- May (5)
- April (5)
- March (3)
- February (1)
- 2008
- 2005
- October (1)
- My blog
- Post new blog entry
- All blogs
Slope of dE/dx vs. drift distance from QA in nightly test jobs
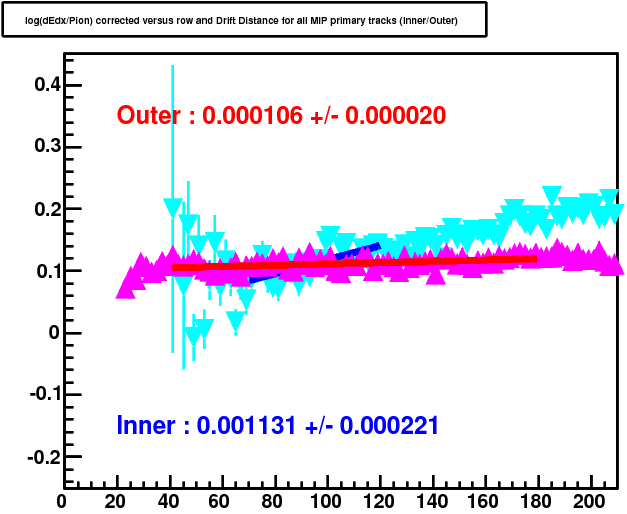
Following up on the request to include in Offline QA a plot monitoring slope of dE/dx vs. drift distance in the TPC [see here], the code was run in last night's DEV tests for the first time. I generated the QA histograms, of which here is an example of what the Offline QA shift will see, from a randomly selected nightly test:
The QA code prints out the slopes, just like the dE/dx maker does, so one can grab these slope numbers from the logs for either the QA histogram-generation jobs or the production jobs. Here are plots of these slopes vs. run number:
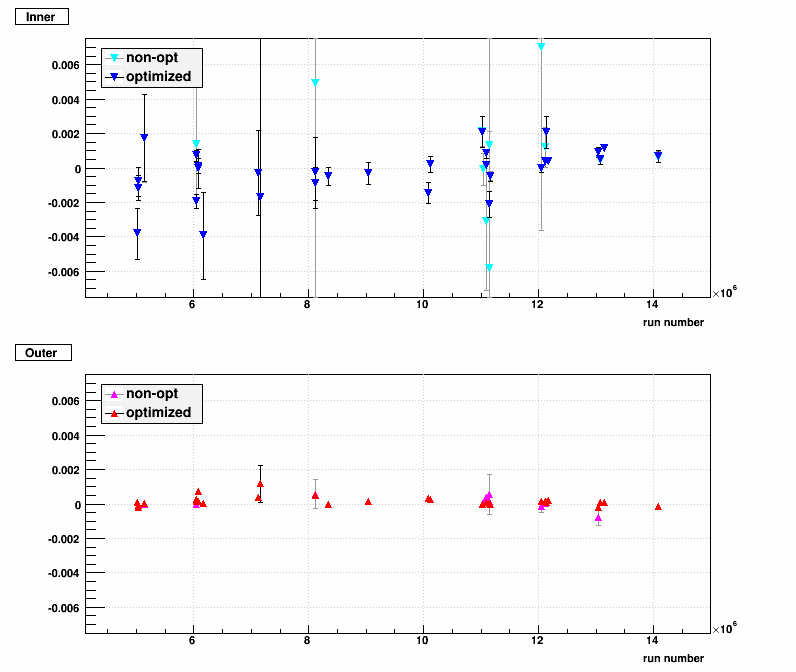
There are actually a lot of non-optimized jobs whose results are nearly identical to the optimized job from the same data, and whose points in the above plots are simply obscured by the points from the optimized jobs.
The script I used to extract and generate this information is in an attached text file, commands.txt.gz.
-Gene
Groups:
- genevb's blog
- Login or register to post comments