- genevb's home page
- Posts
- 2025
- 2024
- 2023
- 2022
- September (1)
- 2021
- 2020
- 2019
- 2018
- 2017
- December (1)
- October (3)
- September (1)
- August (1)
- July (2)
- June (2)
- April (2)
- March (2)
- February (1)
- 2016
- November (2)
- September (1)
- August (2)
- July (1)
- June (2)
- May (2)
- April (1)
- March (5)
- February (2)
- January (1)
- 2015
- December (1)
- October (1)
- September (2)
- June (1)
- May (2)
- April (2)
- March (3)
- February (1)
- January (3)
- 2014
- 2013
- 2012
- 2011
- January (3)
- 2010
- February (4)
- 2009
- 2008
- 2005
- October (1)
- My blog
- Post new blog entry
- All blogs
Collisions with the local clock
Updated on Sat, 2021-03-13 16:13. Originally created by genevb on 2021-03-11 01:05.
Outline:
I. Introduction
II. Trigger detector features
III. Excluding events with few prompt hits
IV. First look at prompt hit time shifts
V. Excluding events with very early BBC times
VI. Conclusion
Please note that all plots on this page may be opened in a separate browser window/tab to see a larger version. Also, given that I accidentally mixed up BBC and ZDC when I made the plots for this data, the image filenames may say "ZDC" when they are in fact "BBC" (sorry!).
I. Introduction
This study began with an interest in seeing whether using the local clock (9.340 MHz, using run 22066023) resulted in a different time offset from the trigger for any part of the TPC compared to using the RHIC clock (9.332 MHz for AuAu 7.7 GeV collisions, using run 22066021), as there was concern that the clock was perhaps causing a 1-time-bucket shift for the start time of the TPC readout in trying to understand difficulties with Run 19 TPC alignment.
With the low energy collisions of BES-II, the bunches are quite long as part of the effort to get as high luminosities as possible. A side effect of this is that collisions are spread out in both longitude and time. The longitudinal spreading can contribute to time-of-flight delays for hits in the TPC, and the existing track reconstruction does attempt a (pion assumed) correction to the hit positions at the final fitting stage to account for this. However, the spread in collision times results in a large-scale shift of the two halves of the TPC toward or apart from each other if the readout start is based on a clock and not the actual collision time. With small bunches, this has always been considered a negligible sub-1-mm effect for STAR, but this becomes a multi-mm effect in BES-II. This smearing can contribute to obscuring any timing shifts from which clock is used, so I set about trying to do an event-by-event T0 correction before looking for time shifts based on previous work I had started.
For this study, I looked at 4 possible measures of the collision time with respect to the clock in this data (ZDC information was absent):
II. Trigger detector features
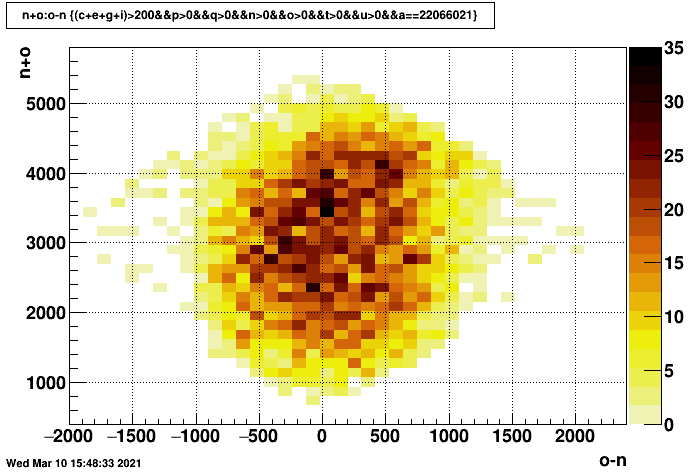
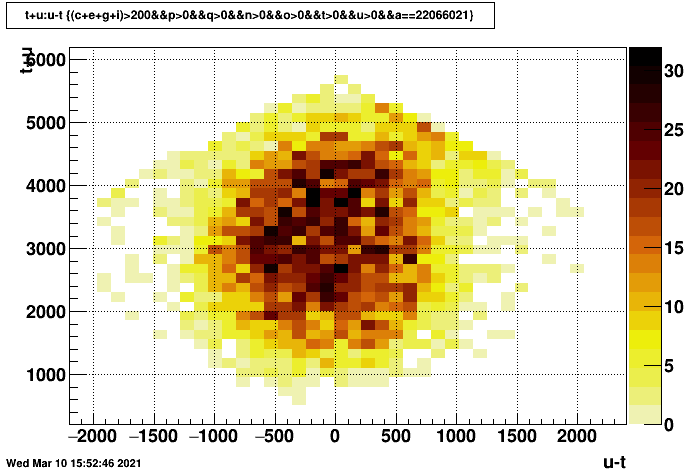
After some problematic attempts to just use these somewhat blindly and seeing confusing results, I decided to take a closer look at what the three trigger detector sets can tell me about each other. First here are the sum of east and west (expected to be linear with the collision time to first order) vs. difference of west minus east (expected to be linear with the vertex z to first order). The units on all axes are [TAC counts].
There are some very curious features there, particularly in the EPD and BBC, which I do not fully understand. Keep in mind that a high TAC sum is actually an early time (it's backwards), so the odd bands seem to be mostly when the west side EPD and BBC are early, but if you look carefully there is a much less prominent band for the early east sides as well. The VPD does not show this feature. It is also very interesting to note that the features are there regardless of clock, so they are some other property of the data.
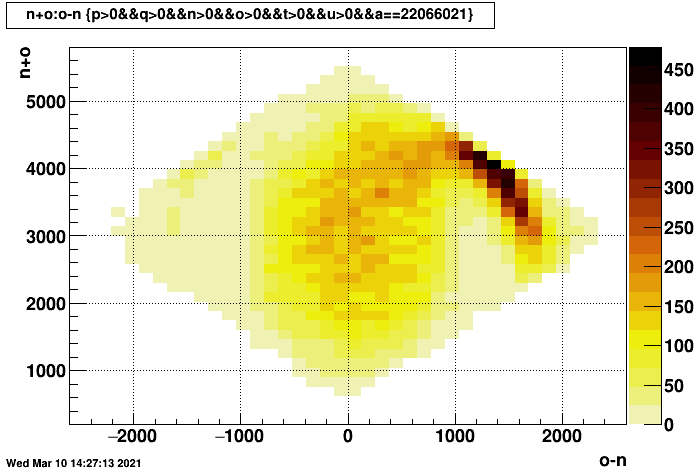
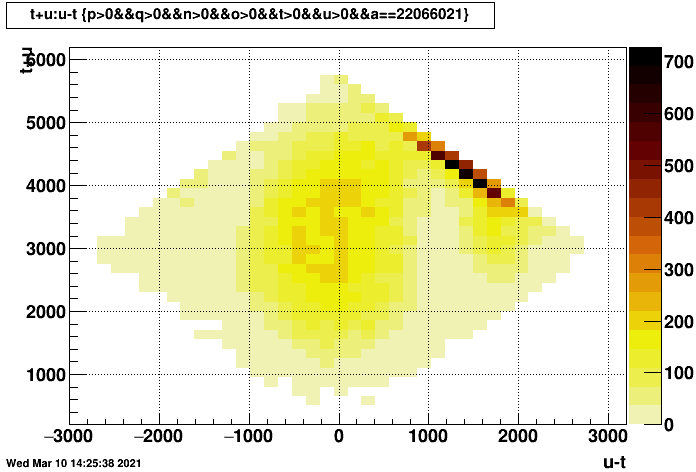
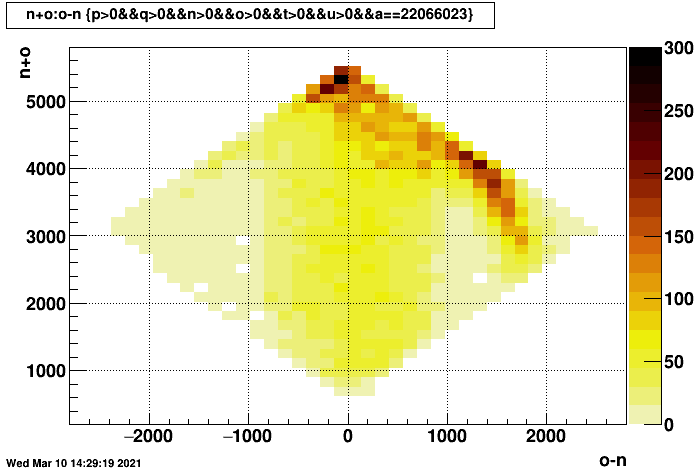
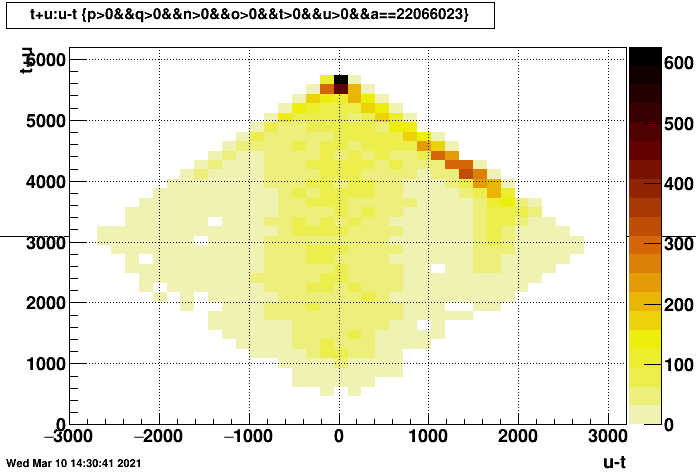
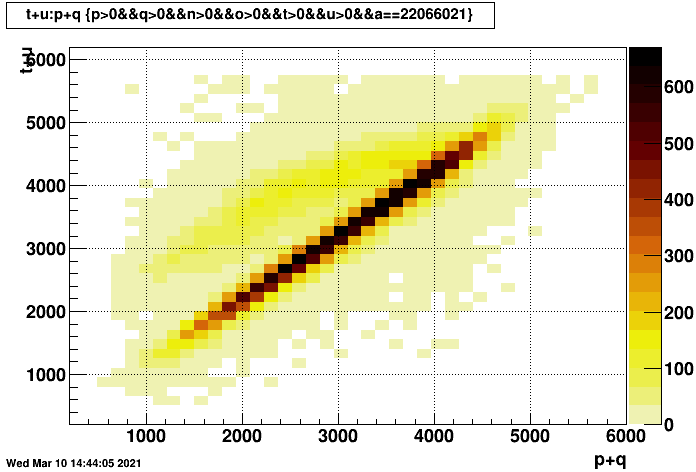
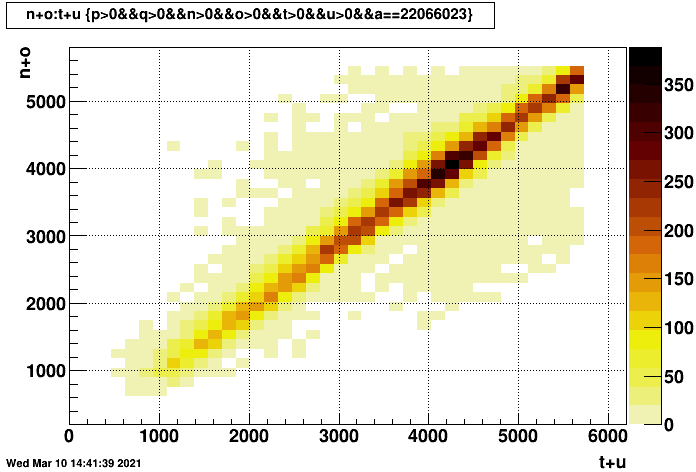
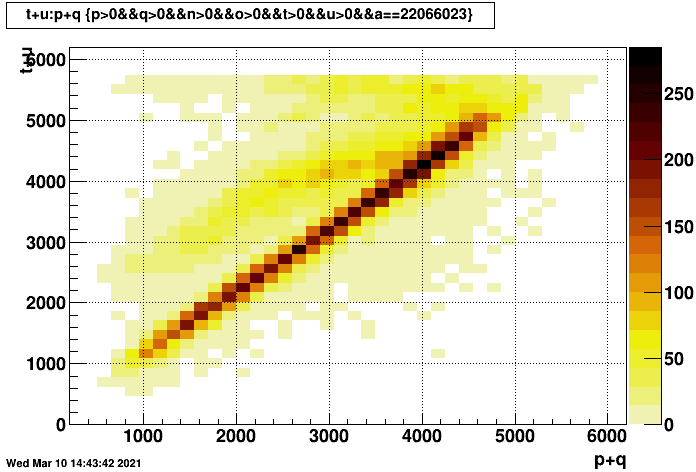
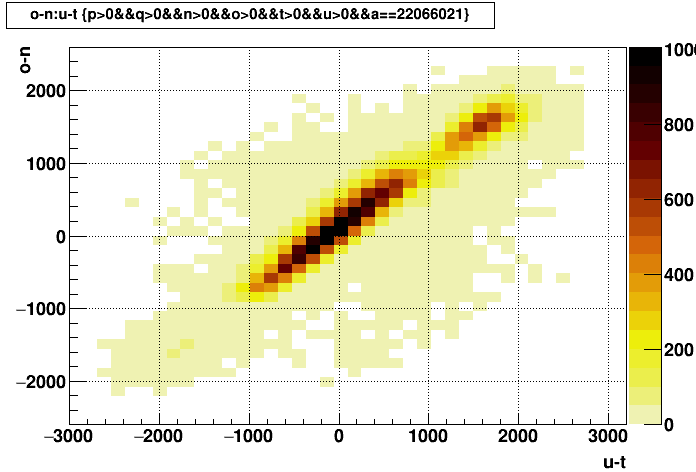
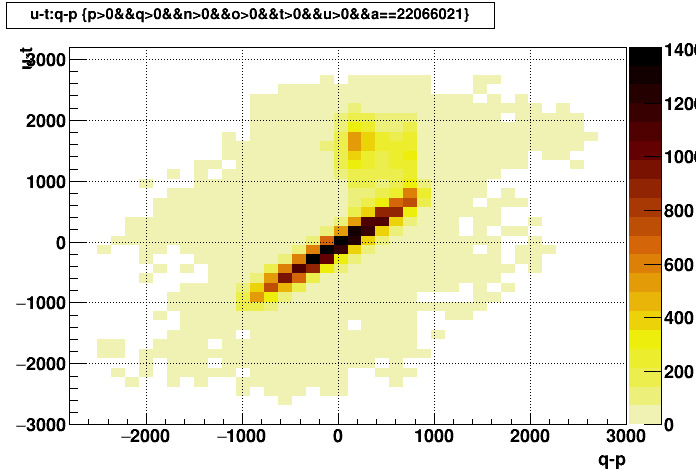
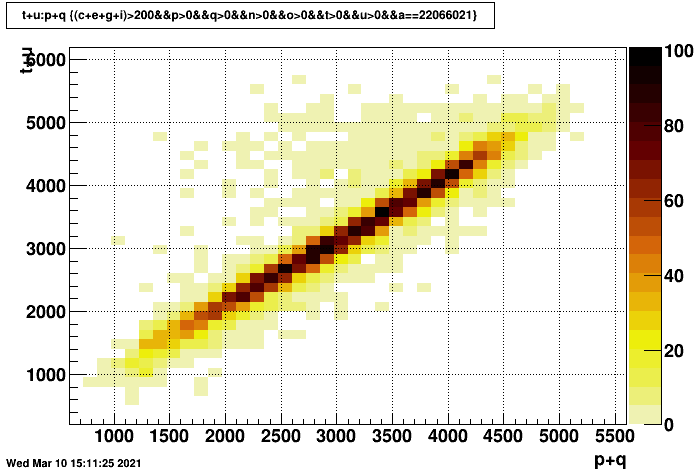
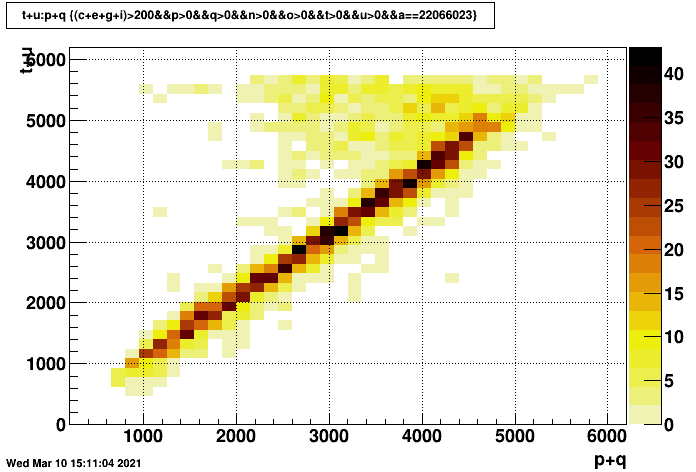
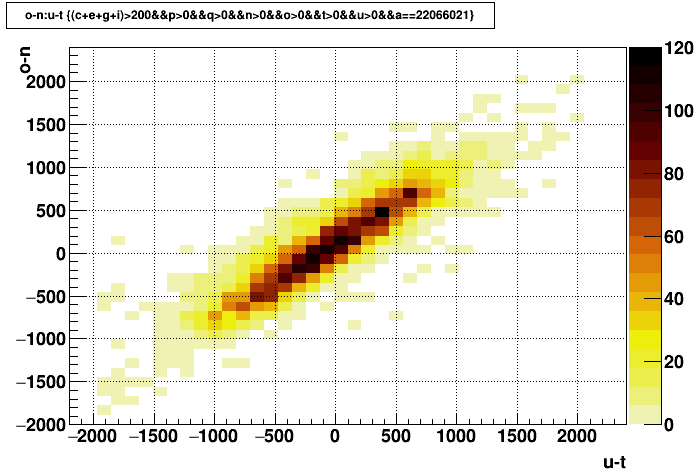
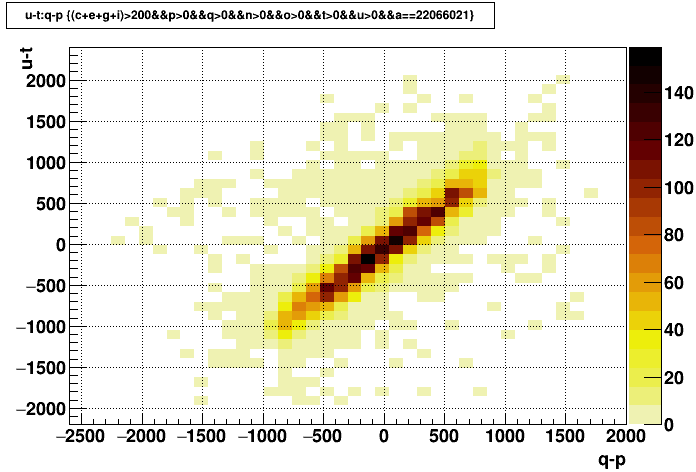
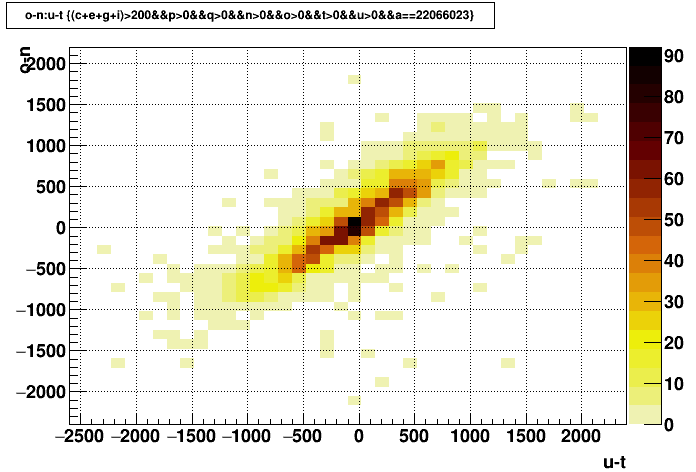
The following plots may help someone sometime understand what is happening, but they did not help me. These are the sums and differences of each detector vs. the others (units are again [TAC counts]). I found it particularly confusing that despite the VPD being the cleanest in the above plots, it is the EPD and BBC which appear most consistent with each other, so the cause would have to be common to both of them.
III. Excluding events with few prompt hits
After some digging, I noticed that most of the features went away when I placed cuts on the TPC prompt hits. So I plotted similar sum vs. difference plots to above, but here the color of the points represents few [yellow] to many [brown and black] TPC prompt hits (units are again [TAC counts]). The side bands are all at few TPC prompt hits and can be generally excluded with cuts on having hundreds of hits as I usually do for my prompt hit timing studies anyhow.
There seem to be too many events in these feature bands to be due to special triggers in the st_physics files as the minbias triggers dominate. So it remains a mystery to me what these low-prompt-hit events are.
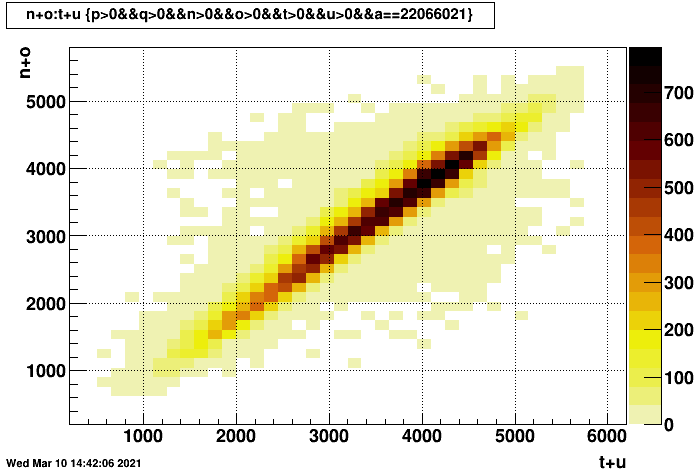
Anyhow, here again are the earlier sets of trigger detector plots, but with a cut on at least 200 TPC prompt hits showing much better behavior (units are [TAC counts]).
IV. First look at prompt hit time shifts
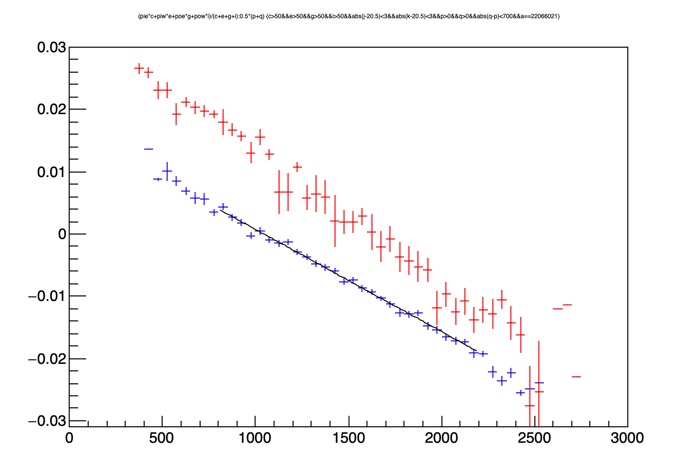
Now I was ready to look at the average time from TPC prompt hits vs. a trigger detector so that I could determine the event-by-event correction. In addition to cutting on some minimum number of prompt hits, I also cut on the absolute value of the time difference of the VPD signals to further reduce the earlier-seen sidebands which may be at far collision vertex z (I placed a cut at 700 TAC counts for the difference, which I believe corresponds to approximately ±180 cm). Here are the distributions, with the <TPC> in units of [μs] and the trigger detectors in units of [TAC counts].
Things look pretty straightforward in the RHIC clock data, but the local clock data has some class of events that fall below the main curve. For the VPD, it is rather spread out. For the EPD, a cut isn't so clear either. But for the BBC, it seems generally isolated to the high end of the distribution. To make this more clear, I fit [black line] the profile of the RHIC clock distribution [blue], showing the local clock profile [red] on the same plot (below left). Note the local clock profile only looks clean at the low end of the TAC distribution, and the rest is what we need to clean up. The same data, but fit-subtracted is shown as both a profile (middle) and scatter plot (right), where one can see the events in the local clock data [red] below the main line. These three plots also obviate that I will see some time difference between the RHIC and local clock data!
This fit indicated a 0.0164 μs/TAC count unit scale factor for the VPD, and I subtracted the fit from subsequent prompt hit measurements. Here is the profile of the fit-subtracted local clock distribution of vs. <BBC>:
From this, I conclude that cutting on <BBC> below 1900 TAC counts should allow me to get rid of the unwanted class of events. However, this does not mean I understand what these events are; they represent a second mystery, specific to the local clock data!
V. Excluding events with very early BBC times
Here now are 5 plots showing the fit-subtracted <TPC> [μs] data vs. <VPD> [TAC counts] for the whole TPC as well as some subsets, showing that I have essentially corrected for the event-by-event T0s by removing (nearly) all trigger detector dependencies. (Please ignore the offsets from zero as I did not fully attempt to adjust for any timing offsets in the prompt hits; the dependencies and difference between local clock and RHIC clock are all that matters.)
VI. Conclusion
In conclusion, using the whole TPC data, I see what appears to be a uniform 14.1 ± 0.2 ns T0 shift in all parts of the TPC when using the local clock instead of the RHIC clock. There were no signs of a 1-time-bucket (~107 ns) time shift in any parts of the TPC. There were, however, two sets of mysterious events which I had to exclude from my analysis, one of which was visible in the trigger detectors regardless of the clock used, and the other was specific to using the local clock.
I should also note that while I did not look sector-by-sector, Yuri Fisyak also looked a little bit at the same local clock data and presented it at the 2021-03-10 You do not have access to view this node meeting. He did not see any sector-by-sector differences. He did catch a glimpse of the event-by-event T0 offsets as a <VPD> time dependence (i.e. the event-by-event T0 correction I sought to apply in my study), and saw sector-by-sector differences that were not related to the change of clock.
-Gene
I. Introduction
II. Trigger detector features
III. Excluding events with few prompt hits
IV. First look at prompt hit time shifts
V. Excluding events with very early BBC times
VI. Conclusion
Please note that all plots on this page may be opened in a separate browser window/tab to see a larger version. Also, given that I accidentally mixed up BBC and ZDC when I made the plots for this data, the image filenames may say "ZDC" when they are in fact "BBC" (sorry!).
I. Introduction
This study began with an interest in seeing whether using the local clock (9.340 MHz, using run 22066023) resulted in a different time offset from the trigger for any part of the TPC compared to using the RHIC clock (9.332 MHz for AuAu 7.7 GeV collisions, using run 22066021), as there was concern that the clock was perhaps causing a 1-time-bucket shift for the start time of the TPC readout in trying to understand difficulties with Run 19 TPC alignment.
With the low energy collisions of BES-II, the bunches are quite long as part of the effort to get as high luminosities as possible. A side effect of this is that collisions are spread out in both longitude and time. The longitudinal spreading can contribute to time-of-flight delays for hits in the TPC, and the existing track reconstruction does attempt a (pion assumed) correction to the hit positions at the final fitting stage to account for this. However, the spread in collision times results in a large-scale shift of the two halves of the TPC toward or apart from each other if the readout start is based on a clock and not the actual collision time. With small bunches, this has always been considered a negligible sub-1-mm effect for STAR, but this becomes a multi-mm effect in BES-II. This smearing can contribute to obscuring any timing shifts from which clock is used, so I set about trying to do an event-by-event T0 correction before looking for time shifts based on previous work I had started.
For this study, I looked at 4 possible measures of the collision time with respect to the clock in this data (ZDC information was absent):
- Average of east and west VPD earliest TAC
- Average of east and west EPD earliest TAC
- Average of east and west BBC earliest TAC
- Average TPC prompt hit times
II. Trigger detector features
After some problematic attempts to just use these somewhat blindly and seeing confusing results, I decided to take a closer look at what the three trigger detector sets can tell me about each other. First here are the sum of east and west (expected to be linear with the collision time to first order) vs. difference of west minus east (expected to be linear with the vertex z to first order). The units on all axes are [TAC counts].
| sum vs. diff | VPD | EPD | BBC |
|---|---|---|---|
| RHIC clock | 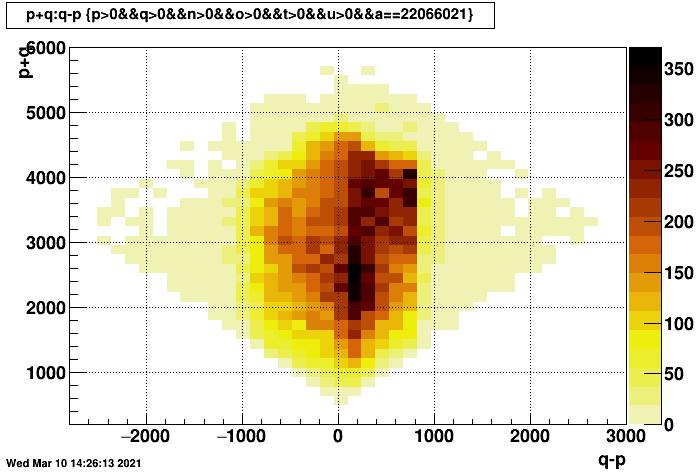 |
 |
 |
| local clock | 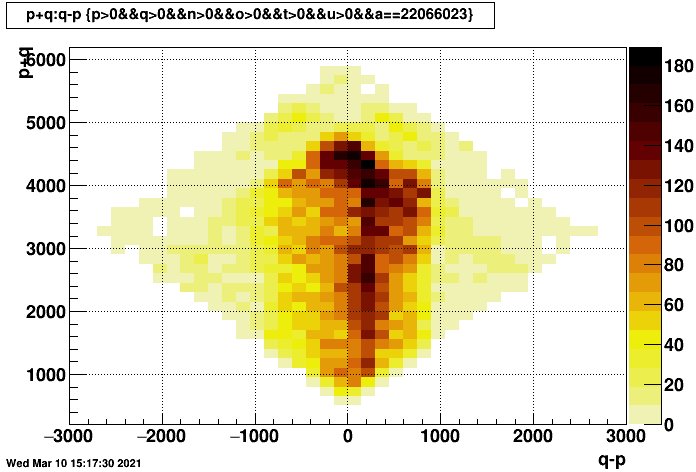 |
 |
 |
There are some very curious features there, particularly in the EPD and BBC, which I do not fully understand. Keep in mind that a high TAC sum is actually an early time (it's backwards), so the odd bands seem to be mostly when the west side EPD and BBC are early, but if you look carefully there is a much less prominent band for the early east sides as well. The VPD does not show this feature. It is also very interesting to note that the features are there regardless of clock, so they are some other property of the data.
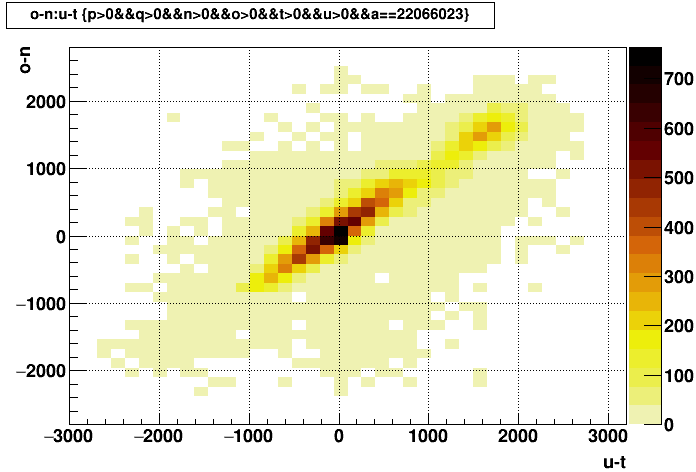
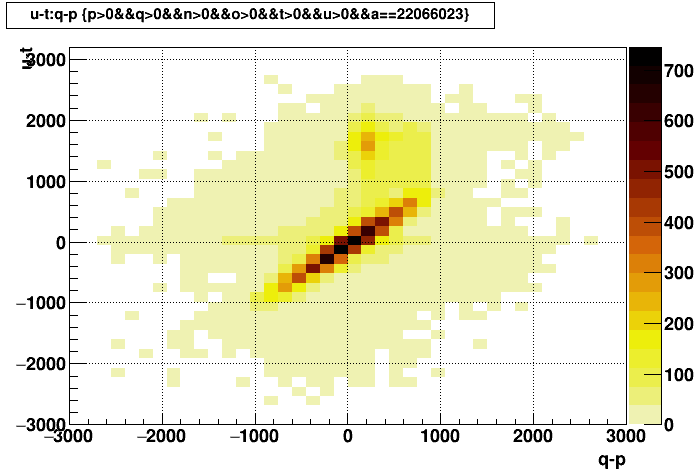
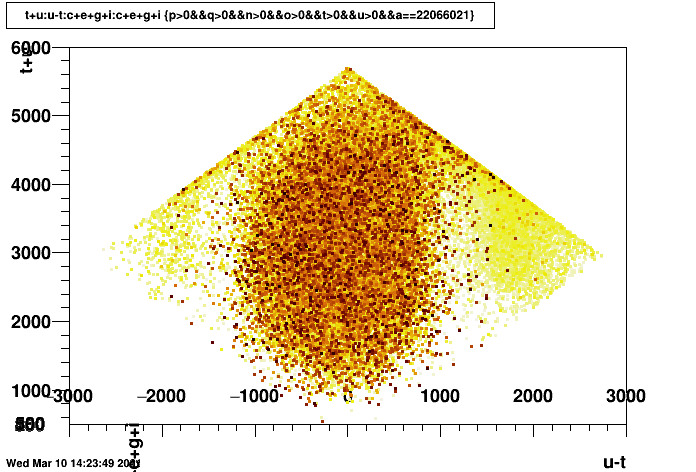
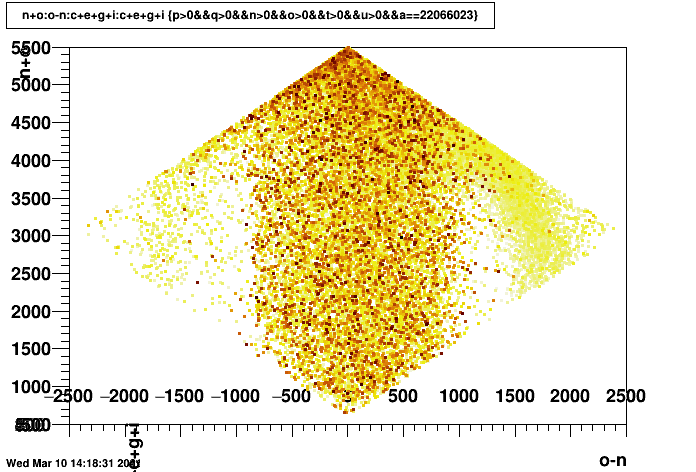
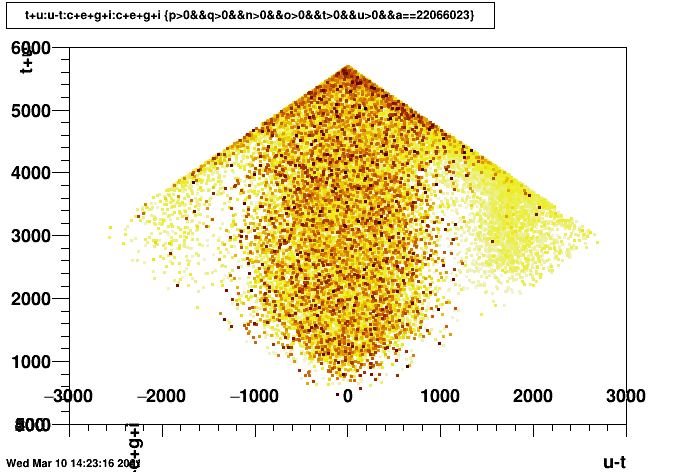
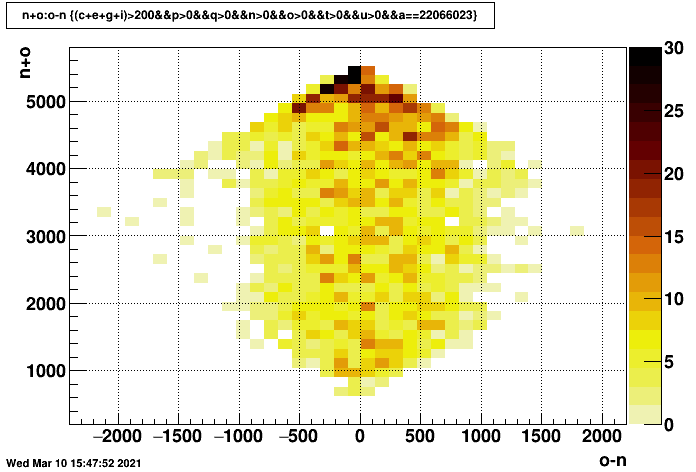
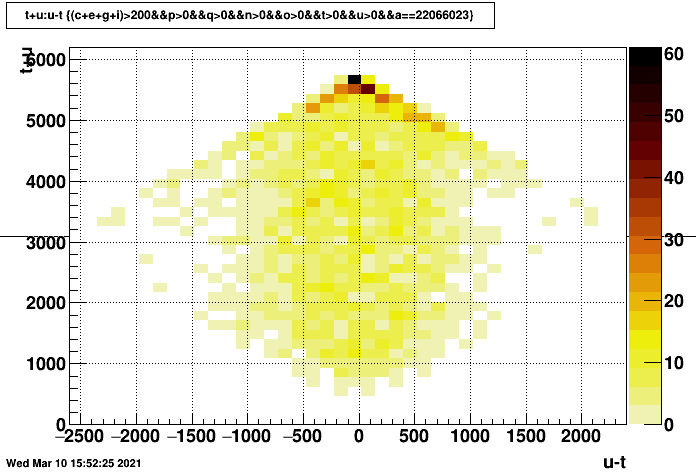
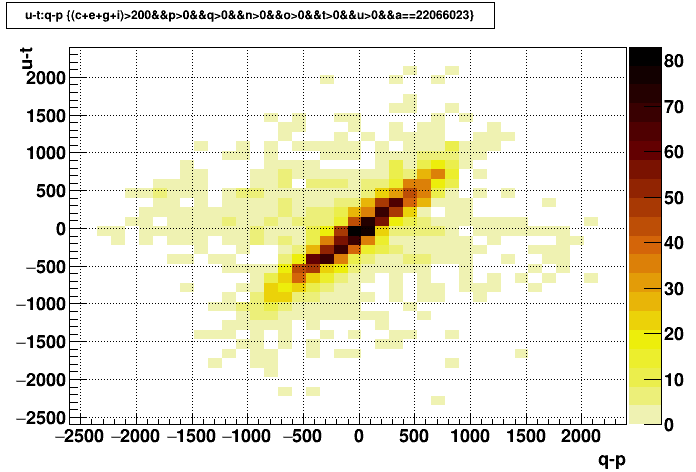
The following plots may help someone sometime understand what is happening, but they did not help me. These are the sums and differences of each detector vs. the others (units are again [TAC counts]). I found it particularly confusing that despite the VPD being the cleanest in the above plots, it is the EPD and BBC which appear most consistent with each other, so the cause would have to be common to both of them.
| sum vs. sum | EPD vs. VPD | EPD vs. BBC | BBC vs. VPD |
|---|---|---|---|
| RHIC clock | 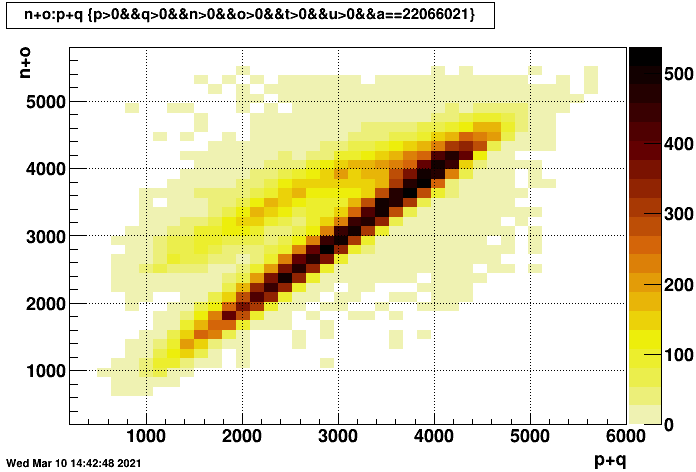 |
 |
 |
| local clock | 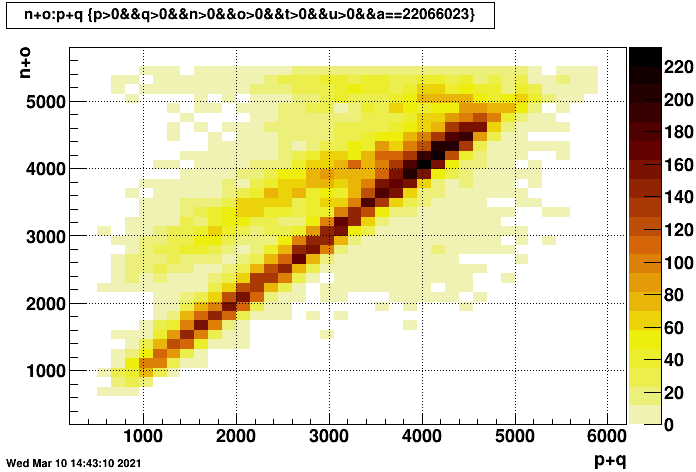 |
 |
 |
| diff vs. diff | EPD vs. VPD | EPD vs. BBC | BBC vs. VPD |
| RHIC clock | 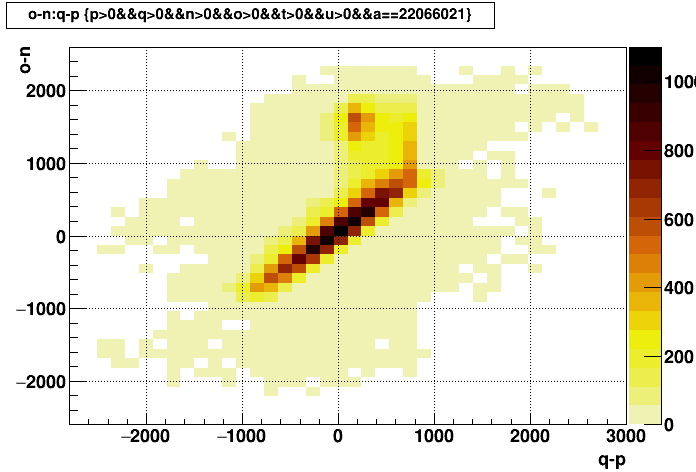 |
 |
 |
| local clock | 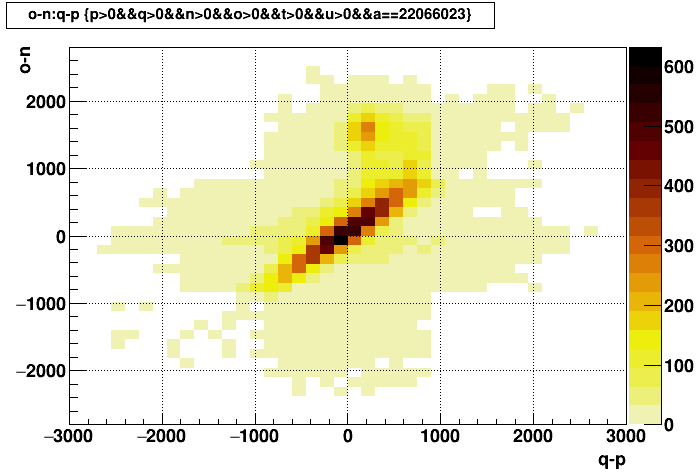 |
 |
 |
III. Excluding events with few prompt hits
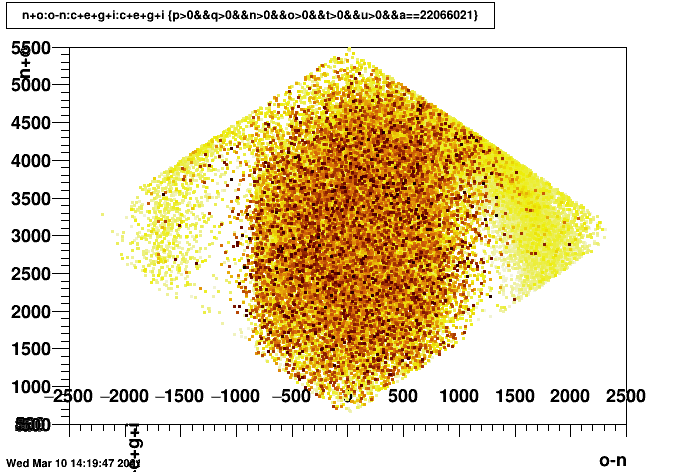
After some digging, I noticed that most of the features went away when I placed cuts on the TPC prompt hits. So I plotted similar sum vs. difference plots to above, but here the color of the points represents few [yellow] to many [brown and black] TPC prompt hits (units are again [TAC counts]). The side bands are all at few TPC prompt hits and can be generally excluded with cuts on having hundreds of hits as I usually do for my prompt hit timing studies anyhow.
| sum vs. diff | VPD | EPD | BBC |
|---|---|---|---|
| RHIC clock | 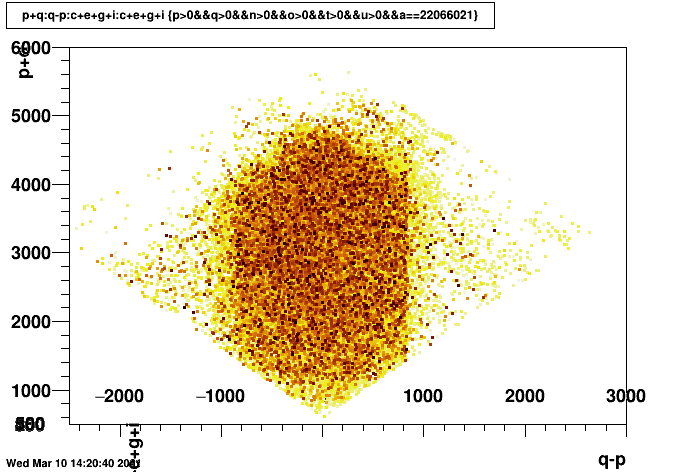 |
 |
 |
| local clock | 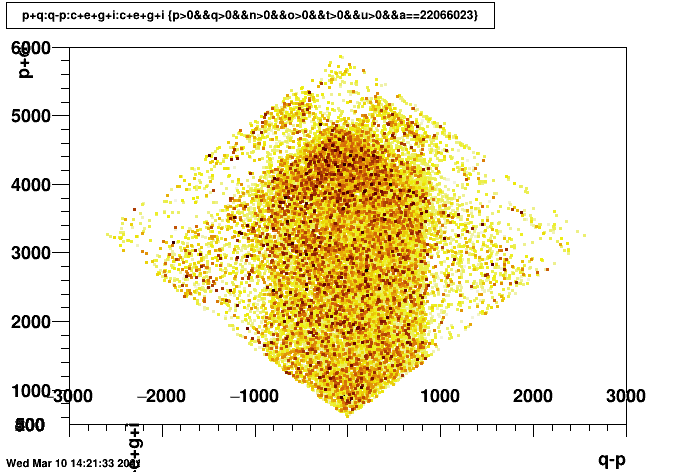 |
 |
 |
There seem to be too many events in these feature bands to be due to special triggers in the st_physics files as the minbias triggers dominate. So it remains a mystery to me what these low-prompt-hit events are.
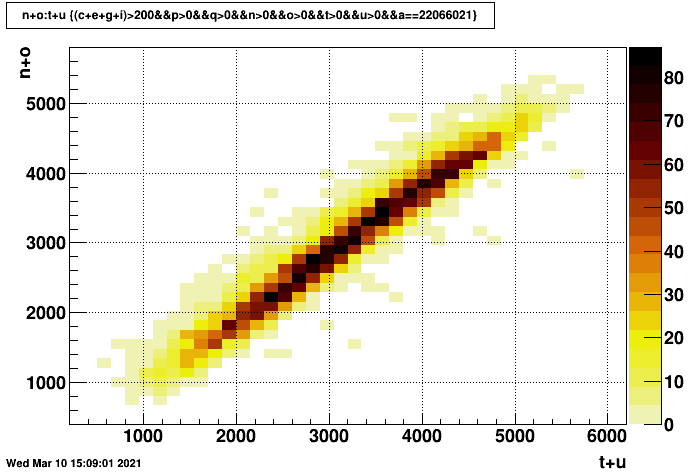
Anyhow, here again are the earlier sets of trigger detector plots, but with a cut on at least 200 TPC prompt hits showing much better behavior (units are [TAC counts]).
| sum vs. diff | VPD | EPD | BBC |
|---|---|---|---|
| RHIC clock | 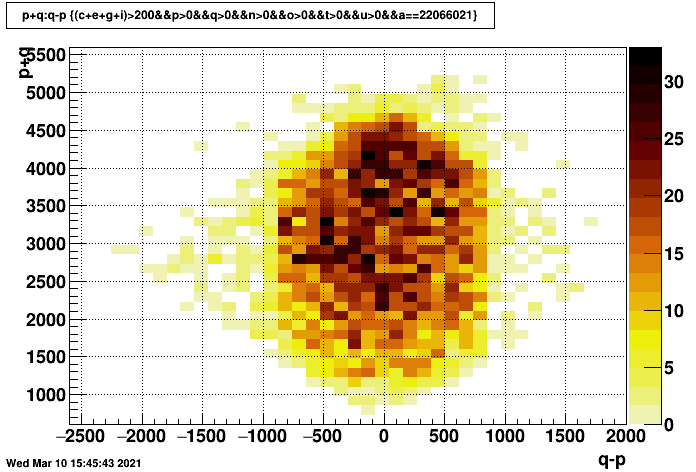 |
 |
 |
| local clock | 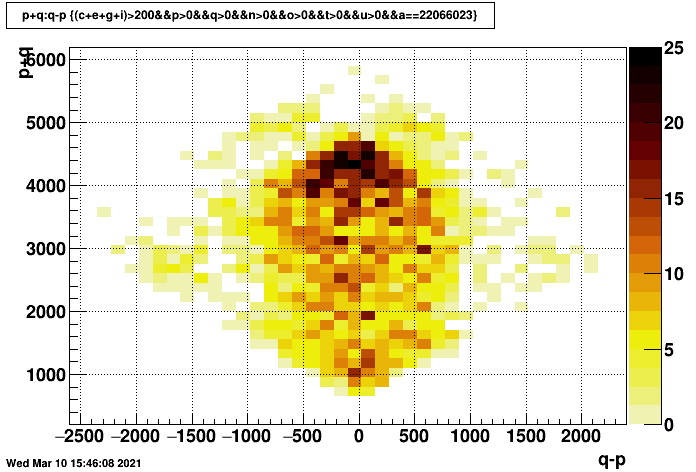 |
 |
 |
| sum vs. sum | EPD vs. VPD | EPD vs. BBC | BBC vs. VPD |
| RHIC clock | 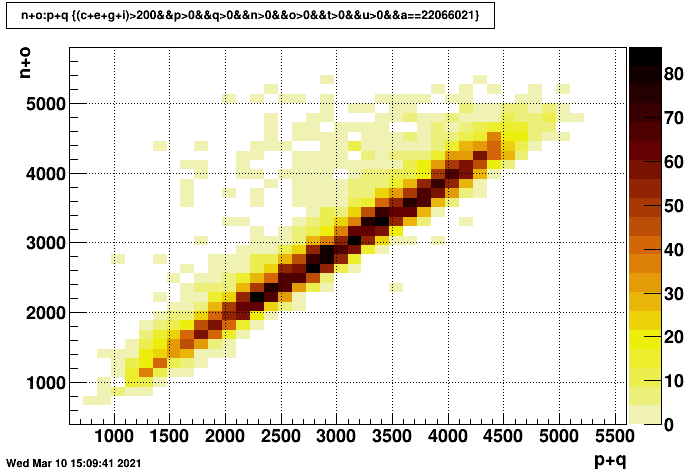 |
 |
 |
| local clock | 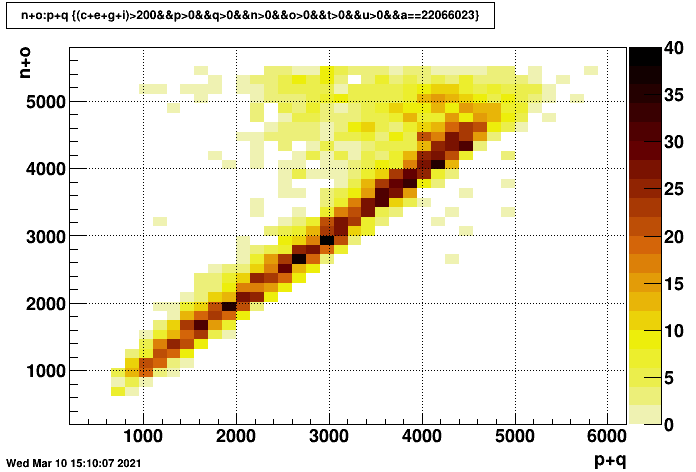 |
 |
 |
| diff vs. diff | EPD vs. VPD | EPD vs. BBC | BBC vs. VPD |
| RHIC clock | 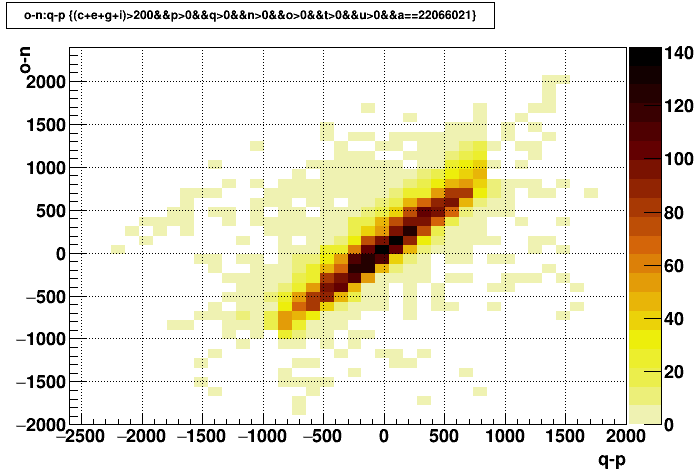 |
 |
 |
| local clock | 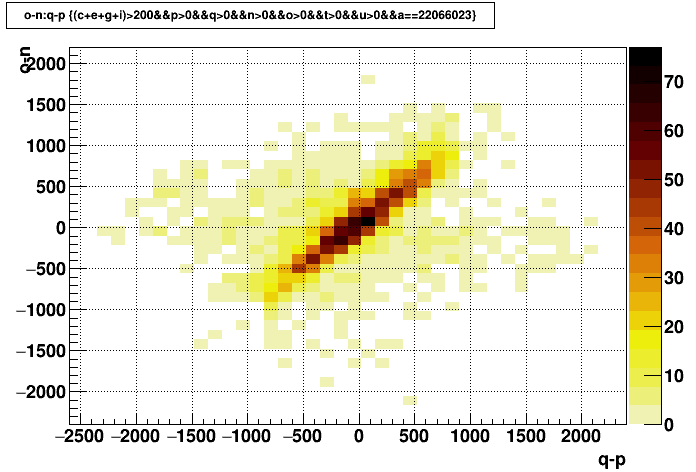 |
 |
 |
IV. First look at prompt hit time shifts
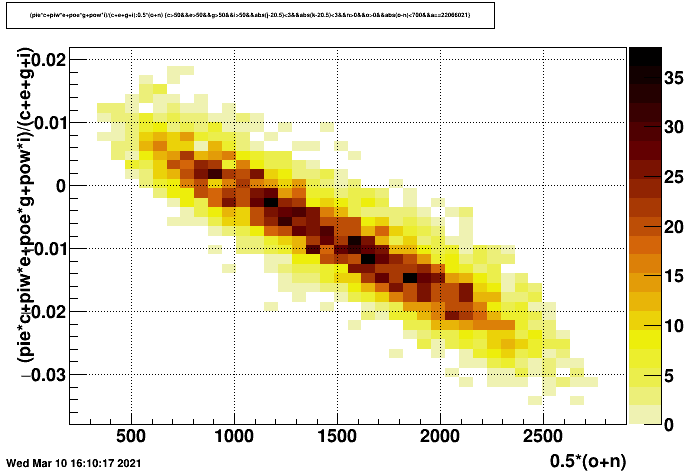
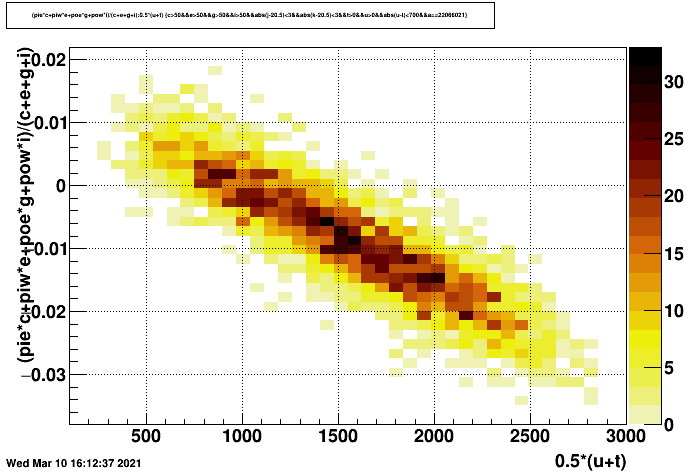
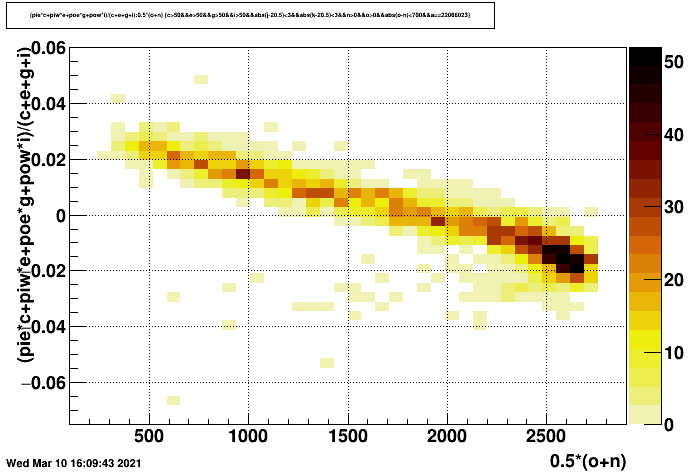
Now I was ready to look at the average time from TPC prompt hits vs. a trigger detector so that I could determine the event-by-event correction. In addition to cutting on some minimum number of prompt hits, I also cut on the absolute value of the time difference of the VPD signals to further reduce the earlier-seen sidebands which may be at far collision vertex z (I placed a cut at 700 TAC counts for the difference, which I believe corresponds to approximately ±180 cm). Here are the distributions, with the <TPC> in units of [μs] and the trigger detectors in units of [TAC counts].
| <TPC> vs. <VPD> | <TPC> vs. <EPD> | <TPC> vs. <BBC> | |
|---|---|---|---|
| RHIC clock | 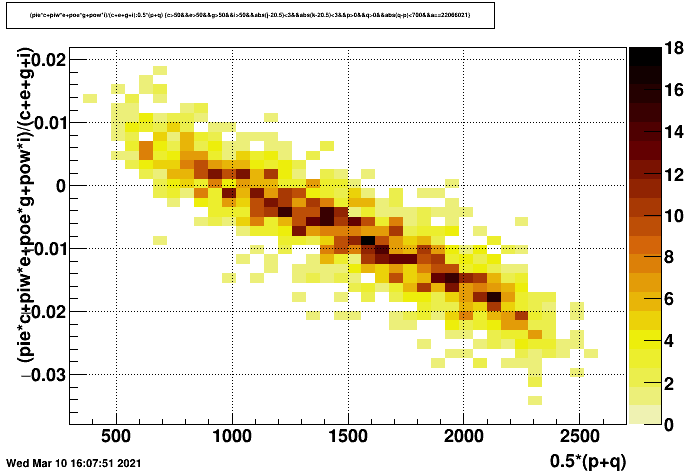 |
 |
 |
| local clock | 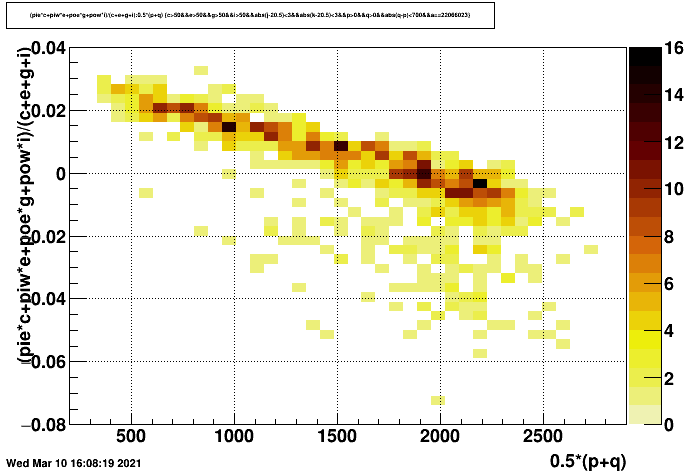 |
 |
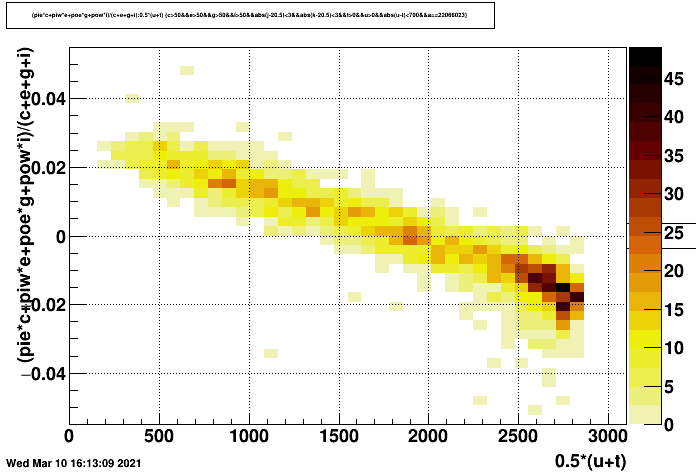 |
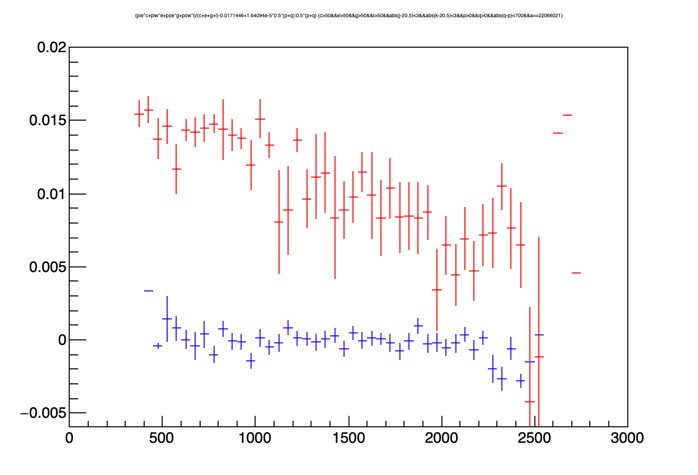
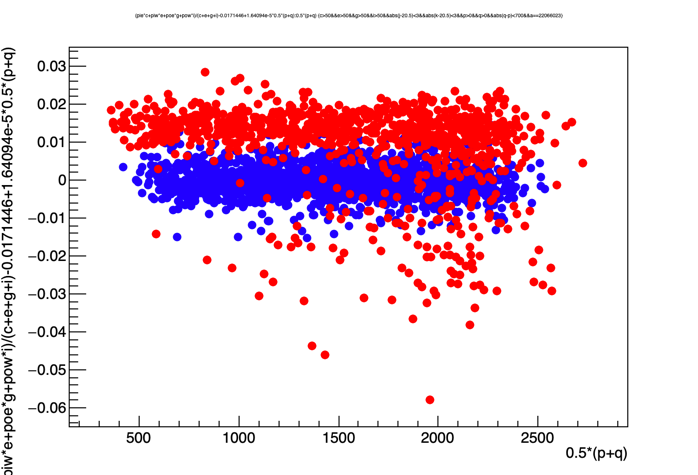
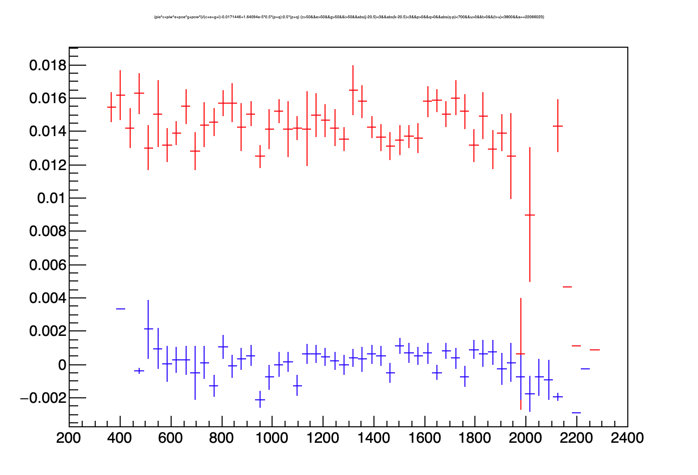
Things look pretty straightforward in the RHIC clock data, but the local clock data has some class of events that fall below the main curve. For the VPD, it is rather spread out. For the EPD, a cut isn't so clear either. But for the BBC, it seems generally isolated to the high end of the distribution. To make this more clear, I fit [black line] the profile of the RHIC clock distribution [blue], showing the local clock profile [red] on the same plot (below left). Note the local clock profile only looks clean at the low end of the TAC distribution, and the rest is what we need to clean up. The same data, but fit-subtracted is shown as both a profile (middle) and scatter plot (right), where one can see the events in the local clock data [red] below the main line. These three plots also obviate that I will see some time difference between the RHIC and local clock data!
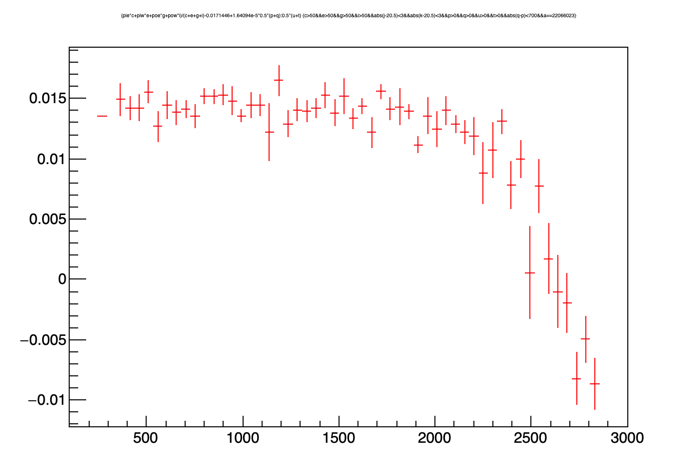
This fit indicated a 0.0164 μs/TAC count unit scale factor for the VPD, and I subtracted the fit from subsequent prompt hit measurements. Here is the profile of the fit-subtracted local clock distribution of
From this, I conclude that cutting on <BBC> below 1900 TAC counts should allow me to get rid of the unwanted class of events. However, this does not mean I understand what these events are; they represent a second mystery, specific to the local clock data!
V. Excluding events with very early BBC times
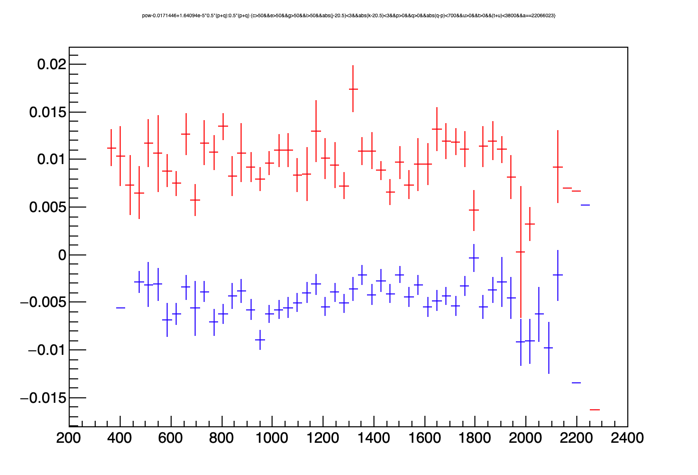
Here now are 5 plots showing the fit-subtracted <TPC> [μs] data vs. <VPD> [TAC counts] for the whole TPC as well as some subsets, showing that I have essentially corrected for the event-by-event T0s by removing (nearly) all trigger detector dependencies. (Please ignore the offsets from zero as I did not fully attempt to adjust for any timing offsets in the prompt hits; the dependencies and difference between local clock and RHIC clock are all that matters.)
| fit-subtracted <TPC> vs. VPD | Whole TPC | |
|---|---|---|
| local clock [red] RHIC clock [blue] |
 |
|
| Inner TPC | Outer TPC | |
| East TPC | 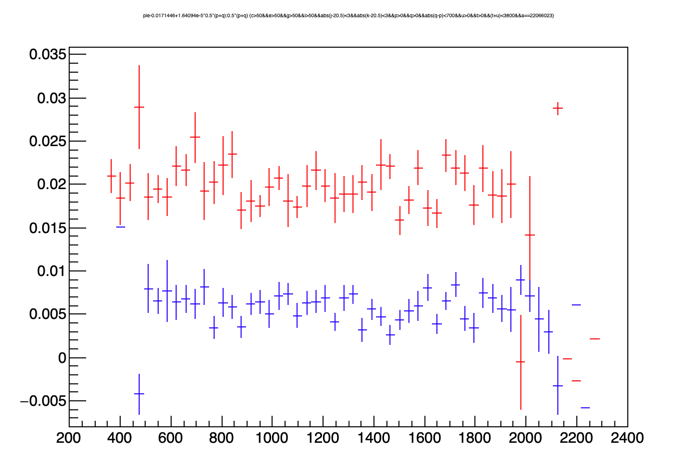 |
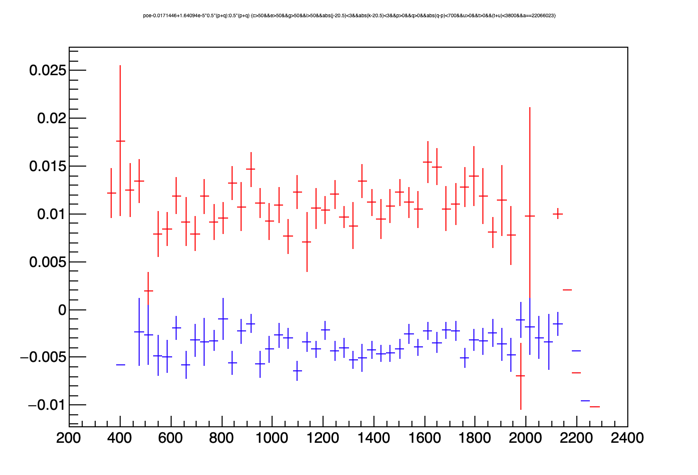 |
| West TPC | 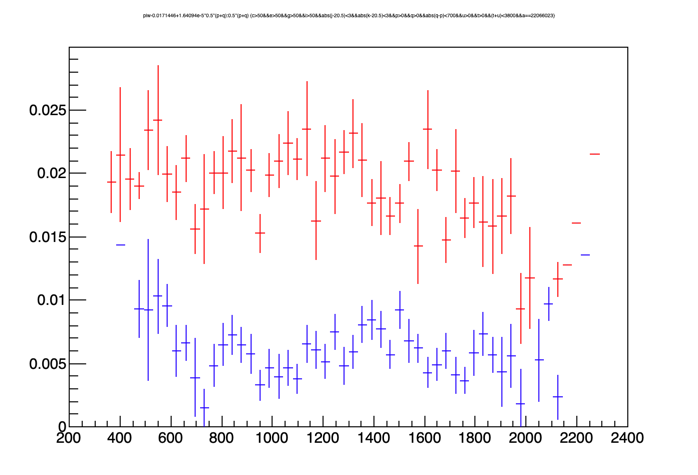 |
 |
VI. Conclusion
In conclusion, using the whole TPC data, I see what appears to be a uniform 14.1 ± 0.2 ns T0 shift in all parts of the TPC when using the local clock instead of the RHIC clock. There were no signs of a 1-time-bucket (~107 ns) time shift in any parts of the TPC. There were, however, two sets of mysterious events which I had to exclude from my analysis, one of which was visible in the trigger detectors regardless of the clock used, and the other was specific to using the local clock.
I should also note that while I did not look sector-by-sector, Yuri Fisyak also looked a little bit at the same local clock data and presented it at the 2021-03-10 You do not have access to view this node meeting. He did not see any sector-by-sector differences. He did catch a glimpse of the event-by-event T0 offsets as a <VPD> time dependence (i.e. the event-by-event T0 correction I sought to apply in my study), and saw sector-by-sector differences that were not related to the change of clock.
-Gene
»
- genevb's blog
- Login or register to post comments