- genevb's home page
- Posts
- 2025
- 2024
- 2023
- 2022
- September (1)
- 2021
- 2020
- 2019
- 2018
- 2017
- December (1)
- October (3)
- September (1)
- August (1)
- July (2)
- June (2)
- April (2)
- March (2)
- February (1)
- 2016
- November (2)
- September (1)
- August (2)
- July (1)
- June (2)
- May (2)
- April (1)
- March (5)
- February (2)
- January (1)
- 2015
- December (1)
- October (1)
- September (2)
- June (1)
- May (2)
- April (2)
- March (3)
- February (1)
- January (3)
- 2014
- 2013
- 2012
- 2011
- January (3)
- 2010
- February (4)
- 2009
- 2008
- 2005
- October (1)
- My blog
- Post new blog entry
- All blogs
Gating Grid Capture Region
Updated on Wed, 2015-12-30 16:19. Originally created by genevb on 2015-12-16 18:04.
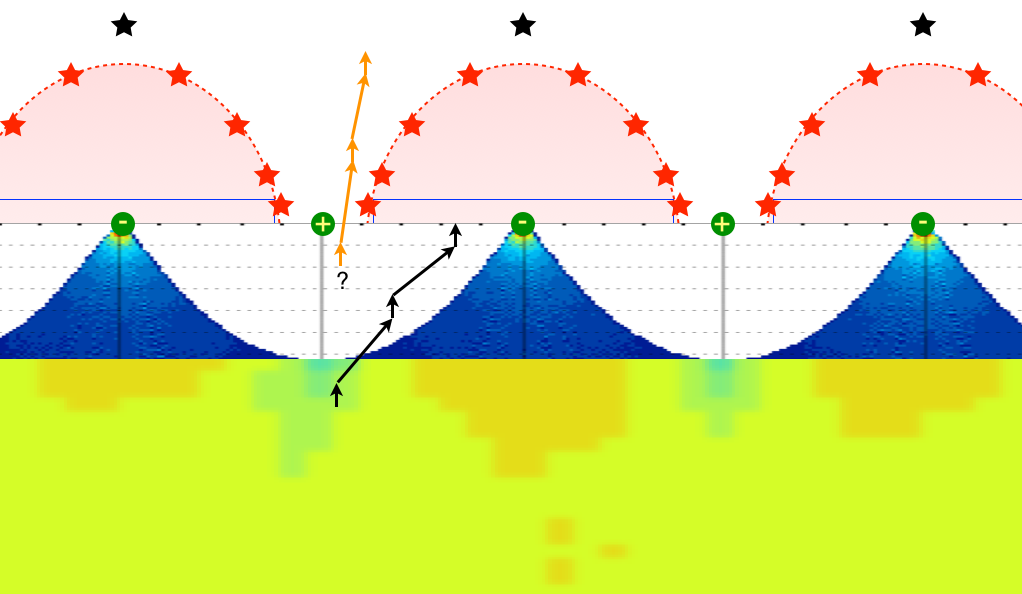
Following work by Irakli (see Fig. 10 on his blog, and my reply), I tried to create a graphic of the region in which ions that might make it past the gating grid (GG) are susceptable to being pulled back (given enough time to do so).
In this graphic are the following:
In this graphic are the following:
- Green circles representing GG wires spaced 1 mm apart
- Yellow "-" and "+" symbols inside the GG wires indicating applied voltage bias (±75 V) when closed
- Red stars representing the boundary for which ions are successfully drawn back to the nearest "-" wire, according to Irakli's results
- Black stars show a region excluded by Irakli's results
- Red dashes and half-oval showing a "by-eye" fit to the region defined by the red stars
- Blue lines forming a box:
- Top is a line at the drift distance (beyond the z of the GG) of an ion during ~47 microseconds of GG open time
- Lines down on the sides where this top line intersects the oval, at ~±0.75 mm from the "-" wires
- Bottom is a line whose extent then defines the region (at the z of the GG) in which an ion will be captured even if it is allowed to drift freely with the GG open one cycle
- Colored histogram using two images (overlaying one medium resolution histogram that is mostly blue, and one low resolution histogram that is mostly yellow) from Irakli's results of ion flow when the GG is closed (scaled and distorted to match roughly my coordinate system)
- Black arrows showing a possible path for an ion up to the z of the GG, stepping as the GG opens and closes
- Orange arrows showing a potential escape path, but originating from a region (labeled "?") which ions must very, very rarely reach
»
- genevb's blog
- Login or register to post comments