Garfield Simulation for TPC - Grid Leak Study
Updated on Fri, 2017-03-03 11:34. Originally created by iraklic on 2015-11-17 15:25.
This blog presents the document of the GARFIELD simulation study to reduce / remove the "grid leak" in the TPC.
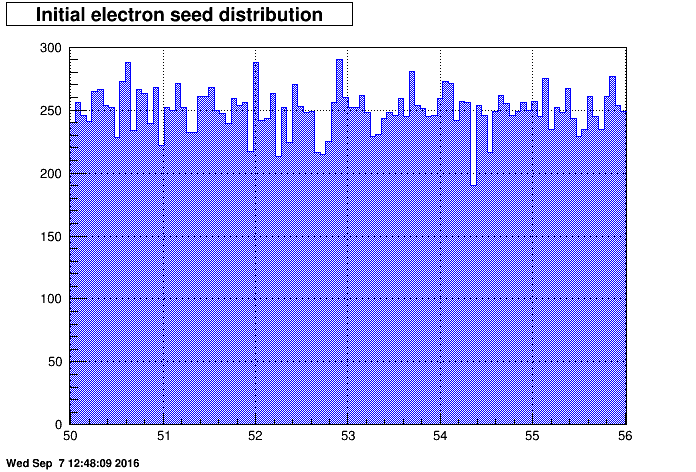
The initial setup is to seed initial electrons 1 mm above (towards the pads) the GG wires. Initial distribution of the seeded electrons is flat in the range under consideration. e.g for the Inner-Inner (II) case it woud look like this:
Anode wire pitch 0.4 cm, anode wire diamiter 0.002 cm, field wire diameter 0.0125 cm.
The summary of the field wires' effect on grid leak is shown below:
The simulations are done for different setups:
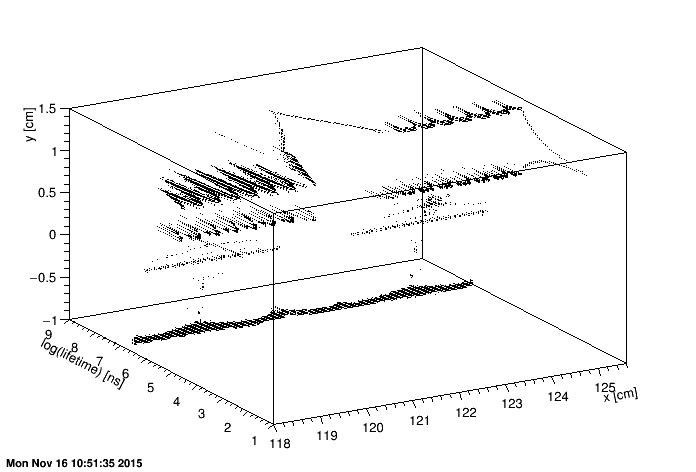
Figure 1.
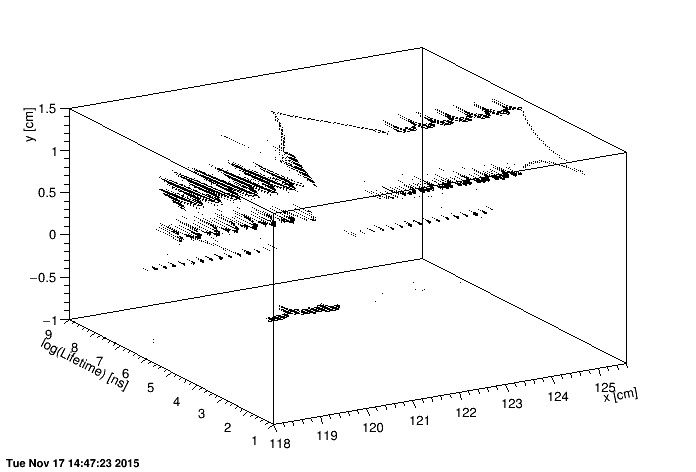
Figure 2.
The GG leakage is related to the ions leaked past the GG which correspond to the area where [y < -0.5], those are the ions reaching the membrane.
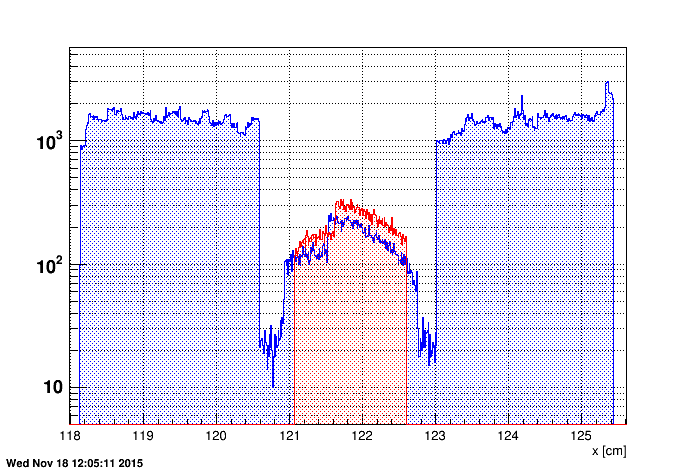
Figure 3.
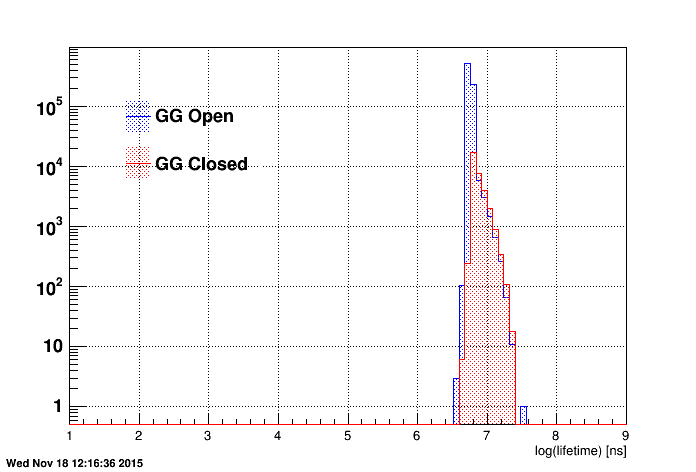
Figure 4.
If we only concentrate on the y range of [-0.1, 0.1] where the GG is in our geometry, we can study the lifetime of the ions reaching the GG (Fig. 5).
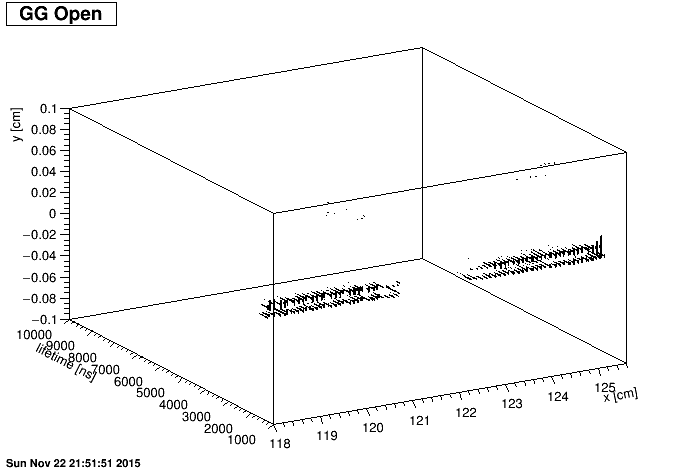
Figure 5.
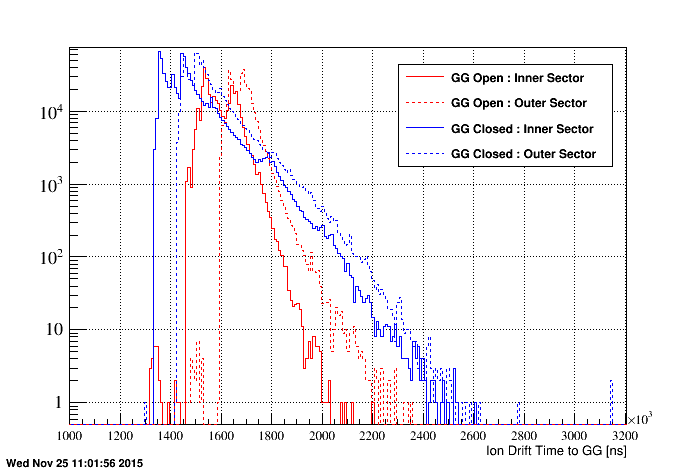
Figure 6.
Slight shift can be seen between inner and outer sector ions due to a GG being further in outer sector. The (1 - cumulative distribution) is shown below on Fig. 7:
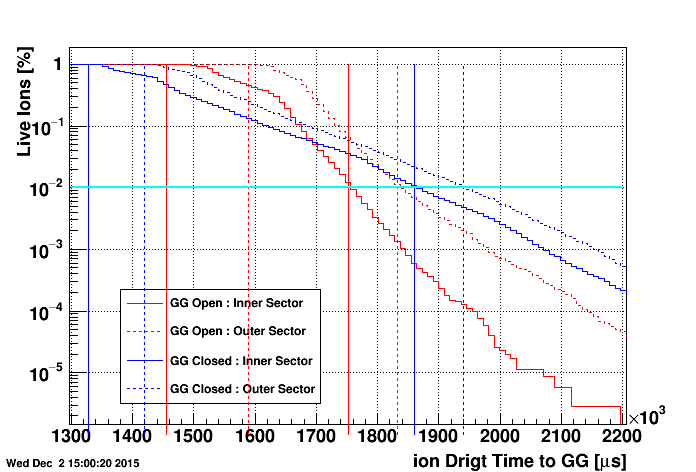
Figure 7.
These plots show that ions take about 1.3 ms to arrive at GG and another 0.5 ms for most of them to be absorbed on GG.
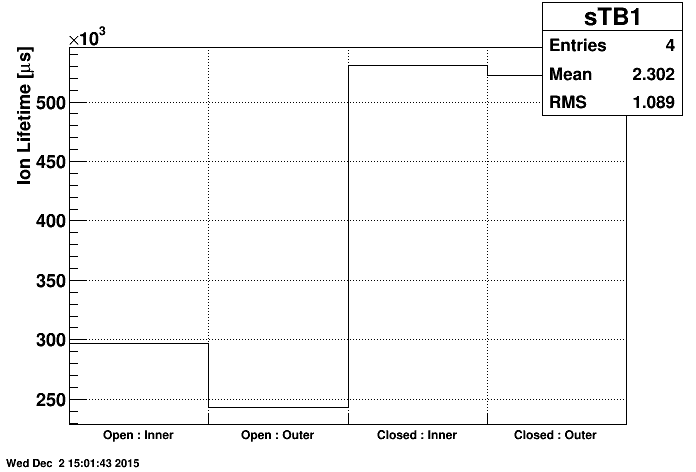
Figure 8.
The lifetimes are as follows :
The initial setup is to seed initial electrons 1 mm above (towards the pads) the GG wires. Initial distribution of the seeded electrons is flat in the range under consideration. e.g for the Inner-Inner (II) case it woud look like this:
Anode wire pitch 0.4 cm, anode wire diamiter 0.002 cm, field wire diameter 0.0125 cm.
The summary of the field wires' effect on grid leak is shown below:
The simulations are done for different setups:
- Current TPC Setup
- Between inner and outer sector
- Between outer field cage and outer sector
- Between inner field cage and inner sector
- Two grounded L shaped walls with horizontal part between GG and Anode wires
- Two grounded L shaped walls with horizontal part above GG
- Single vertical wall with different potentials
- 0 V
- -230 V
- -460 V
- -690 V
- Completely grounded wall (3 fat wires)
- Completely grounded wall (2 fat wire)
- -690 V and receded 1 field wire
- The plot below is the comparison of (-690 V outward facing potential wall with no wall and with receded single field wire)
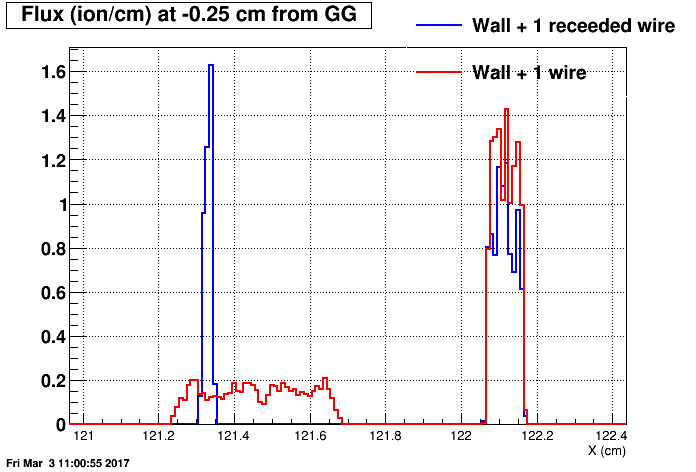
- The plot below shows integrals for the plot above for the outer and inner side leaks separately
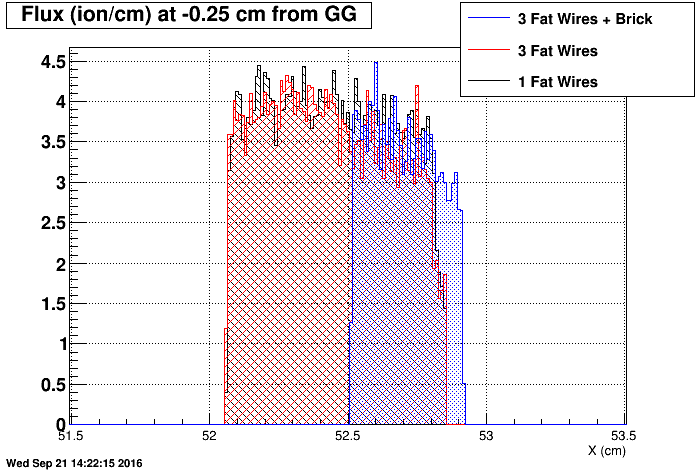
Figure 1.
Figure 2.
The GG leakage is related to the ions leaked past the GG which correspond to the area where [y < -0.5], those are the ions reaching the membrane.
Figure 3.
Figure 4.
If we only concentrate on the y range of [-0.1, 0.1] where the GG is in our geometry, we can study the lifetime of the ions reaching the GG (Fig. 5).
Figure 5.
Figure 6.
Slight shift can be seen between inner and outer sector ions due to a GG being further in outer sector. The (1 - cumulative distribution) is shown below on Fig. 7:
Figure 7.
These plots show that ions take about 1.3 ms to arrive at GG and another 0.5 ms for most of them to be absorbed on GG.
Figure 8.
The lifetimes are as follows :
Inner Open : 297000
Outer Open : 243000
Inner Closed : 531000
Outer Closed : 522000
--------------------------------------------------------------------------------
Number of Ions passing the GG when it is open normilized per single electron / mm is given below on Fig. 9:
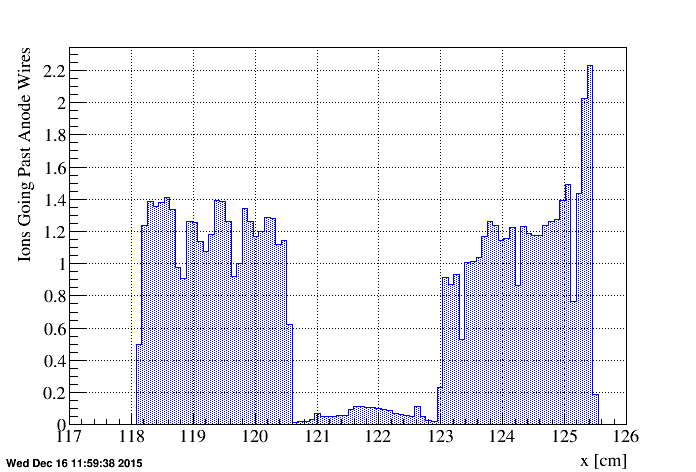
Figure 9.
If we consider that ther is constant flow of ions from behind the GG and once GG open they flow with 2.5 mm/ms speed to membrane and then we close the GG we get the following:
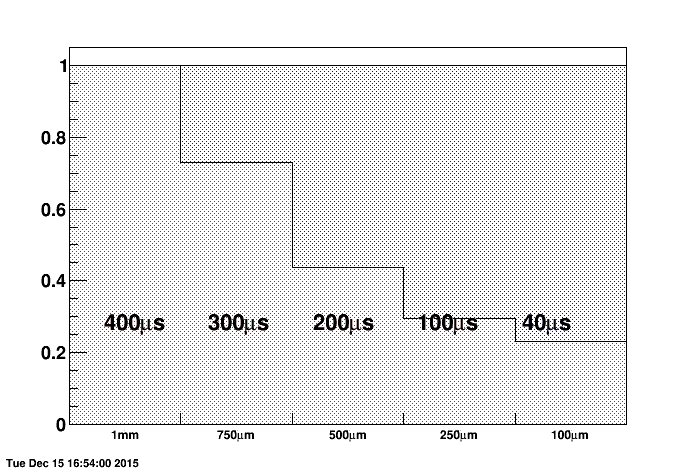
Figure 10.
This means, roughly, 12 ions per cm times 22 % ~ 2.5 ions per cm passing GG when it is open for 40 microseconds.
To produce more realistic case. I consider that the ion position during GG closed is static and distribution is one as shown on Fig. 11. Then I consider that once GG is open ions with that distribution flow freely. Once GG is closed I look what happens to those ions. Resul is shown on Fig. 12.
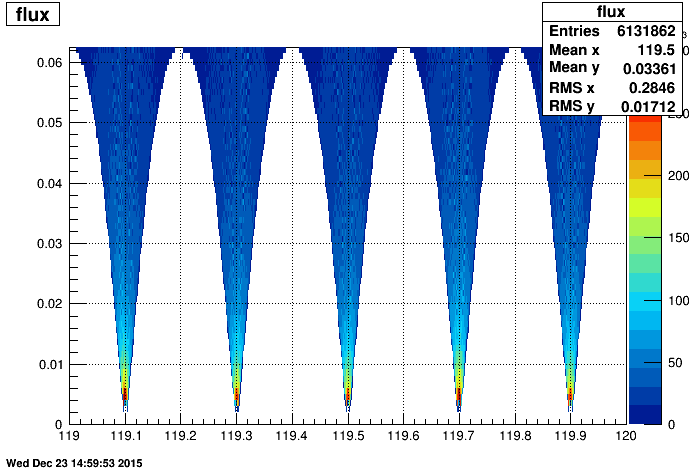
Figure 11.
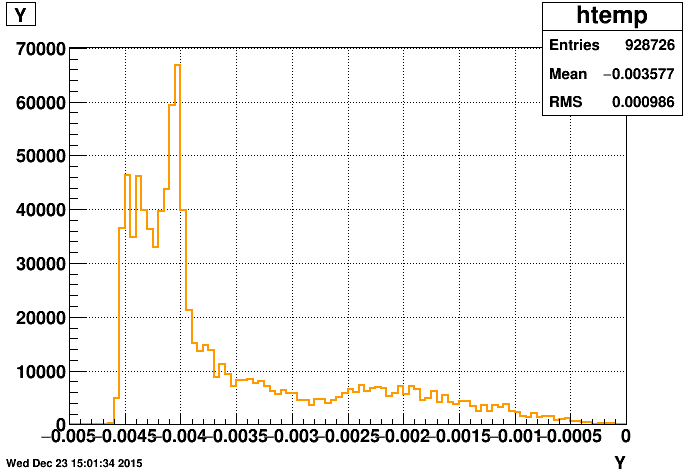
Figure 12.
====================================================================
The ion lifetime plots above were all performed considering the death of ions at the GG as the time that ions take to reach it. On the other hand this lifetime of ions may differ from the time or arrival of the ions that live past the GG. Below plots are to look at such a difference:
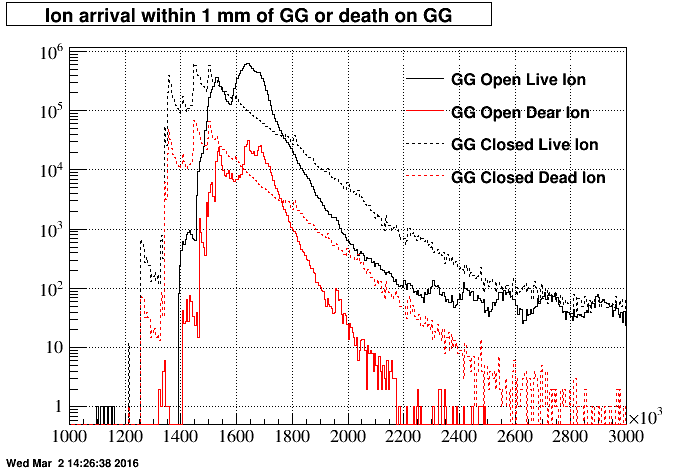
Figure 13.

Figure 14.

Figure 15.
--------------------------------------------------------------------------------
Number of Ions passing the GG when it is open normilized per single electron / mm is given below on Fig. 9:
Figure 9.
If we consider that ther is constant flow of ions from behind the GG and once GG open they flow with 2.5 mm/ms speed to membrane and then we close the GG we get the following:
Figure 10.
This means, roughly, 12 ions per cm times 22 % ~ 2.5 ions per cm passing GG when it is open for 40 microseconds.
To produce more realistic case. I consider that the ion position during GG closed is static and distribution is one as shown on Fig. 11. Then I consider that once GG is open ions with that distribution flow freely. Once GG is closed I look what happens to those ions. Resul is shown on Fig. 12.
Figure 11.
Figure 12.
====================================================================
The ion lifetime plots above were all performed considering the death of ions at the GG as the time that ions take to reach it. On the other hand this lifetime of ions may differ from the time or arrival of the ions that live past the GG. Below plots are to look at such a difference:
Figure 13.
Figure 14.
Figure 15.
»
- iraklic's blog
- Login or register to post comments