- genevb's home page
- Posts
- 2025
- 2024
- 2023
- 2022
- September (1)
- 2021
- 2020
- 2019
- 2018
- 2017
- December (1)
- October (3)
- September (1)
- August (1)
- July (2)
- June (2)
- April (2)
- March (2)
- February (1)
- 2016
- November (2)
- September (1)
- August (2)
- July (1)
- June (2)
- May (2)
- April (1)
- March (5)
- February (2)
- January (1)
- 2015
- December (1)
- October (1)
- September (2)
- June (1)
- May (2)
- April (2)
- March (3)
- February (1)
- January (3)
- 2014
- 2013
- 2012
- 2011
- January (3)
- 2010
- February (4)
- 2009
- 2008
- 2005
- October (1)
- My blog
- Post new blog entry
- All blogs
GridLeak Wall voltage test
Updated on Fri, 2019-03-01 02:29. Originally created by genevb on 2019-02-28 14:58.
On 2019-02-27, I spent some time at the experiment running some tests to record (via slow controls into the online database) GridLeak wall currents under various conditions, given the confusion I had when I first looked at the GridLeak wall currents. Here are my notes on the conditions I tested:
I then obtained the currents from the database. First, I'll note that all 24 sectors exhibited very similar behavior. Given this, I show here some results from taking the mean of all 24 sectors (to give me statistics at each recording time). Here then are the currents recorded vs. time, showing the minute that corresponds to the above times, where 60 is 18:00 EST. I've added vertical markers for when voltages directly for those currents: red vertical lines mark when the inner (top) or outer (bottom) voltages were turned off, and green lines mark when those voltages were turned back on.
Each data point is recorded every 30 seconds, and according to slow controls is at the :08 and :38 second marks. UPDATE: I am informed by Jarda that the units of the current values are in μAmps;, and that the pedestals I observe at zero voltages "appear to be just an artifact from internal measurements in the ISEG HV modules," so I will not focus on those values in particular.
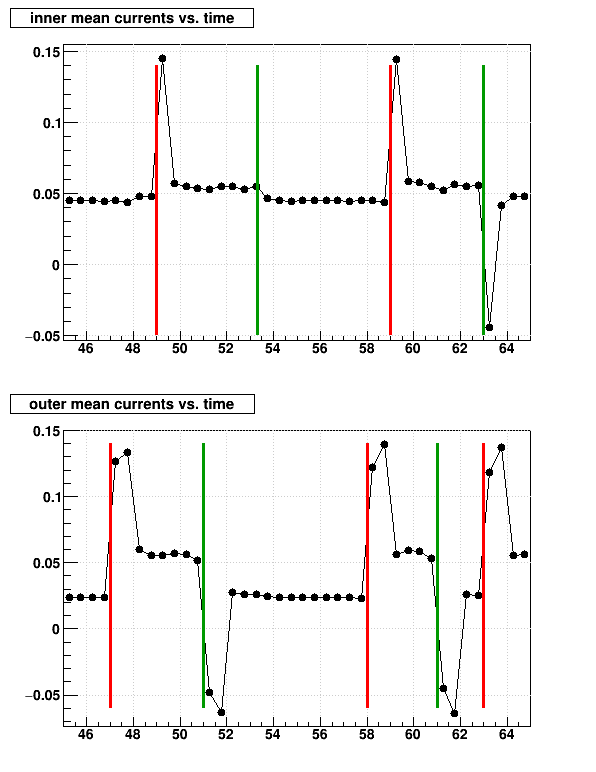
One can see from this that there appear to be some transition states for the first one (inner) or two (outer) readings (e.g. for ~30-60 seconds) after each voltage change. These were the "spikes" that I had noted previously, and I will come back to them in a moment. However, if I try to exclude those transition spikes for now, it will help us zoom in on the steady-state data:
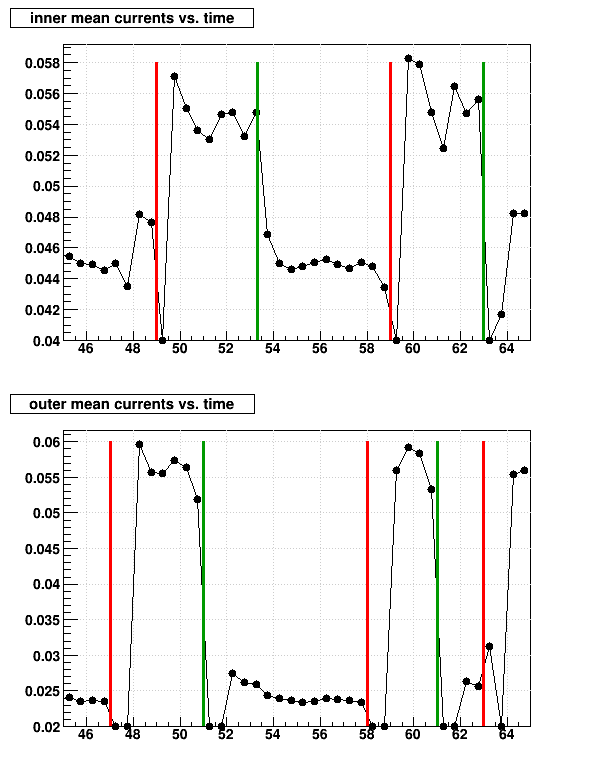
Now we see that the associated voltage is the dominant determinator for the current: inner voltage off vs. on dominates the inner current values, and outer voltage off vs. on dominates the outer current values. The primary deviation I see from that is that, when the inner voltage is on, there is some dependence of the inner current on the outer voltage: inner current is ~0.045 with both voltages on (during 48:00-49:00 and again at 64:00-65:00), and ~0.048 when only the inner voltage is on.
It does appear that the "true" pedestals for the currents are recorded when the associated voltages are off (but keep in mind that the above plots average all 24 sectors, and that each one will have different inner & outer pedestals).
There is no clear and obvious dependence of the currents on the anode or GG states. But I should emphasize that this data was recorded during a beam-off state (collider wasn't running at all).
___
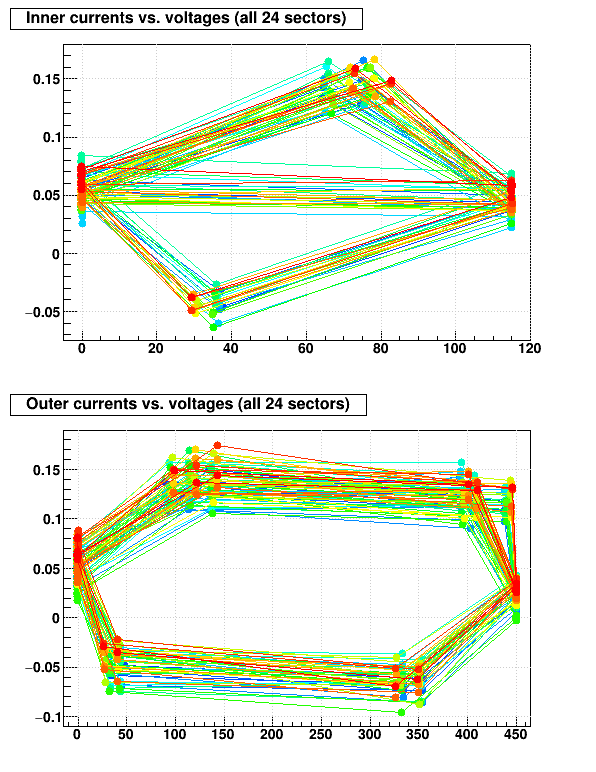
Another way to examine the data is currents vs. voltage. Here I show these for each of the 24 sectors overlaid (different colors for each sector), and the transition states become more apparent. For the inner voltages, there is only one transition reading, except for the transition at 53, which I must have triggered just late enough for the slow controls reading at :08 to miss, and by 0:38 is done, implying that it probably takes less than 30 seconds for the transitions on the inner. The outer transitions always took two readings, so it was definitely more than 30 seconds, and probably over 40 seconds.
My first impression of these transitions indicate a time constant related to capacitance in the system, and modifying the inner voltages by 115 V takes less time than modifying the outer voltages by 450 V. Some evidence for this comes from the current going one way when the voltage transitions on (building up charge inside the detector), and the other way when the voltage transitions off (removing charge from the detector).
One last curious question I have is, why is there any steady state non-zero current at all?
________________________________
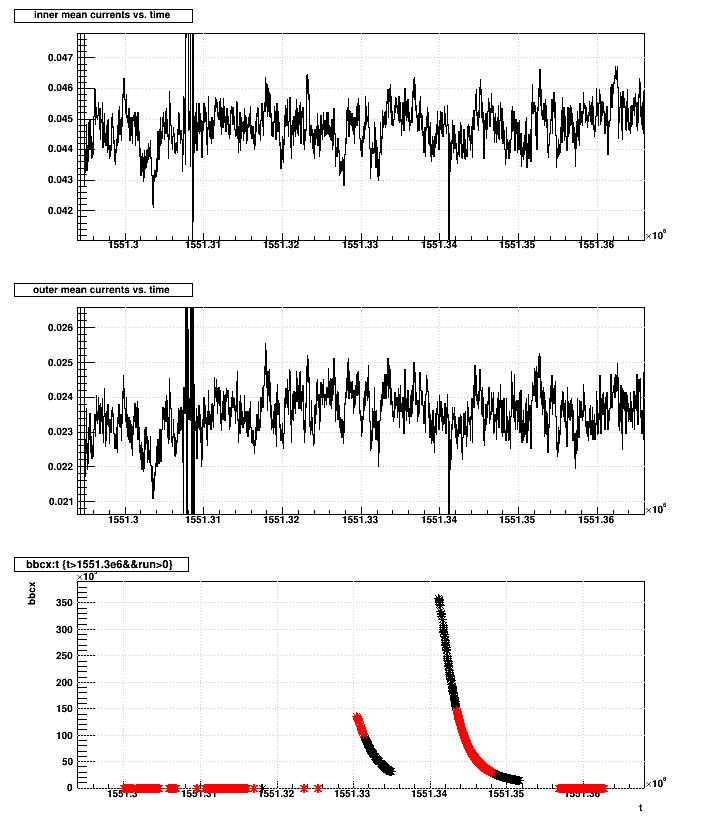
Separately, I looked at some beam-on data to see if there was any luminosity dependence. Instead of trying to put the RICH scalers into the same ntuple as the currents, I simply plotted the inner and outer mean currents (averaged over all 24 sectors) and BBC coincidence rate scaler over the same time period during which some TPC runs (indicated in red on the BBC plot) were acquired with some notable luminosity. No clear correlation between luminosity and currents is distinguishable within the spread of data.
-Gene
17:45:00 everything on: inner/tip at 115 V, outer/side at 450 V, GG on but closed, anodes on at full voltage
17:47:00 turn off outer/side: 450 V => 0 V (only inner/tip on)
17:49:00 turn off inner/tip: 115 V = 0 V (both at 0 V)
17:51:00 turn on outer/side: 0 V => 450 V (only outer on)
17:53:00 both wall voltages on (0 V => 115 V), and anodes begin ramp to 0 V
17:54:00 anodes close to 0 V
17:54:30 anodes stable and very close to 0 V
17:56:00 GG off
17:58:00 turn off outer/side: 450 V => 0 V (only inner/tip on)
17:59:00 turn off inner/tip: 115 V => 0 V (both at 0 V)
18:01:00 turn on outer/side: 0 V => 450 V (only outer on)
18:03:00 turn off outer/side, turn on inner/tip: 450 V => 0 V, 0 V => 115 V (repeat inner/tip on because only did it for 1 minute previous time)
18:05:00 everything goes back on

NB: 2019-02-27 18:05:00 EST is the equivalent of 2019-02-27 23:05:00 GMT
I then obtained the currents from the database. First, I'll note that all 24 sectors exhibited very similar behavior. Given this, I show here some results from taking the mean of all 24 sectors (to give me statistics at each recording time). Here then are the currents recorded vs. time, showing the minute that corresponds to the above times, where 60 is 18:00 EST. I've added vertical markers for when voltages directly for those currents: red vertical lines mark when the inner (top) or outer (bottom) voltages were turned off, and green lines mark when those voltages were turned back on.
Each data point is recorded every 30 seconds, and according to slow controls is at the :08 and :38 second marks. UPDATE: I am informed by Jarda that the units of the current values are in μAmps;, and that the pedestals I observe at zero voltages "appear to be just an artifact from internal measurements in the ISEG HV modules," so I will not focus on those values in particular.
One can see from this that there appear to be some transition states for the first one (inner) or two (outer) readings (e.g. for ~30-60 seconds) after each voltage change. These were the "spikes" that I had noted previously, and I will come back to them in a moment. However, if I try to exclude those transition spikes for now, it will help us zoom in on the steady-state data:
Now we see that the associated voltage is the dominant determinator for the current: inner voltage off vs. on dominates the inner current values, and outer voltage off vs. on dominates the outer current values. The primary deviation I see from that is that, when the inner voltage is on, there is some dependence of the inner current on the outer voltage: inner current is ~0.045 with both voltages on (during 48:00-49:00 and again at 64:00-65:00), and ~0.048 when only the inner voltage is on.
It does appear that the "true" pedestals for the currents are recorded when the associated voltages are off (but keep in mind that the above plots average all 24 sectors, and that each one will have different inner & outer pedestals).
There is no clear and obvious dependence of the currents on the anode or GG states. But I should emphasize that this data was recorded during a beam-off state (collider wasn't running at all).
___
Another way to examine the data is currents vs. voltage. Here I show these for each of the 24 sectors overlaid (different colors for each sector), and the transition states become more apparent. For the inner voltages, there is only one transition reading, except for the transition at 53, which I must have triggered just late enough for the slow controls reading at :08 to miss, and by 0:38 is done, implying that it probably takes less than 30 seconds for the transitions on the inner. The outer transitions always took two readings, so it was definitely more than 30 seconds, and probably over 40 seconds.
My first impression of these transitions indicate a time constant related to capacitance in the system, and modifying the inner voltages by 115 V takes less time than modifying the outer voltages by 450 V. Some evidence for this comes from the current going one way when the voltage transitions on (building up charge inside the detector), and the other way when the voltage transitions off (removing charge from the detector).
One last curious question I have is, why is there any steady state non-zero current at all?
________________________________
Separately, I looked at some beam-on data to see if there was any luminosity dependence. Instead of trying to put the RICH scalers into the same ntuple as the currents, I simply plotted the inner and outer mean currents (averaged over all 24 sectors) and BBC coincidence rate scaler over the same time period during which some TPC runs (indicated in red on the BBC plot) were acquired with some notable luminosity. No clear correlation between luminosity and currents is distinguishable within the spread of data.
-Gene
»
- genevb's blog
- Login or register to post comments