- genevb's home page
- Posts
- 2025
- 2024
- 2023
- 2022
- September (1)
- 2021
- 2020
- 2019
- 2018
- 2017
- December (1)
- October (3)
- September (1)
- August (1)
- July (2)
- June (2)
- April (2)
- March (2)
- February (1)
- 2016
- November (2)
- September (1)
- August (2)
- July (1)
- June (2)
- May (2)
- April (1)
- March (5)
- February (2)
- January (1)
- 2015
- December (1)
- October (1)
- September (2)
- June (1)
- May (2)
- April (2)
- March (3)
- February (1)
- January (3)
- 2014
- 2013
- 2012
- 2011
- January (3)
- 2010
- February (4)
- 2009
- 2008
- 2005
- October (1)
- My blog
- Post new blog entry
- All blogs
h-/h+ in Run 19 19.6 GeV with new TPC alignment
Updated on Fri, 2024-11-22 00:36. Originally created by genevb on 2024-11-21 23:41.
Using the output of the latest P24iy calibration production with the new TPC alignment, I took another look at h-/h+ in Run 19 19.6 GeV data. I did the same thing previously in 2021 for P21ia, which used an older version of the TPC alignment. So let's just jump right into the plots...

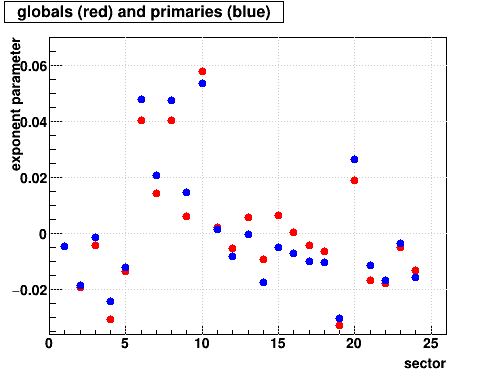
And the exponent parameters, with a direct comparison of the older alignment P21ia (left) versus the new alignment P24iy (right). The individual sectors aren't the same between the two, though a few notable outliers remain the same: sectors 6, 10, 20. And more generally speaking, the variations are on the same scale between the two different alignment versions!


Caveat: since the h-/h+ ratios I show are normalized to the integrated ratio, this analysis does not demonstrate whether the new alignment improves (or not) any overall biases (it may in fact do that with respect to the older alignment). It is useful only in the sense of looking at variation between the sectors.
One check on the robustness of the result is to split the dataset in two and see if they agree with each other. So here I've split into runs on day 74 and earlier (left) vs. day 75 and later (right), with the point-to-point numbers between these two all in agreement to ±0.005 or less, while the overall sector-to-sector variations we are concerned about are an order of magnitude larger than that.


-Gene

And the exponent parameters, with a direct comparison of the older alignment P21ia (left) versus the new alignment P24iy (right). The individual sectors aren't the same between the two, though a few notable outliers remain the same: sectors 6, 10, 20. And more generally speaking, the variations are on the same scale between the two different alignment versions!


Caveat: since the h-/h+ ratios I show are normalized to the integrated ratio, this analysis does not demonstrate whether the new alignment improves (or not) any overall biases (it may in fact do that with respect to the older alignment). It is useful only in the sense of looking at variation between the sectors.
One check on the robustness of the result is to split the dataset in two and see if they agree with each other. So here I've split into runs on day 74 and earlier (left) vs. day 75 and later (right), with the point-to-point numbers between these two all in agreement to ±0.005 or less, while the overall sector-to-sector variations we are concerned about are an order of magnitude larger than that.


-Gene
»
- genevb's blog
- Login or register to post comments
