- genevb's home page
- Posts
- 2025
- 2024
- 2023
- 2022
- September (1)
- 2021
- 2020
- 2019
- 2018
- 2017
- December (1)
- October (3)
- September (1)
- August (1)
- July (2)
- June (2)
- April (2)
- March (2)
- February (1)
- 2016
- November (2)
- September (1)
- August (2)
- July (1)
- June (2)
- May (2)
- April (1)
- March (5)
- February (2)
- January (1)
- 2015
- December (1)
- October (1)
- September (2)
- June (1)
- May (2)
- April (2)
- March (3)
- February (1)
- January (3)
- 2014
- 2013
- 2012
- 2011
- January (3)
- 2010
- February (4)
- 2009
- 2008
- 2005
- October (1)
- My blog
- Post new blog entry
- All blogs
h-/h+ in Run 19 19.6 GeV
Updated on Wed, 2021-05-12 14:32. Originally created by genevb on 2021-05-12 00:40.
Using the data produced in the April 2021 calibration production sample of Run 19 19.6 GeV data, for which all calibrations of the TPC were applied, I obtained pT distributions of positively and negatively charge primary and global tracks. I then took the ratio of h-/h+ for tracks in each sector, and then took the double ratio of the sector-wise h-/h+ ratio divided by the h-/h+ ratio using all sectors together. The log of these double ratios are plotted vs. pT for global (red) and primaries (blue) for each sector here:
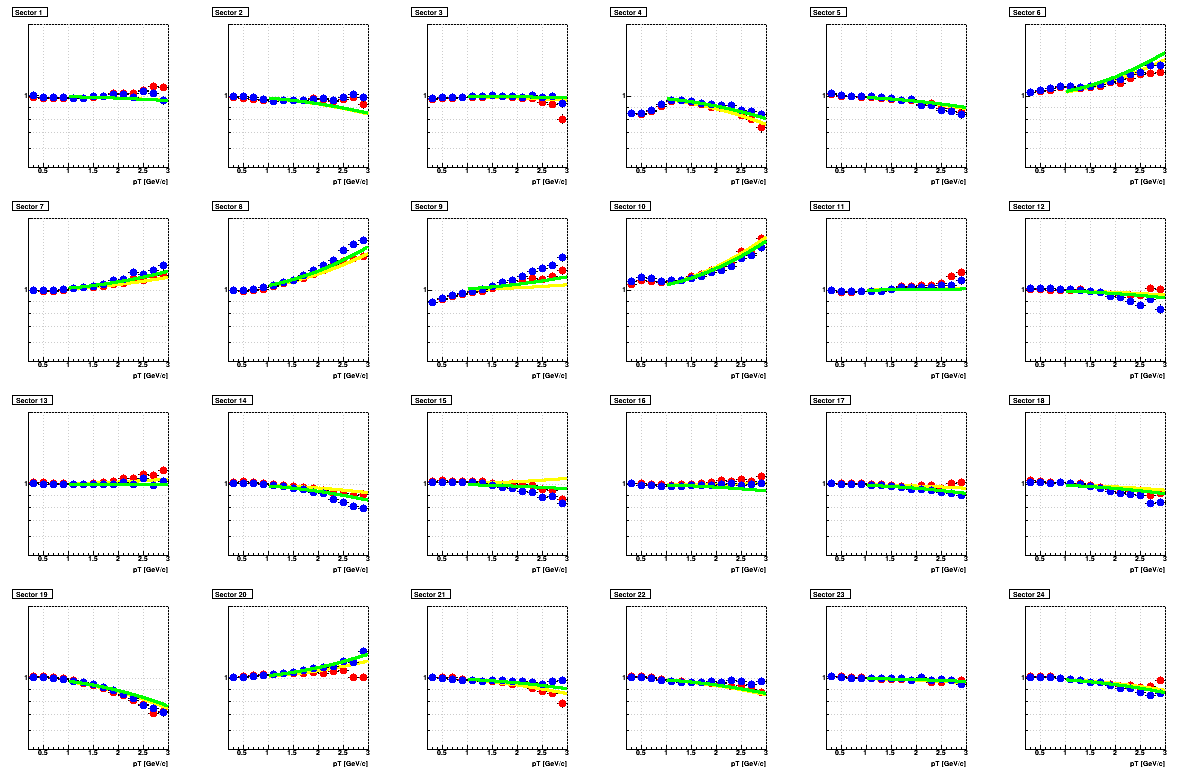
In the above plots, the function exp(B*pT2) was fit and the parameter B extracted. The choice of this functional form is that it corresponds to what should be seen in the case of a pT shift that goes as δ(pT) = q*C*pT2 as expected for shifts to the space points in the TPC for spectra that are exponentially falling in pT. This was documented previously here and here.
One can see that for some sectors the fits aren't so good, and there were a couple sectors with particularly odd behavior at low pT (e.g. sector 4, 9), forcing me to start the fits above pT of 1.0 GeV/c. Nevertheless, there is something to learn from these B parameter values, which are plotted all together here:
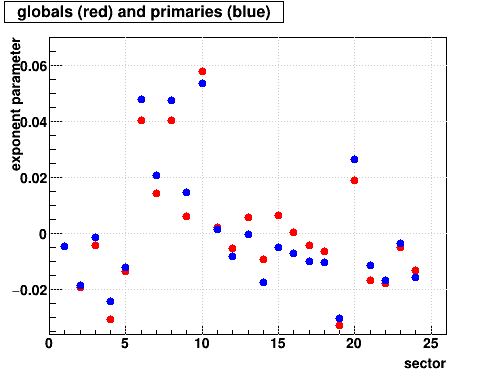
What we see is that the B parameters are generally similar for globals and primaries. In the case of perfect inner-to-outer TPC sector alignment and imperfect super-sector alignment, the globals would see B=0 with primaries having B!=0. When the B parameters are similar for globals and primaries, it implies that the imperfection is present either in the inner-to-outer alignment or something else inherent to the sectors, and that the super-sector alignment may be reasonable as it does little to further degrade the imperfection.
There are two things we can compare these numbers against. The first is Zaochen's findings in mass2 splitting in BTOF. I have extracted zoomed images of the Zaochen's mass2 vs. phi from this document, and tried to label roughly where each sector is, though his phi is defined as the momentum vector azimuth at the primary vertex, leading to shifts leftwards for positives (black) and rightwards for negatives (blue) because the tracks are not perfectly straight (not infinite pT) and pass through the TPC at a slightly different phi than they originally pointed.
Nevertheless, I believe we can see correlations with the above B values, such as:


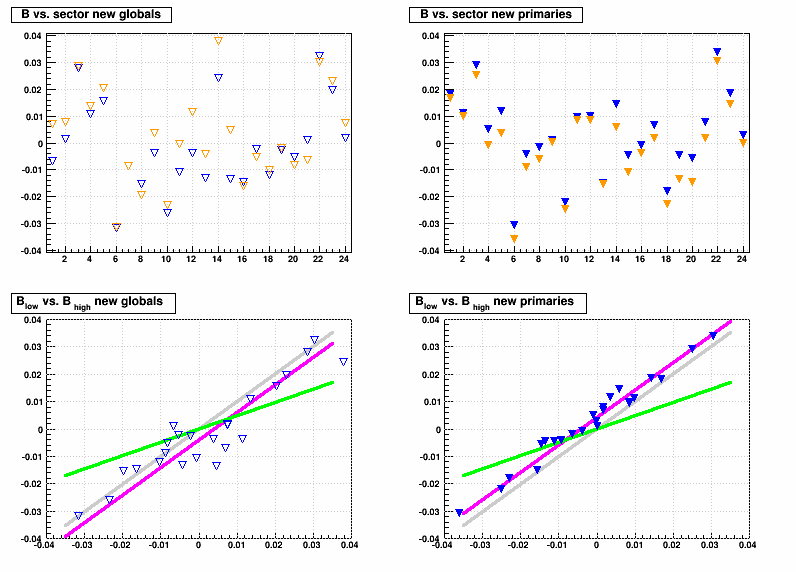
A second possible comparison is with respect to old TPC calibration work. Below is the same B parameter vs. sector from Run 12 UU193 data after the 2014 TPC alignment work. The upper two plots show these for globals (left) and primaries (right) where the two colors are for two different luminosity ranges. One can see that the scale for variations in B is very similar to the current situation.
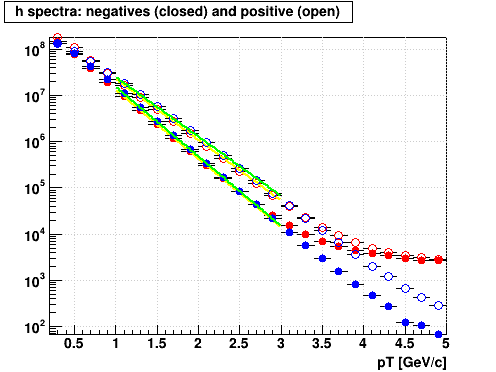
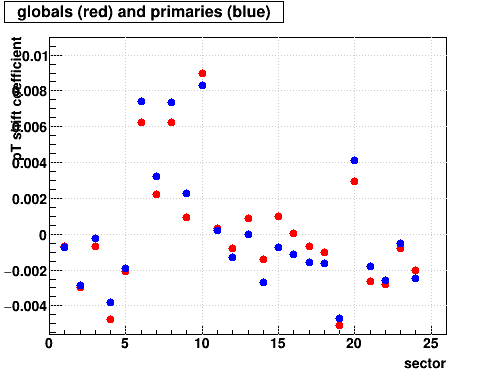
Lastly, using the math discussed here, by using the coefficients of pT in fits to the exponential pT distribution (NB: I tried an mT distribution with mass as a free parameter, and it essentially wanted the mass to go to 0, which means mT => pT, so I'm just using pT exponentials), I can convert these B parameters into the C coefficient of the δ(pT) shift = q*C*pT2 noted earlier. Here are the spectra with their fits over the same pT range that I used above for fits to the double ratios, [1.0,3.0] GeV/c, and then the plot of C values vs. sector.
-Gene
In the above plots, the function exp(B*pT2) was fit and the parameter B extracted. The choice of this functional form is that it corresponds to what should be seen in the case of a pT shift that goes as δ(pT) = q*C*pT2 as expected for shifts to the space points in the TPC for spectra that are exponentially falling in pT. This was documented previously here and here.
One can see that for some sectors the fits aren't so good, and there were a couple sectors with particularly odd behavior at low pT (e.g. sector 4, 9), forcing me to start the fits above pT of 1.0 GeV/c. Nevertheless, there is something to learn from these B parameter values, which are plotted all together here:
What we see is that the B parameters are generally similar for globals and primaries. In the case of perfect inner-to-outer TPC sector alignment and imperfect super-sector alignment, the globals would see B=0 with primaries having B!=0. When the B parameters are similar for globals and primaries, it implies that the imperfection is present either in the inner-to-outer alignment or something else inherent to the sectors, and that the super-sector alignment may be reasonable as it does little to further degrade the imperfection.
There are two things we can compare these numbers against. The first is Zaochen's findings in mass2 splitting in BTOF. I have extracted zoomed images of the Zaochen's mass2 vs. phi from this document, and tried to label roughly where each sector is, though his phi is defined as the momentum vector azimuth at the primary vertex, leading to shifts leftwards for positives (black) and rightwards for negatives (blue) because the tracks are not perfectly straight (not infinite pT) and pass through the TPC at a slightly different phi than they originally pointed.
Nevertheless, I believe we can see correlations with the above B values, such as:
- Sectors 8 and 10 on the west side and 19 on the east side have the largest effects.
- The east side has a more systematic bias over all phi, while the west side has more of a mixture of one way and then the other, leading to a lower integrated bias over all phi.
A second possible comparison is with respect to old TPC calibration work. Below is the same B parameter vs. sector from Run 12 UU193 data after the 2014 TPC alignment work. The upper two plots show these for globals (left) and primaries (right) where the two colors are for two different luminosity ranges. One can see that the scale for variations in B is very similar to the current situation.
Lastly, using the math discussed here, by using the coefficients of pT in fits to the exponential pT distribution (NB: I tried an mT distribution with mass as a free parameter, and it essentially wanted the mass to go to 0, which means mT => pT, so I'm just using pT exponentials), I can convert these B parameters into the C coefficient of the δ(pT) shift = q*C*pT2 noted earlier. Here are the spectra with their fits over the same pT range that I used above for fits to the double ratios, [1.0,3.0] GeV/c, and then the plot of C values vs. sector.
-Gene
»
- genevb's blog
- Login or register to post comments