- genevb's home page
- Posts
- 2025
- 2024
- 2023
- 2022
- September (1)
- 2021
- 2020
- 2019
- December (1)
- October (4)
- September (2)
- August (6)
- July (1)
- June (2)
- May (4)
- April (2)
- March (3)
- February (3)
- 2018
- 2017
- December (1)
- October (3)
- September (1)
- August (1)
- July (2)
- June (2)
- April (2)
- March (2)
- February (1)
- 2016
- November (2)
- September (1)
- August (2)
- July (1)
- June (2)
- May (2)
- April (1)
- March (5)
- February (2)
- January (1)
- 2015
- December (1)
- October (1)
- September (2)
- June (1)
- May (2)
- April (2)
- March (3)
- February (1)
- January (3)
- 2014
- December (2)
- October (2)
- September (2)
- August (3)
- July (2)
- June (2)
- May (2)
- April (9)
- March (2)
- February (2)
- January (1)
- 2013
- December (5)
- October (3)
- September (3)
- August (1)
- July (1)
- May (4)
- April (4)
- March (7)
- February (1)
- January (2)
- 2012
- December (2)
- November (6)
- October (2)
- September (3)
- August (7)
- July (2)
- June (1)
- May (3)
- April (1)
- March (2)
- February (1)
- 2011
- November (1)
- October (1)
- September (4)
- August (2)
- July (4)
- June (3)
- May (4)
- April (9)
- March (5)
- February (6)
- January (3)
- 2010
- December (3)
- November (6)
- October (3)
- September (1)
- August (5)
- July (1)
- June (4)
- May (1)
- April (2)
- March (2)
- February (4)
- January (2)
- 2009
- November (1)
- October (2)
- September (6)
- August (4)
- July (4)
- June (3)
- May (5)
- April (5)
- March (3)
- February (1)
- 2008
- 2005
- October (1)
- My blog
- Post new blog entry
- All blogs
Impact of using GridLeak3D instead of GridLeakFull
Updated on Thu, 2020-05-07 18:04. Originally created by genevb on 2020-05-07 13:29.
For the Run 17 pp510 data, the GridLeak distortion correction was originally calibrated using the "3D" version of that correction. Around that time, the "Full" version of the correction was developed, but not ready in time. For the re-calibration work that was performed in 2019-2020, the "Full" version was used, and the chain option for it was properly used in test productions. However, for the SL20a physics production, a mistake occurred in using the OGridLeak3D chain option instead of the OGridLeakFull chain option. Here, I examine the impacts of that mistake.
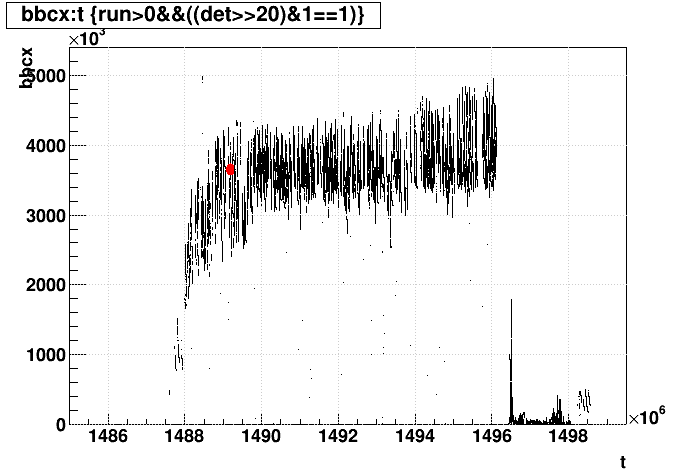
I grabbed a DAQ file we use for nightly tests and verified that during this run (18069061) the luminosity is typical of those for that year. It is seen as the red dots in this plot of BBC coincidence rate vs. unix time for Run 17:
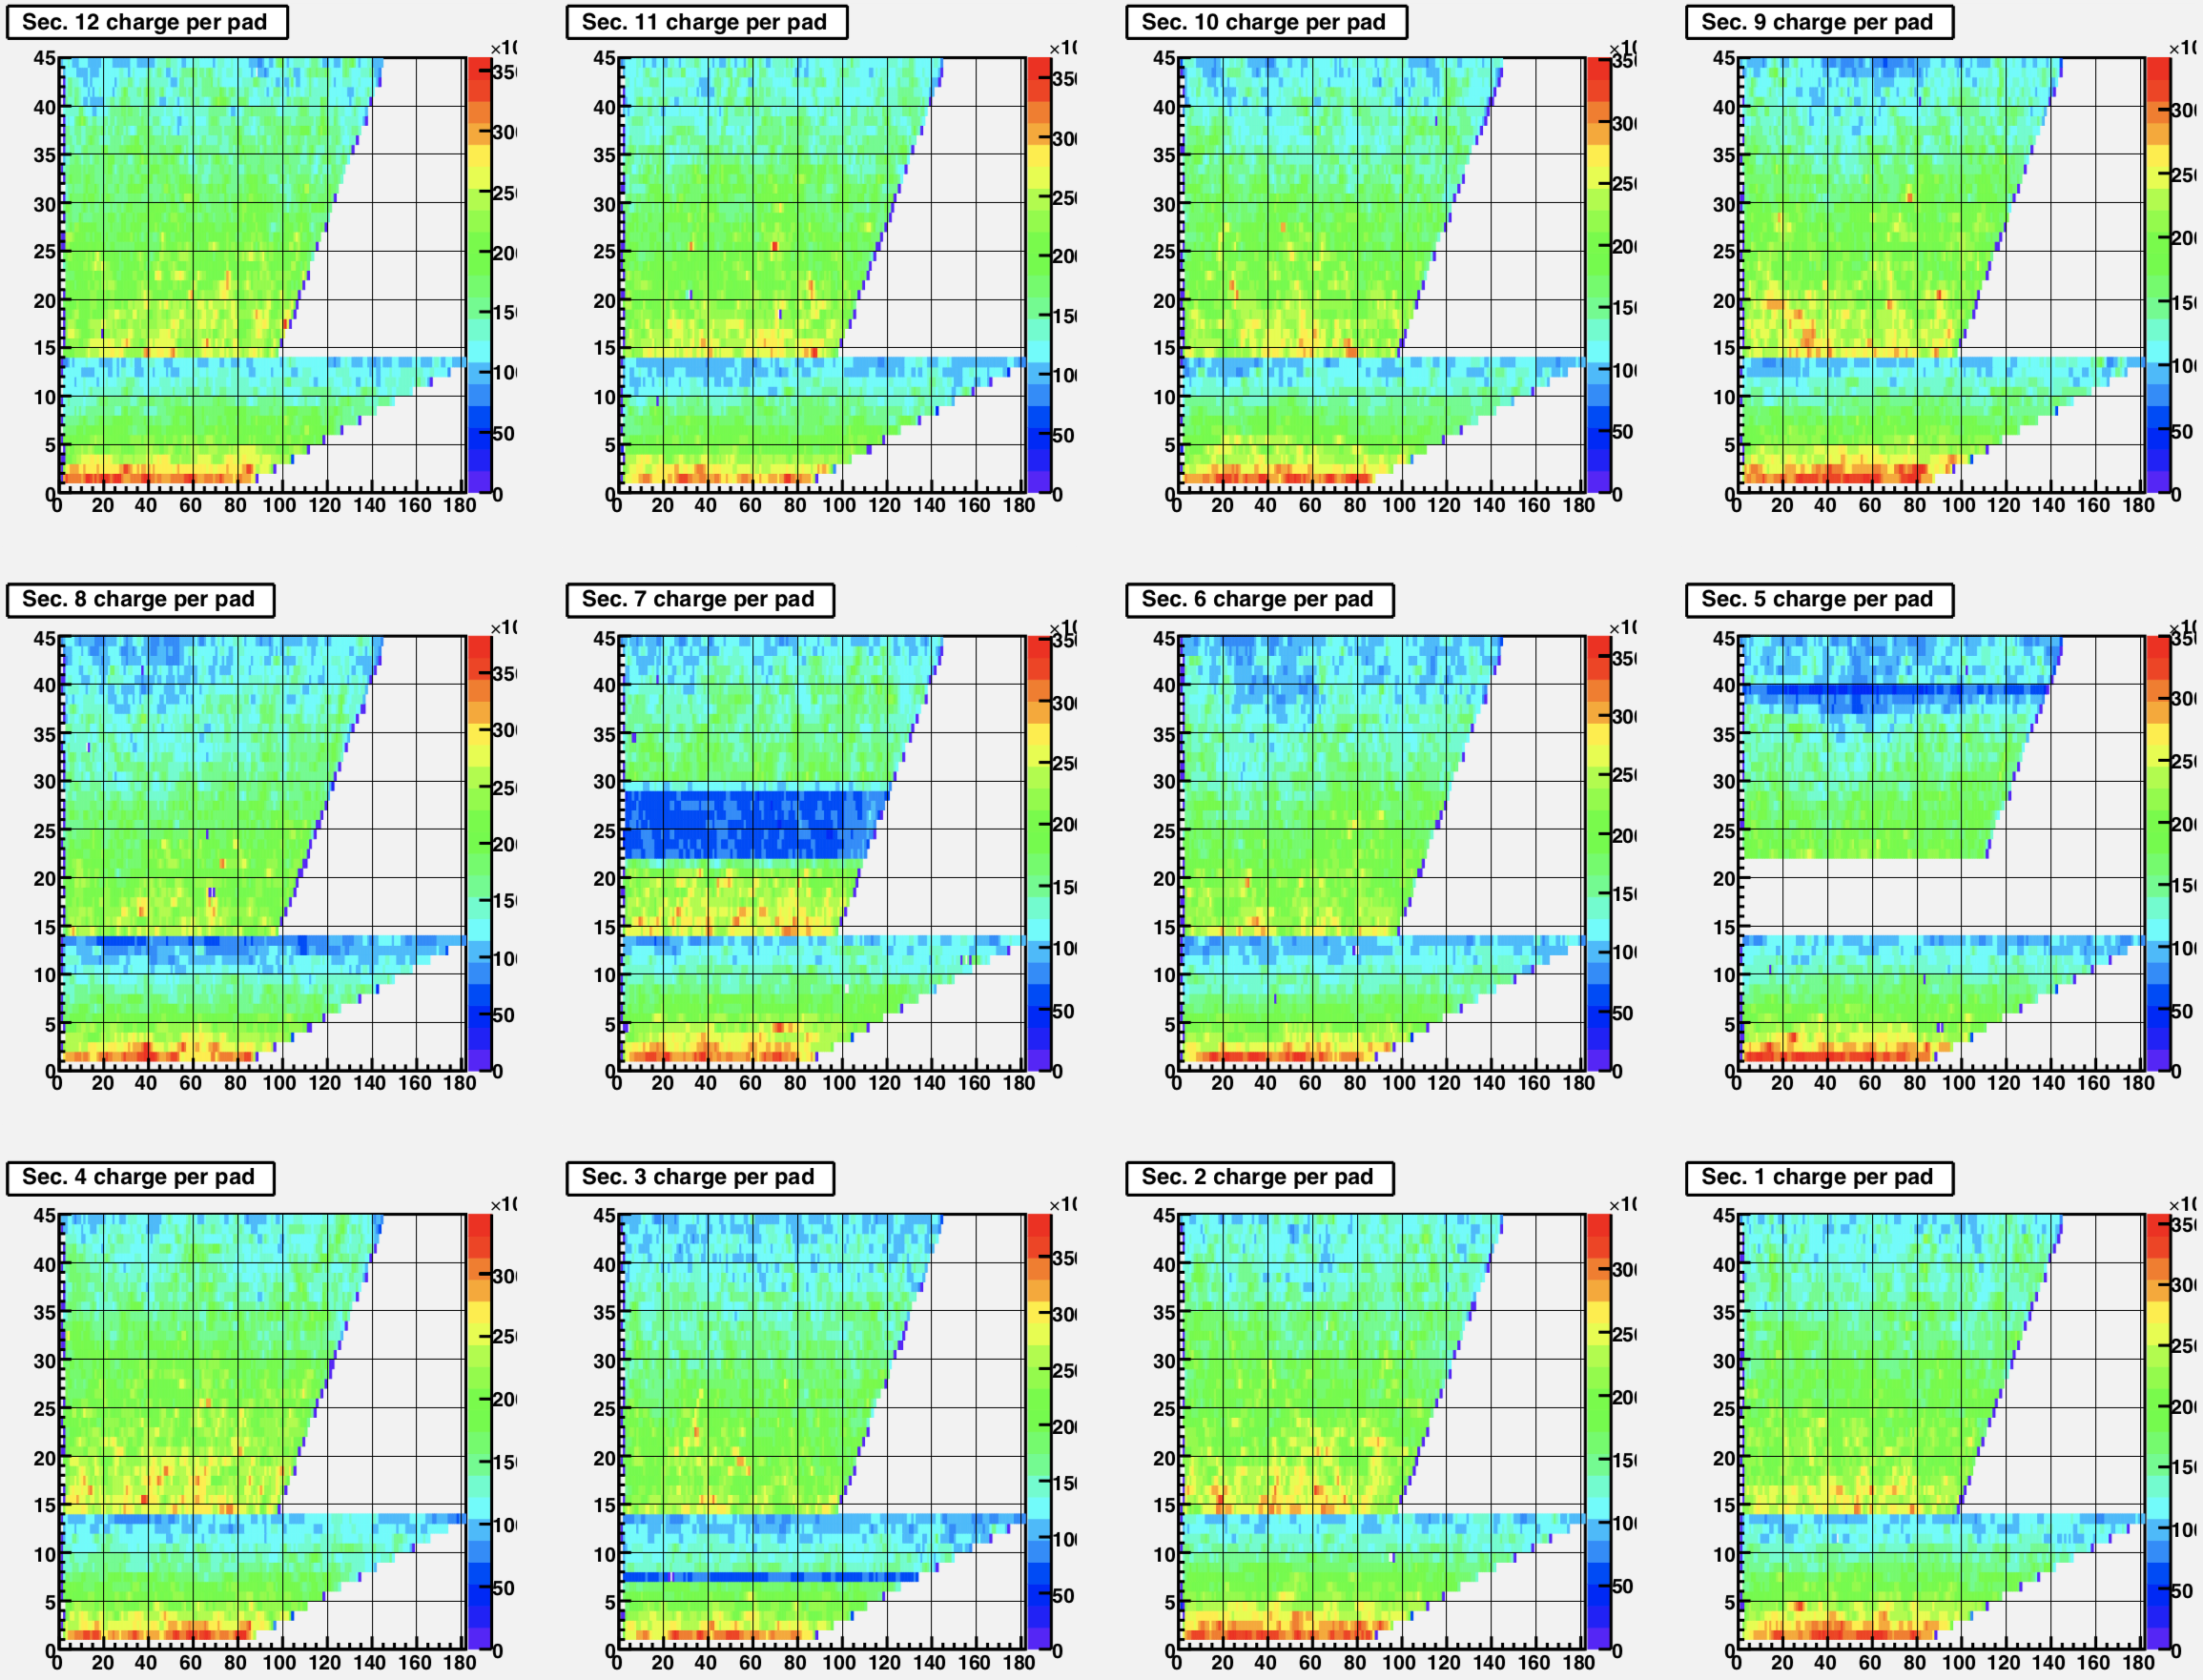
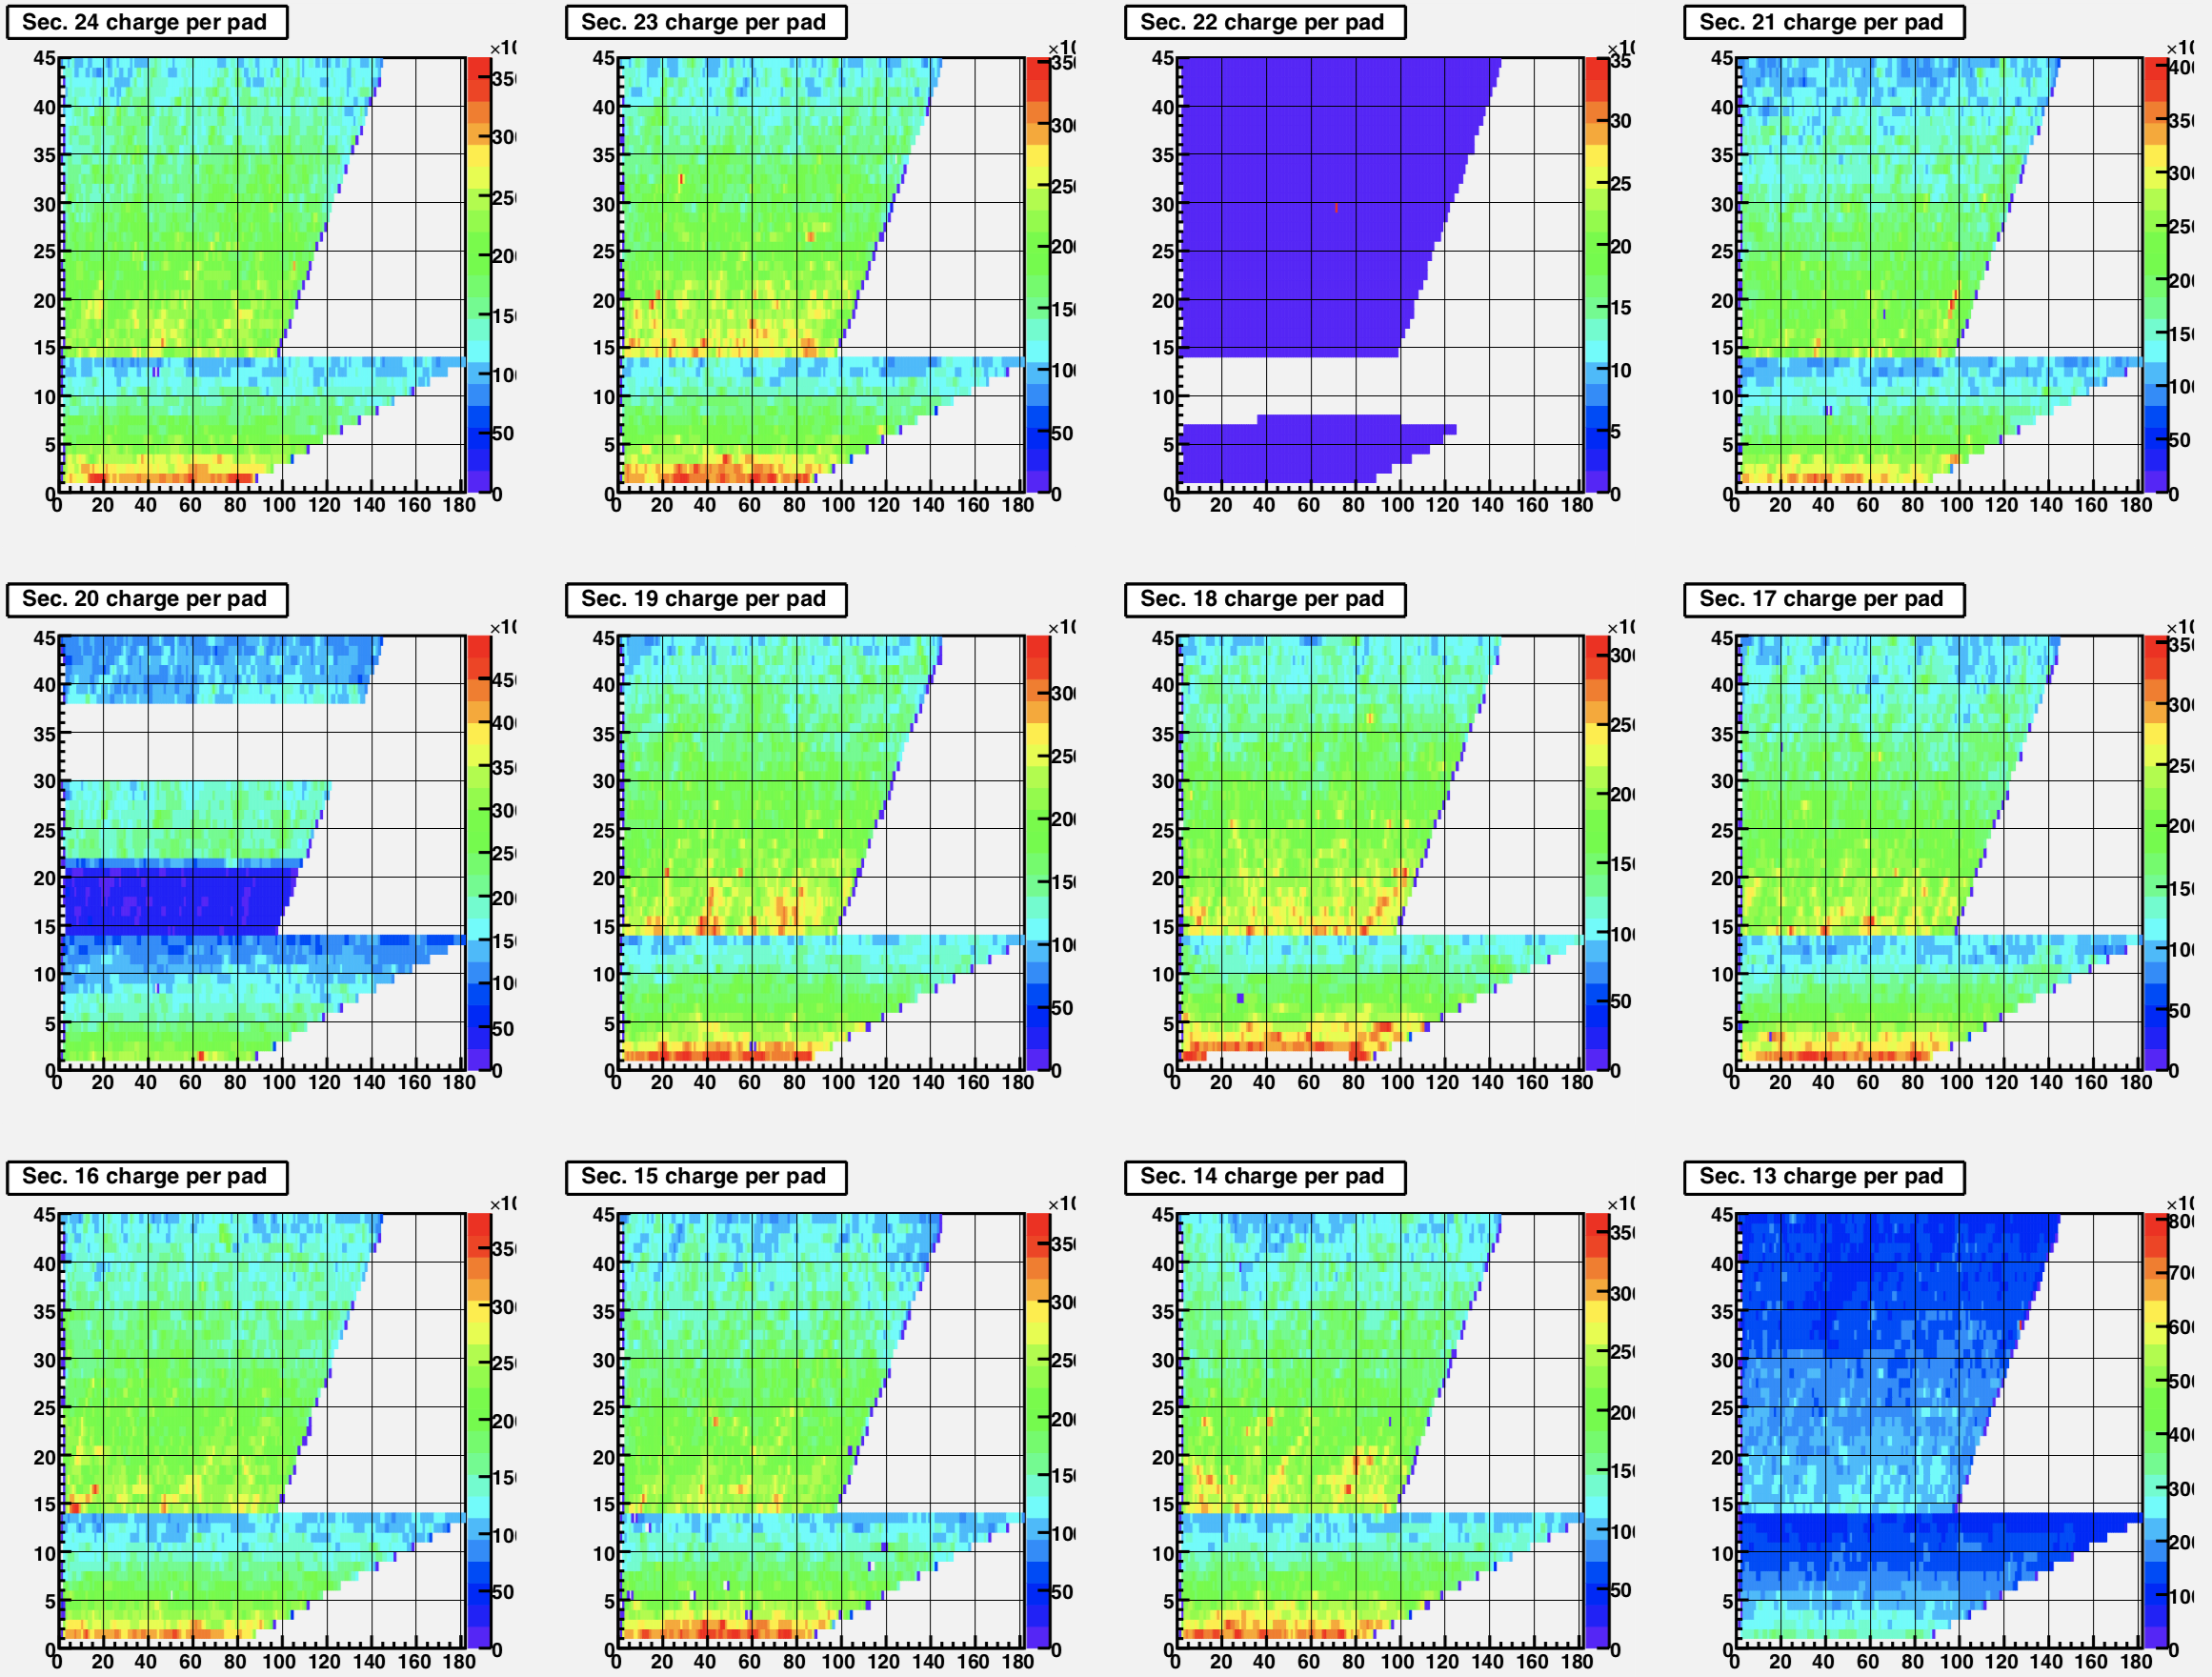
The run doesn't have a perfectly working TPC, but an imperfect TPC is typical. Here are the Online QA plots for the TPC status during this run:
Next, I processed ~5400 events using the incorrect reconstruction chain that we have been using with OGridLeak3D, and using the correct chain using OGridLeakFull, both with the options to turn on track-by-track comparisons (documentation here).
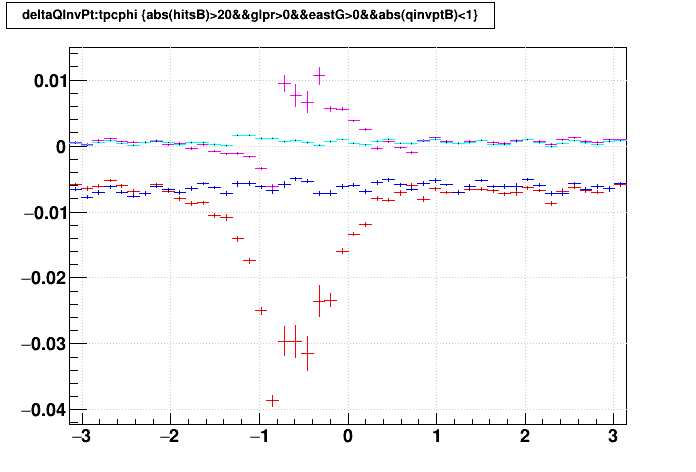
Here first are the Δ(q/pT) vs. phi [rad] for east-only TPC tracks (primaries in magenta, globals in red) and west-only TPC tracks (primaries in cyan, globals in blue). Cuts on tracks: Nhits>20, pT>1.0 GeV/c, and the globals must have a primary partner. The east-side tracks show a very significant difference in the region of TPC sector 20, which is the only sector with anomalous anode voltage where the GridLeak occurs. The "Full" version of the GridLeak distortion correction purposefully treats this region different from others, while the "3D" version treated it no differently, justifying the impact visible in this plot.
To be clear, Δ(q/pT) = q/pT|Full - q/pT|3D for tracks matched by proximity.
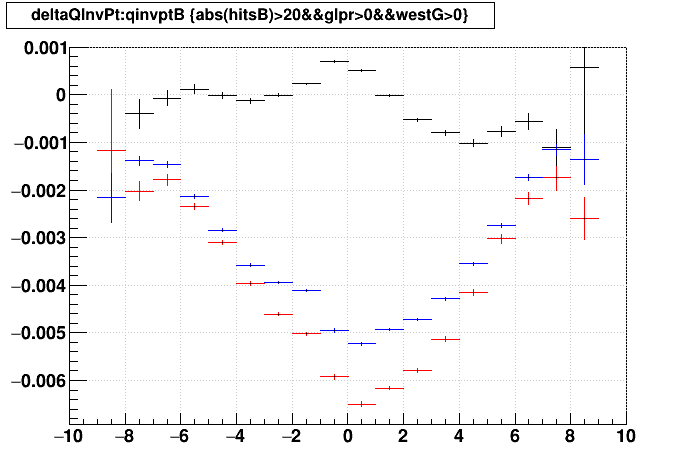
Also visible in the above plot is that primaries are impacted differently from globals. To show this a bit more clearly, I show next the dependence on q/pT for west-only, Nhits>20 TPC tracks (all globals in blue, globals with primary partners in red, and primaries in black). At high pT (near 0 along the horizontal axis of this plot), the primary tracks show opposite behavior to the global tracks, going above 0 for pT>~0.5 GeV/c. The impact on primaries is significantly less than globals.
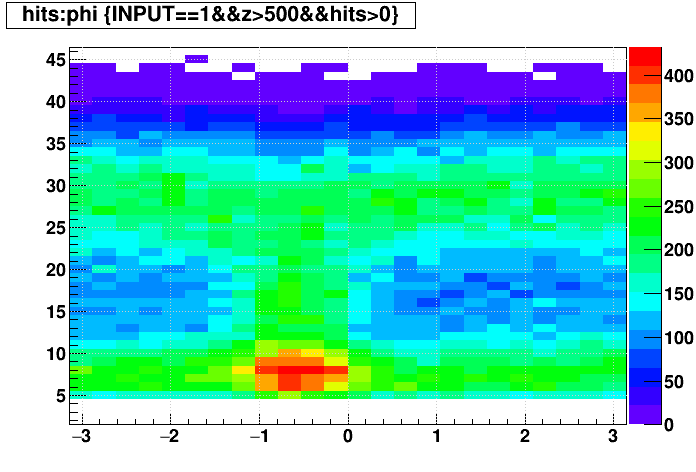
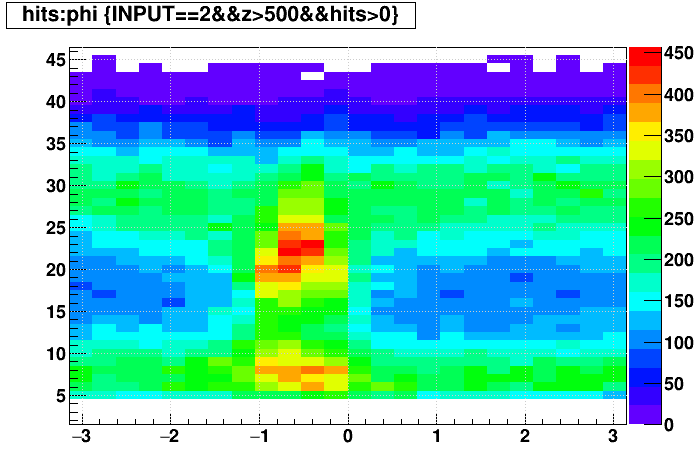
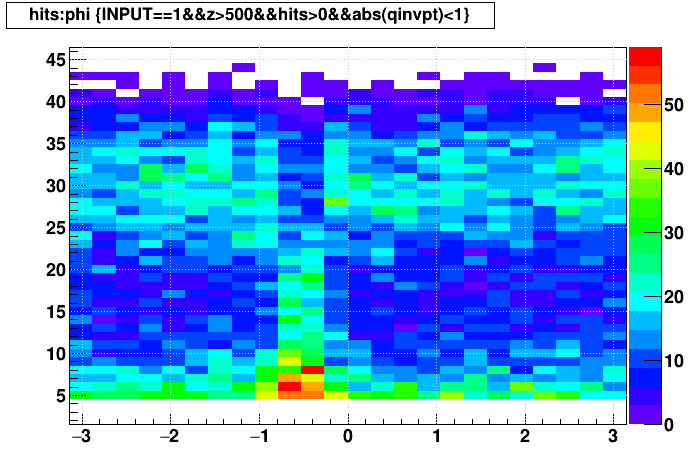
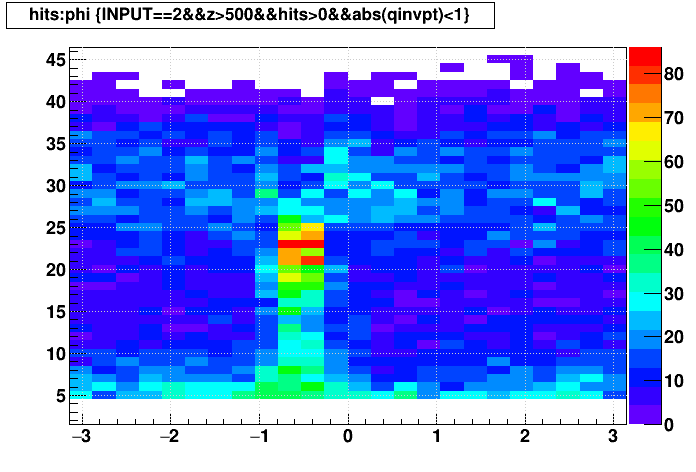
Looking back at the plot vs. phi, it is evident that statistics are low in the region near sector 20. A good question to ask is whether the "Full" GridLeak correction restores some of those tracks. Here are some plots of un-matched primary tracks in Nhits vs. phi. The left plots are for the "3D" GridLeak correction while the right plots are for "Full". The top plots are all un-matched primaries, and the bottom plots are those with pT>1 GeV/c. What's clear is that the "Full" correction has a lot of tracks in the 20-25 hits range going through sector 20 that don't appear to be present in the "3D" track collection, or perhaps are in the 5-10 hit range but unable to be matched by phase space proximity.
-Gene
I grabbed a DAQ file we use for nightly tests and verified that during this run (18069061) the luminosity is typical of those for that year. It is seen as the red dots in this plot of BBC coincidence rate vs. unix time for Run 17:
The run doesn't have a perfectly working TPC, but an imperfect TPC is typical. Here are the Online QA plots for the TPC status during this run:
Next, I processed ~5400 events using the incorrect reconstruction chain that we have been using with OGridLeak3D, and using the correct chain using OGridLeakFull, both with the options to turn on track-by-track comparisons (documentation here).
Here first are the Δ(q/pT) vs. phi [rad] for east-only TPC tracks (primaries in magenta, globals in red) and west-only TPC tracks (primaries in cyan, globals in blue). Cuts on tracks: Nhits>20, pT>1.0 GeV/c, and the globals must have a primary partner. The east-side tracks show a very significant difference in the region of TPC sector 20, which is the only sector with anomalous anode voltage where the GridLeak occurs. The "Full" version of the GridLeak distortion correction purposefully treats this region different from others, while the "3D" version treated it no differently, justifying the impact visible in this plot.
To be clear, Δ(q/pT) = q/pT|Full - q/pT|3D for tracks matched by proximity.
Also visible in the above plot is that primaries are impacted differently from globals. To show this a bit more clearly, I show next the dependence on q/pT for west-only, Nhits>20 TPC tracks (all globals in blue, globals with primary partners in red, and primaries in black). At high pT (near 0 along the horizontal axis of this plot), the primary tracks show opposite behavior to the global tracks, going above 0 for pT>~0.5 GeV/c. The impact on primaries is significantly less than globals.
Looking back at the plot vs. phi, it is evident that statistics are low in the region near sector 20. A good question to ask is whether the "Full" GridLeak correction restores some of those tracks. Here are some plots of un-matched primary tracks in Nhits vs. phi. The left plots are for the "3D" GridLeak correction while the right plots are for "Full". The top plots are all un-matched primaries, and the bottom plots are those with pT>1 GeV/c. What's clear is that the "Full" correction has a lot of tracks in the 20-25 hits range going through sector 20 that don't appear to be present in the "3D" track collection, or perhaps are in the 5-10 hit range but unable to be matched by phase space proximity.
-Gene
»
- genevb's blog
- Login or register to post comments