- genevb's home page
- Posts
- 2025
- 2024
- 2023
- 2022
- September (1)
- 2021
- 2020
- 2019
- December (1)
- October (4)
- September (2)
- August (6)
- July (1)
- June (2)
- May (4)
- April (2)
- March (3)
- February (3)
- 2018
- 2017
- December (1)
- October (3)
- September (1)
- August (1)
- July (2)
- June (2)
- April (2)
- March (2)
- February (1)
- 2016
- November (2)
- September (1)
- August (2)
- July (1)
- June (2)
- May (2)
- April (1)
- March (5)
- February (2)
- January (1)
- 2015
- December (1)
- October (1)
- September (2)
- June (1)
- May (2)
- April (2)
- March (3)
- February (1)
- January (3)
- 2014
- December (2)
- October (2)
- September (2)
- August (3)
- July (2)
- June (2)
- May (2)
- April (9)
- March (2)
- February (2)
- January (1)
- 2013
- December (5)
- October (3)
- September (3)
- August (1)
- July (1)
- May (4)
- April (4)
- March (7)
- February (1)
- January (2)
- 2012
- December (2)
- November (6)
- October (2)
- September (3)
- August (7)
- July (2)
- June (1)
- May (3)
- April (1)
- March (2)
- February (1)
- 2011
- November (1)
- October (1)
- September (4)
- August (2)
- July (4)
- June (3)
- May (4)
- April (9)
- March (5)
- February (6)
- January (3)
- 2010
- December (3)
- November (6)
- October (3)
- September (1)
- August (5)
- July (1)
- June (4)
- May (1)
- April (2)
- March (2)
- February (4)
- January (2)
- 2009
- November (1)
- October (2)
- September (6)
- August (4)
- July (4)
- June (3)
- May (5)
- April (5)
- March (3)
- February (1)
- 2008
- 2005
- October (1)
- My blog
- Post new blog entry
- All blogs
RT 3388: StiCA tracking across sector boundaries
Updated on Sat, 2019-04-13 23:43. Originally created by genevb on 2019-03-26 22:43.
These are plots detailing observations for RT#3388: StiCA problem across some sector boundaries
(IMPORTANT NOTES: (1) It was determined later that it was not actually a sector-boundary-crossing problem, but that's just how it appeared. (2) The impacts of a solution to this issue are in a different blog post here.)
____
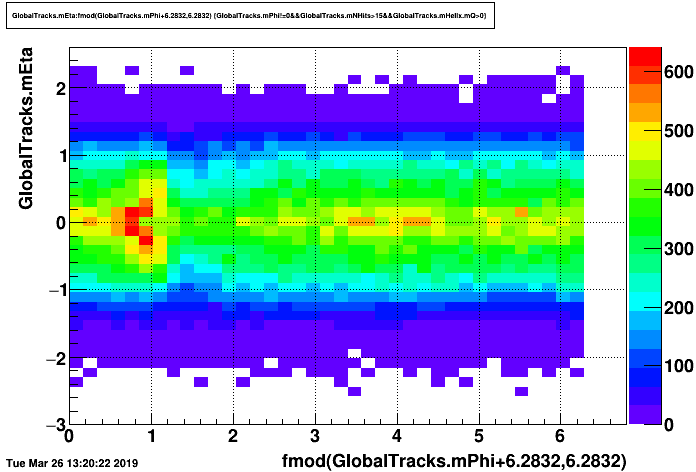
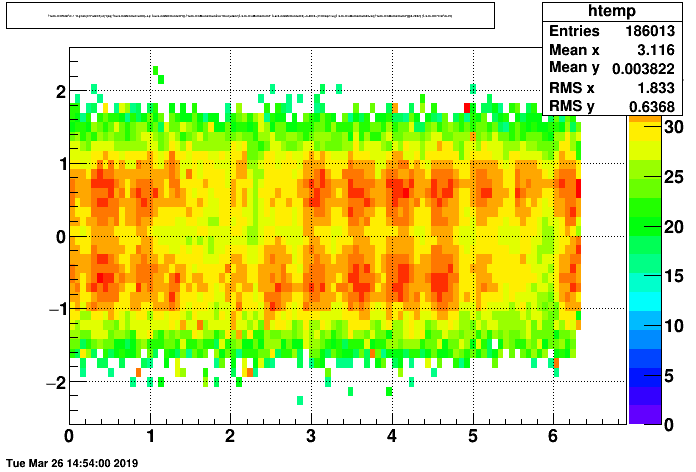
Joey Adams alerted me to issues in track reconstruction for the Run 18 AuAu27 data production in SL18h. He saw depletions in global tracks at certain phi angles, which were different for negative and positive charge tracks, and which extended in a symmetric fashion across all pseudorapidity. I was able to reproduce this looking at some random PicoDsts, but I also see there's an excess in global tracks at a neighboring phi region next to the depletion. Here we see track distributions in pseudorapidity vs. phi for positive (left) and negative (right) tracks with Nhits>15:
(NB: I believe Joey saw the same problem at the same phi for the 3 GeV FXT data [which is dominated by positive charge tracks] from Run 18 FastOffline, documented here, and the effect on negative tracks is even visible in this PDF.)
I made a similar plot for positives from the MuDst, demonstrating that the issue is not restricted to the PicoDst:
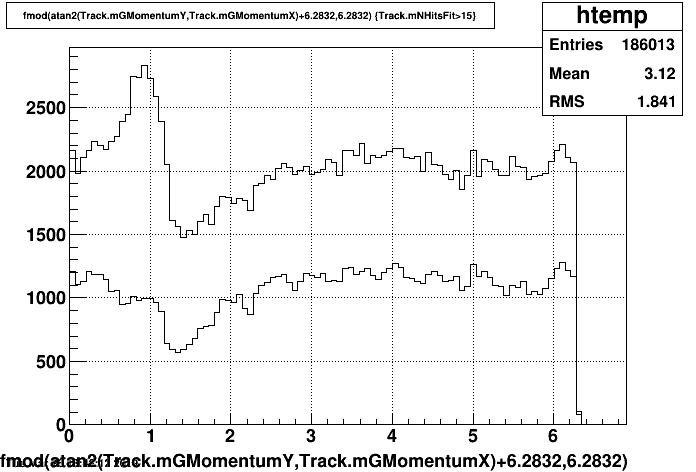
Here are the projections onto phi axis for positive global tracks (upper histogram) and positive primary tracks (lower histogram), obviating the excess and dip, and showing that the excess is somehow absent in the primary tracks:
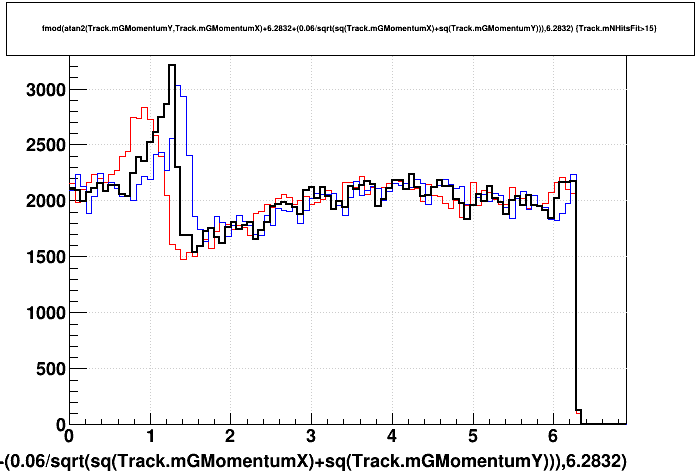
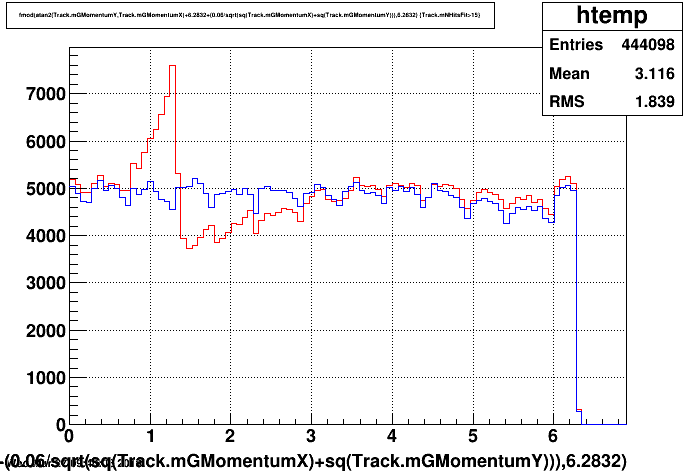
These phi angles are determined from the momentum vector direction at (primary) or near (global) the primary vertex. To see if this associates more specifically to a TPC sector, I made the plot for globals at r=0 [red], r=120 cm (middle of TPC sector) [black], and r=155 cm (beyond middle of TPC sector) [blue], using the formula that the phi at a given radius is roughly phi at r=0 plus 0.06*(r/120 cm)2/pT. The feature appears sharpest using r=120 cm, so it seems quite likely this is a TPC sector boundary feature.
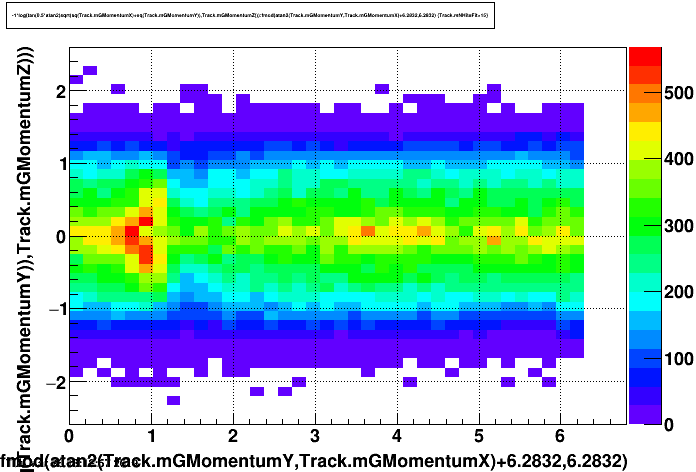
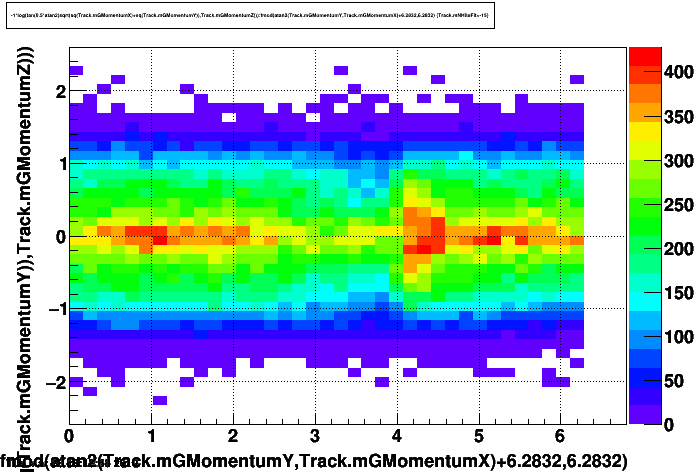
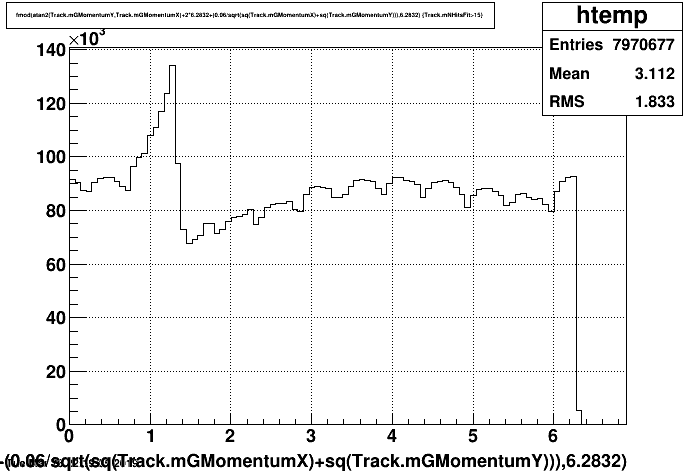
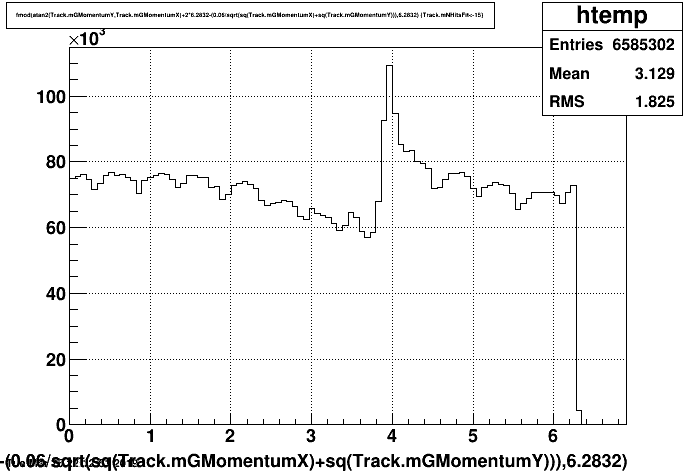
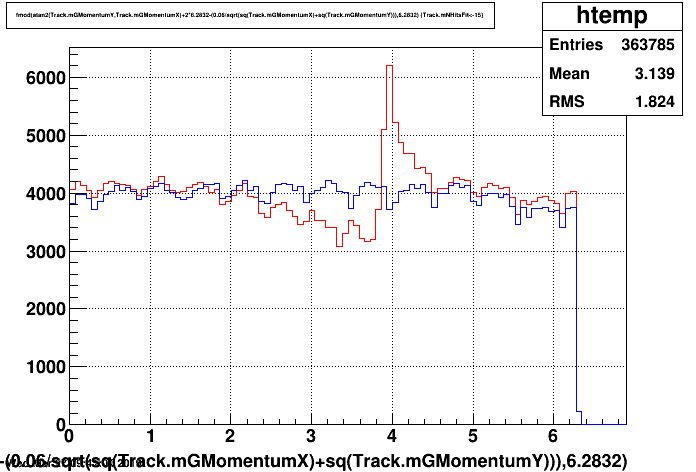
Next I made higher statistics versions of the positive and negative global track phi angles at r=120 cm:
Next up are some other plots of how track quality is impacted for positive globals...
<Nhits> as a function of pseudorapidity and phi:
Low pT distribution and <pT> vs. phi:
These are clearly non-negligible effects.
__________________
Other tests:
So it seems that StiCA is the culprit, and it appears to be isolated to Run 18 data (geometry?).
-Gene
___________________
UPDATE 2019-03-29:
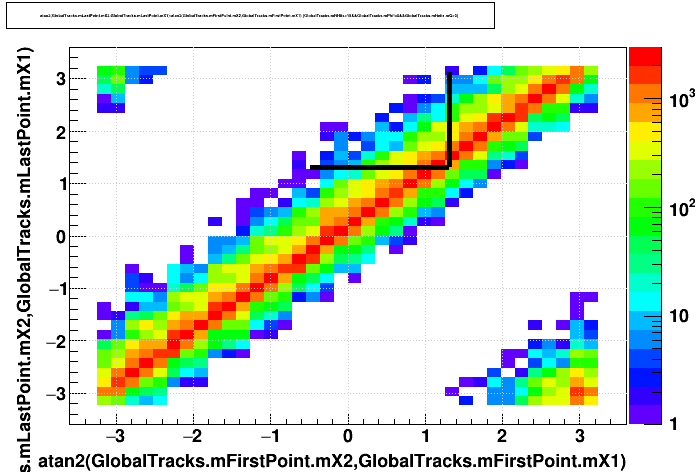
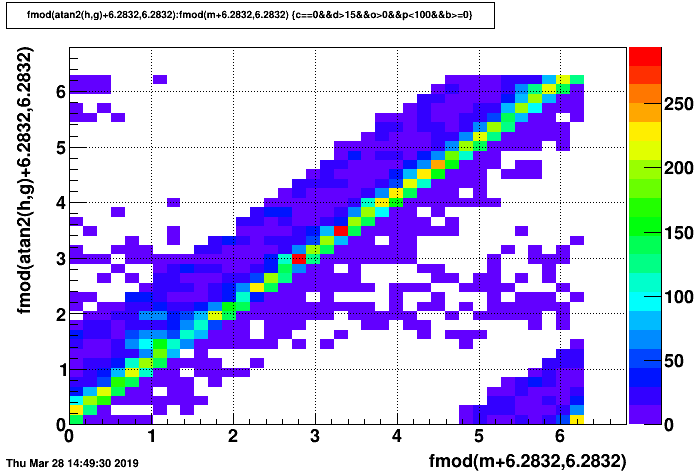
I looked at the locations of first and last hits on tracks, and things seem to look reasonably distributed there. The phi and pT that are used in the MuDst and PicoDst are calculated at the DCA point (phi here is the direction of the momentum vector). Here is the phi of the last hit vs. the phi of the first hit on the track for positives. If the problem is tracking across the boundary between sectors at 1 o'clock and 12 o'clock, then the issue will show up as a depletion in area bounded by the black lines (e.g. track starts in sector 1 but ends in sector 12). But no depletion is apparent! I fact, none of the distributions using first and last hit on track look problematic!!!!
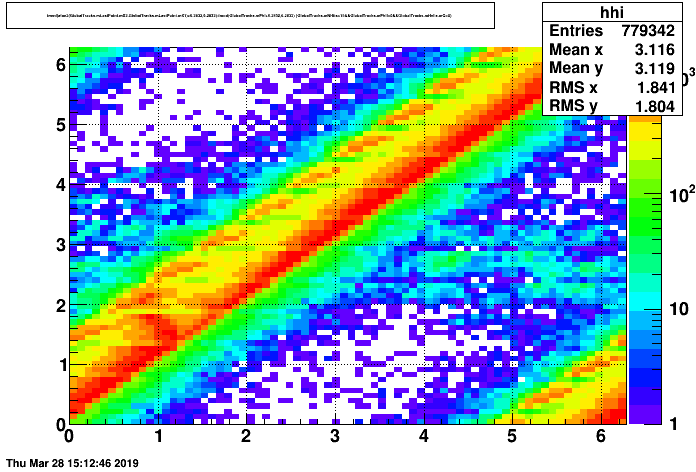
Here is another plot of the phi of the first point on the track vs. the aforementioned phi (using fewer statistics) and the phi of the last point on the track vs. the aforementioned phi (using more statistics, and in logarithmic z axis). These plots hint that IF the first and last phi are OK, it is actually the phi of the momentum vector at the DCA point that is being distributed oddly.
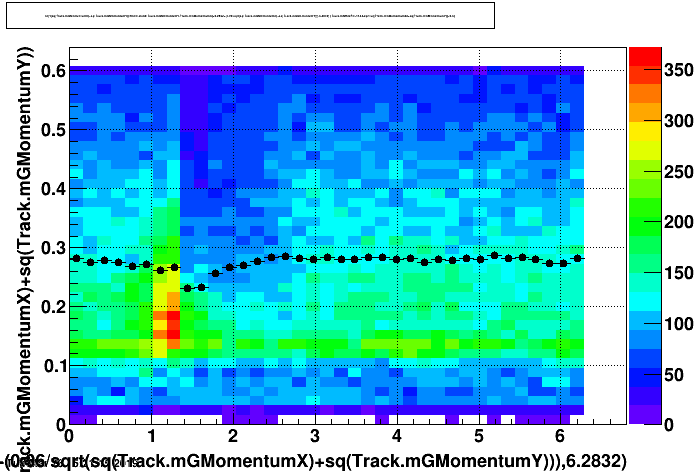
So I went back to looking at the phi that is available in the MuDst and PicoDst and the DCA point from which it is determined. Here is a plot of the radius of the DCA point position vs. phi (which is not the phi of the DCA point position, but the angle of the momentum vector there):
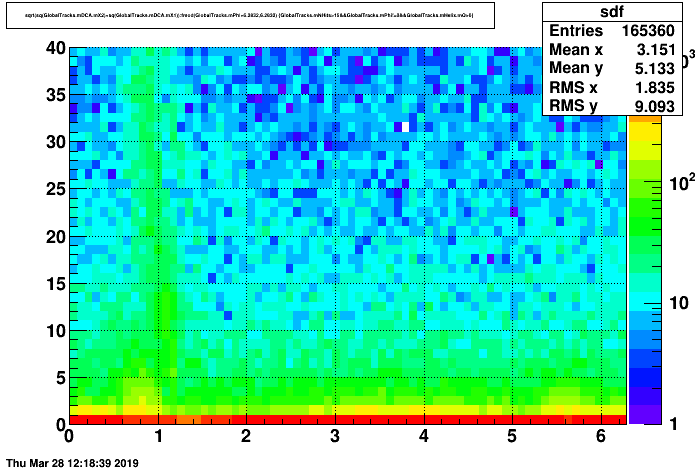
The above plot shows that the DCA points that correspond to the "excess" positive track peak are very spread out in radius!
The implication is that the DCA point and the momentum vector provided at that point are simply WRONG for these tracks. Time to look at the tracks' hits...
Here are some examples of positive tracks whose phi is very inconsistent with the azimuth of the first TPC hit on the track. The plots show the TPC hits on the track [black], the track's DCA point [red], the momentum vector at the DCA point [blue] (where the length of the vector is the pT such that 200 cm = 1 GeV/c), and the primary vertex [green]. It is striking that essentially all of these tracks are in the upper-left quadrant of the TPC (this was not part of my selection criteria in finding these tracks).
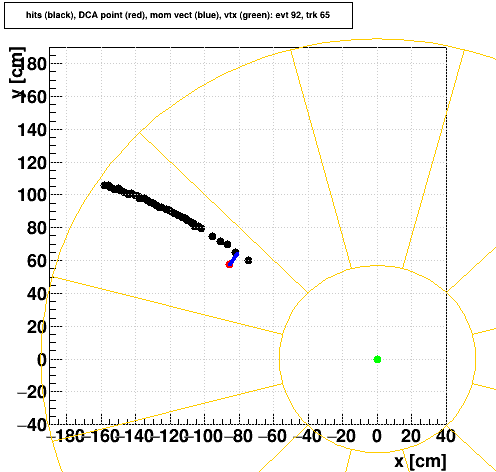
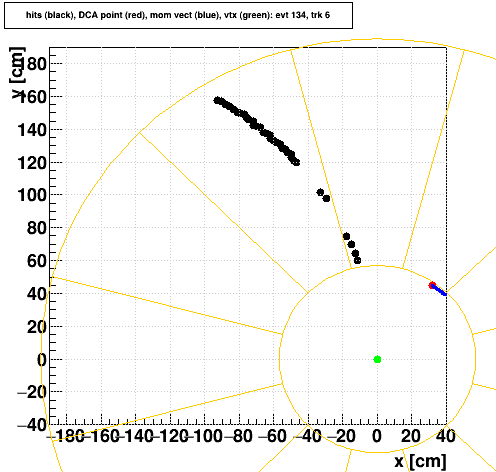
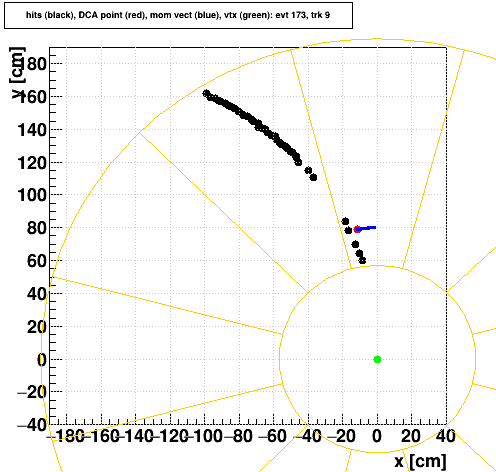
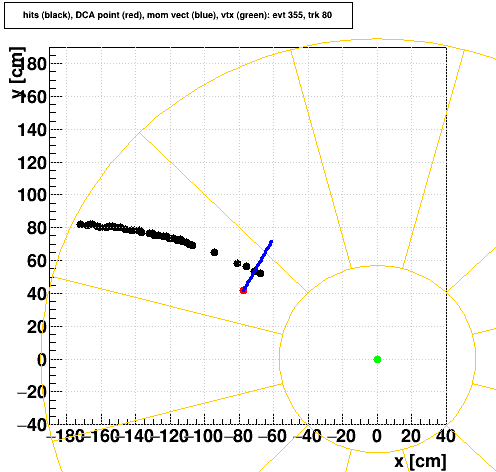

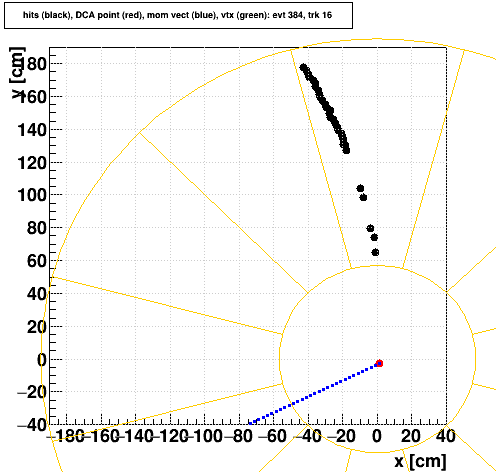
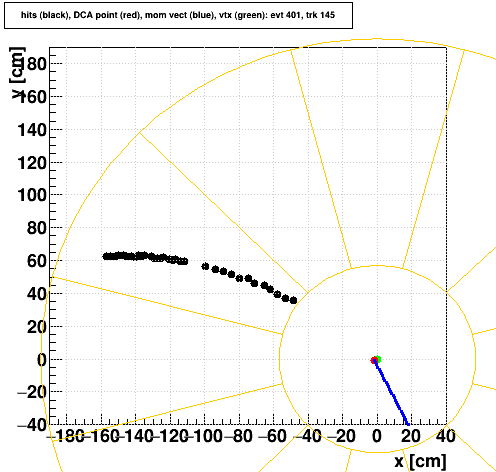
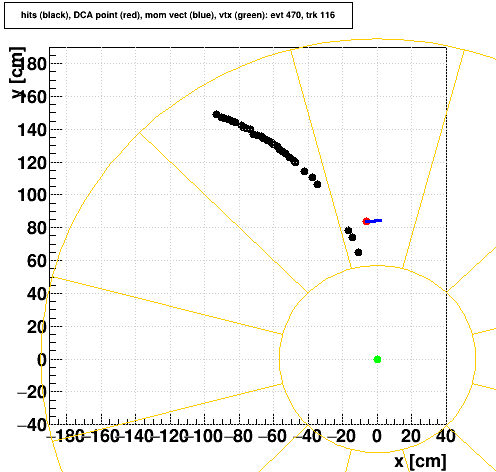
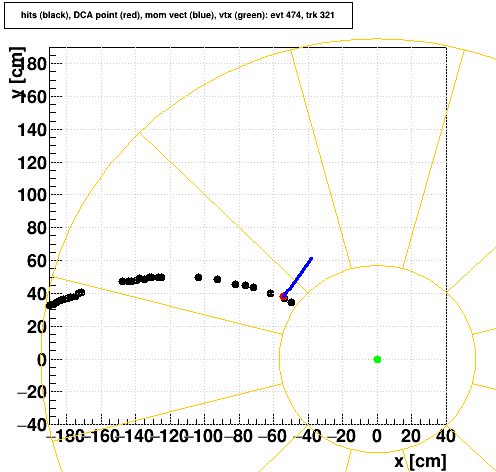
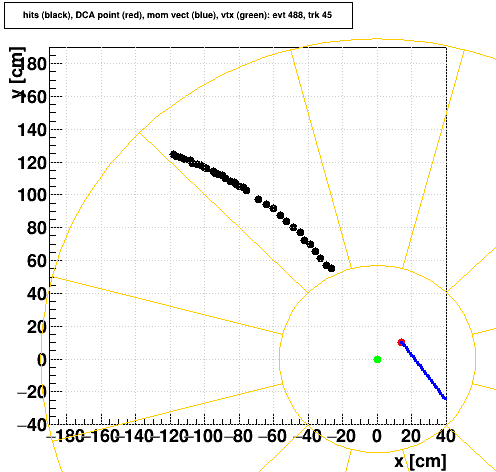
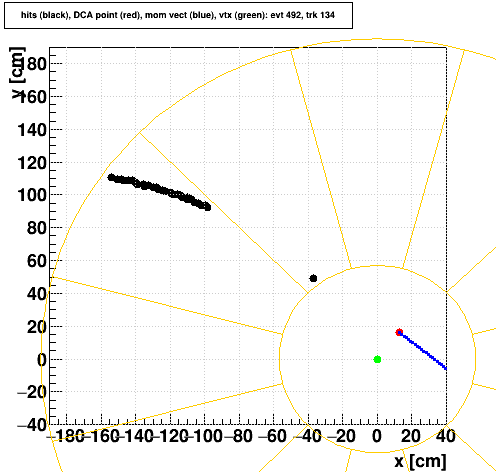
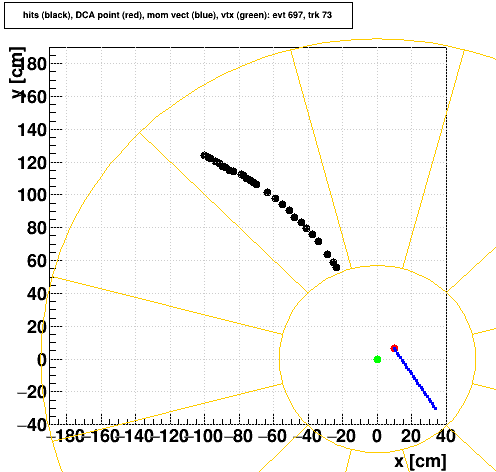
There is clearly an issue with determining the DCA point for some class of tracks that originate from this region of the TPC! I believe that for positive tracks, these are a group whose DCA, if properly calculated, would result in a momentum vector at that DCA whose direction would point towards 12 o'clock for positives, and towards 8 o'clock for negatives.
-Gene
(IMPORTANT NOTES: (1) It was determined later that it was not actually a sector-boundary-crossing problem, but that's just how it appeared. (2) The impacts of a solution to this issue are in a different blog post here.)
____
Joey Adams alerted me to issues in track reconstruction for the Run 18 AuAu27 data production in SL18h. He saw depletions in global tracks at certain phi angles, which were different for negative and positive charge tracks, and which extended in a symmetric fashion across all pseudorapidity. I was able to reproduce this looking at some random PicoDsts, but I also see there's an excess in global tracks at a neighboring phi region next to the depletion. Here we see track distributions in pseudorapidity vs. phi for positive (left) and negative (right) tracks with Nhits>15:
(NB: I believe Joey saw the same problem at the same phi for the 3 GeV FXT data [which is dominated by positive charge tracks] from Run 18 FastOffline, documented here, and the effect on negative tracks is even visible in this PDF.)
I made a similar plot for positives from the MuDst, demonstrating that the issue is not restricted to the PicoDst:
Here are the projections onto phi axis for positive global tracks (upper histogram) and positive primary tracks (lower histogram), obviating the excess and dip, and showing that the excess is somehow absent in the primary tracks:
These phi angles are determined from the momentum vector direction at (primary) or near (global) the primary vertex. To see if this associates more specifically to a TPC sector, I made the plot for globals at r=0 [red], r=120 cm (middle of TPC sector) [black], and r=155 cm (beyond middle of TPC sector) [blue], using the formula that the phi at a given radius is roughly phi at r=0 plus 0.06*(r/120 cm)2/pT. The feature appears sharpest using r=120 cm, so it seems quite likely this is a TPC sector boundary feature.
Next I made higher statistics versions of the positive and negative global track phi angles at r=120 cm:
Next up are some other plots of how track quality is impacted for positive globals...
<Nhits> as a function of pseudorapidity and phi:
Low pT distribution and <pT> vs. phi:
These are clearly non-negligible effects.
__________________
Other tests:
- SL18h vs. DEV: no significant difference, problem remains
- Run 19 data: no problem
- Run 18 isobar data: problem remains
- Run 17 data produced in SL18f: no problem
- Runs 17 and earlier data produced in DEV's nightly tests: no problem
- iTpcIT: problem remains
- non-optimized vs. optimized: no difference, problem remains
- 32-bit vs. 64-bit: no difference, problem remains
- StiCA (as used in production and all above tests) vs. Sti (default seed finder only): there is NO problem for Sti!!! See the plots below of phi at r=120 cm for 5000 events processed with StiCA (red) and Sti (blue) for positive (left) and negative (right) global tracks with Nhits>15:
So it seems that StiCA is the culprit, and it appears to be isolated to Run 18 data (geometry?).
-Gene
___________________
UPDATE 2019-03-29:
I looked at the locations of first and last hits on tracks, and things seem to look reasonably distributed there. The phi and pT that are used in the MuDst and PicoDst are calculated at the DCA point (phi here is the direction of the momentum vector). Here is the phi of the last hit vs. the phi of the first hit on the track for positives. If the problem is tracking across the boundary between sectors at 1 o'clock and 12 o'clock, then the issue will show up as a depletion in area bounded by the black lines (e.g. track starts in sector 1 but ends in sector 12). But no depletion is apparent! I fact, none of the distributions using first and last hit on track look problematic!!!!
Here is another plot of the phi of the first point on the track vs. the aforementioned phi (using fewer statistics) and the phi of the last point on the track vs. the aforementioned phi (using more statistics, and in logarithmic z axis). These plots hint that IF the first and last phi are OK, it is actually the phi of the momentum vector at the DCA point that is being distributed oddly.
So I went back to looking at the phi that is available in the MuDst and PicoDst and the DCA point from which it is determined. Here is a plot of the radius of the DCA point position vs. phi (which is not the phi of the DCA point position, but the angle of the momentum vector there):
The above plot shows that the DCA points that correspond to the "excess" positive track peak are very spread out in radius!
The implication is that the DCA point and the momentum vector provided at that point are simply WRONG for these tracks. Time to look at the tracks' hits...
Here are some examples of positive tracks whose phi is very inconsistent with the azimuth of the first TPC hit on the track. The plots show the TPC hits on the track [black], the track's DCA point [red], the momentum vector at the DCA point [blue] (where the length of the vector is the pT such that 200 cm = 1 GeV/c), and the primary vertex [green]. It is striking that essentially all of these tracks are in the upper-left quadrant of the TPC (this was not part of my selection criteria in finding these tracks).
There is clearly an issue with determining the DCA point for some class of tracks that originate from this region of the TPC! I believe that for positive tracks, these are a group whose DCA, if properly calculated, would result in a momentum vector at that DCA whose direction would point towards 12 o'clock for positives, and towards 8 o'clock for negatives.
-Gene
»
- genevb's blog
- Login or register to post comments