- genevb's home page
- Posts
- 2025
- 2024
- 2023
- 2022
- September (1)
- 2021
- 2020
- 2019
- December (1)
- October (4)
- September (2)
- August (6)
- July (1)
- June (2)
- May (4)
- April (2)
- March (3)
- February (3)
- 2018
- 2017
- December (1)
- October (3)
- September (1)
- August (1)
- July (2)
- June (2)
- April (2)
- March (2)
- February (1)
- 2016
- November (2)
- September (1)
- August (2)
- July (1)
- June (2)
- May (2)
- April (1)
- March (5)
- February (2)
- January (1)
- 2015
- December (1)
- October (1)
- September (2)
- June (1)
- May (2)
- April (2)
- March (3)
- February (1)
- January (3)
- 2014
- December (2)
- October (2)
- September (2)
- August (3)
- July (2)
- June (2)
- May (2)
- April (9)
- March (2)
- February (2)
- January (1)
- 2013
- December (5)
- October (3)
- September (3)
- August (1)
- July (1)
- May (4)
- April (4)
- March (7)
- February (1)
- January (2)
- 2012
- December (2)
- November (6)
- October (2)
- September (3)
- August (7)
- July (2)
- June (1)
- May (3)
- April (1)
- March (2)
- February (1)
- 2011
- November (1)
- October (1)
- September (4)
- August (2)
- July (4)
- June (3)
- May (4)
- April (9)
- March (5)
- February (6)
- January (3)
- 2010
- December (3)
- November (6)
- October (3)
- September (1)
- August (5)
- July (1)
- June (4)
- May (1)
- April (2)
- March (2)
- February (4)
- January (2)
- 2009
- November (1)
- October (2)
- September (6)
- August (4)
- July (4)
- June (3)
- May (5)
- April (5)
- March (3)
- February (1)
- 2008
- 2005
- October (1)
- My blog
- Post new blog entry
- All blogs
Run 12 UU TPC T0 with new alignment
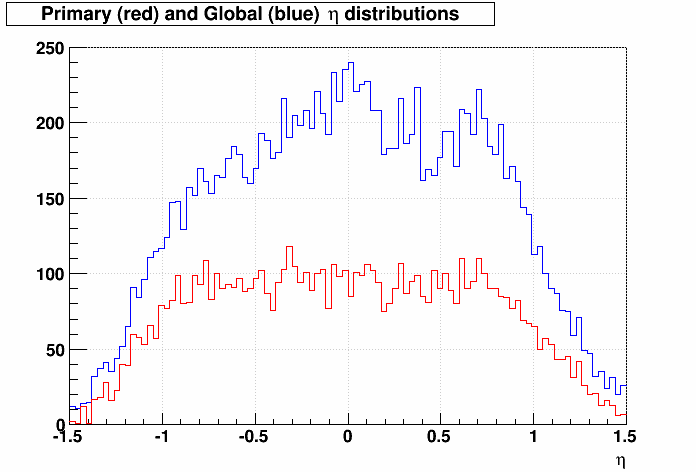
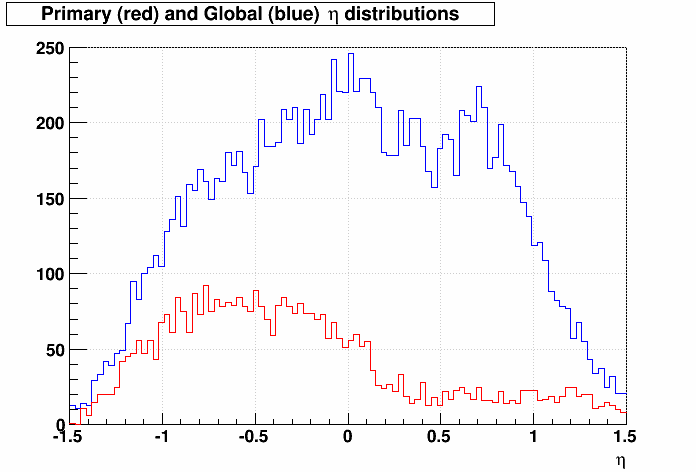
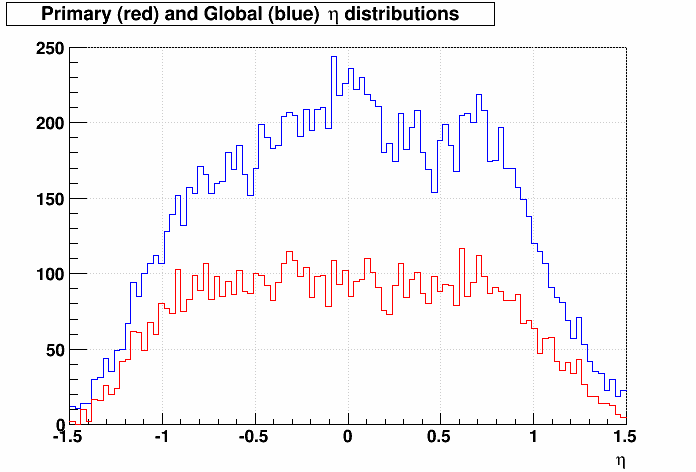
Using the new TPC alignment, Matt Posik & I observed a notable loss of west-side (positive z & η) primary tracks for use in other calibrations. Here are the raw η distributions of primary (red) and global (blue) tracks using the old alignment (first plot) and new alignment (second plot) from the first 8 events of st_physics_13132003_raw_5010005:
[note: open the plots in a new tab/window to see higher resoltuion]
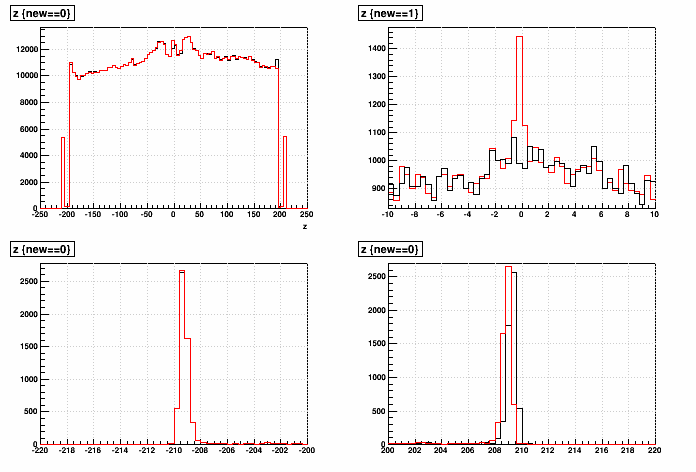
After some investigation, I found that the global T0 for the TPC was not valid for this data using the new alignment. Here are plots showing the z distribution of TPC hits using the old alignment (black) and new alignment (red). The plots are: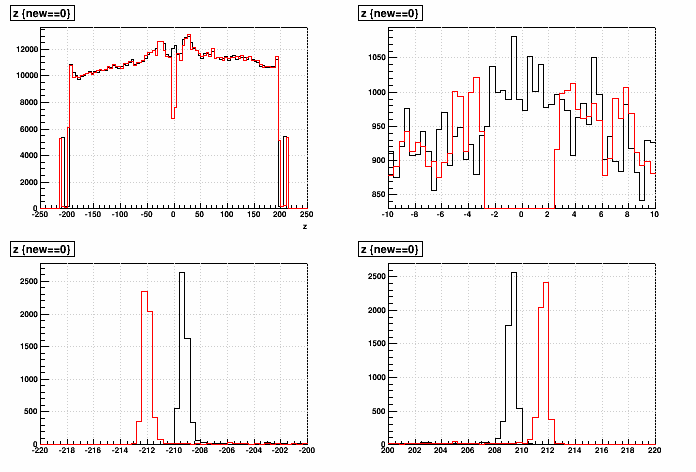
The shift in z due to erroneous TPC T0 is very apparent. For the new alignment, the database table for Calibrations/tpc/tpcElectronicsB had a tZero value of -0.119 μs. In essence, the primary vertex positions appear to be generally defined by the east-side tracks, so the east-side tracks still form primaries well, but the west-side tracks do not (an interesting finding on its own)!
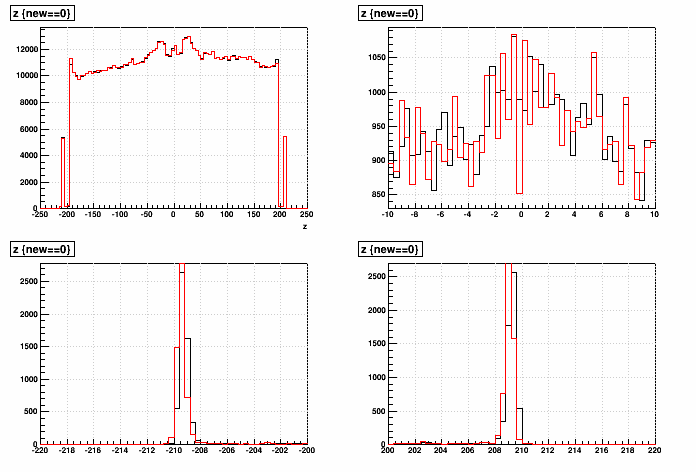
I first tried to correct this by matching the west-side prompt hits (fitting the peaks with a Gaussian), and obtained this result by adding 0.426 μs to the tZero:
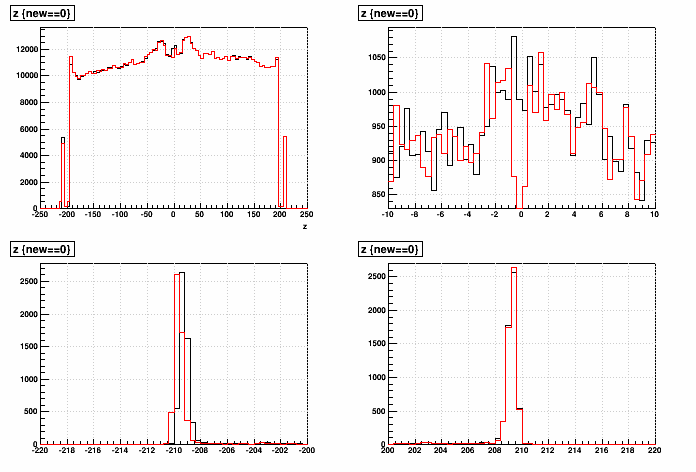
The west-side prompt hits look very good, but the east-side hits still show a difference from the old alignment, and there seems to be a gap in hits near the central membrane, indicating that the T0 has not been shifted enough.
Matching the east-side prompt hits gave a tZero shift of 0.496 μs:
As expected, this offsets the west-side prompt hits. Further, it now appears that there is an excess of hits across the central membrane. This means the T0 has been shifted too much.
So, for a preliminary calibration of the T0, I used a value half-way between the two: -0.119+0.5*(0.426+0.496) = 0.342 μs, leaving neither prompt hit peak matching their positions from the old alignment, but making the distribution of hits across the central membrane considerably smoother:
The prompt hit peaks are fit as follows: gaussian to the entire range of the below histograms, then restricting the range to the peak position ±2σ. The old and new prompt hit peak positions are tabulated and plotted here:
(errors on all values in the table are below 0.01 cm)
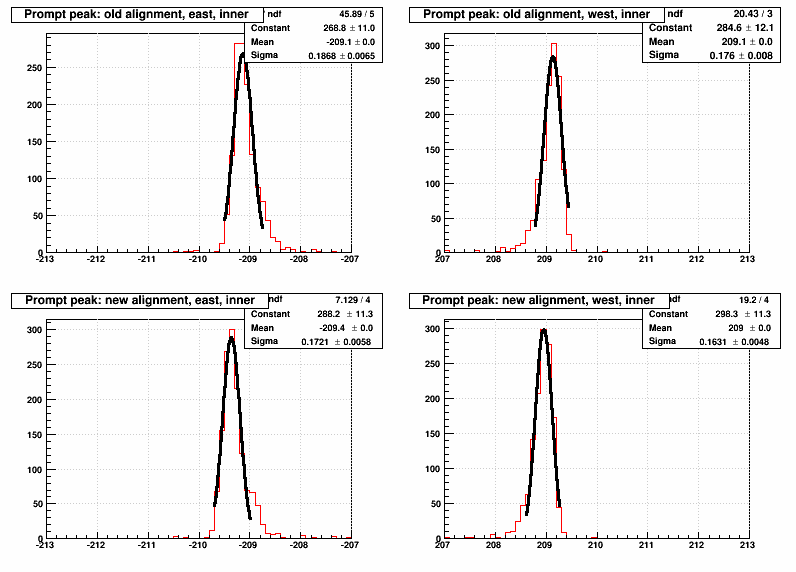
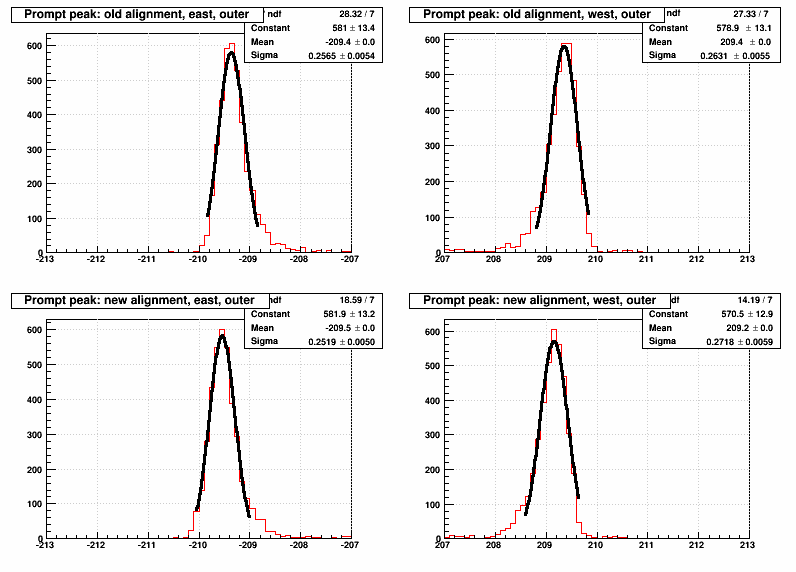
We see prompt hit peaks that were at pretty much the same |z| with the old alignment, but the new alignment separates them by ~0.4 cm. Yuri notes that his new alignment shifts the east side overall by 0.0156 cm, but the observed shift is significantly larger than this.
...Anyhow, the η distributions with this calibration now look like this (much better than before):
-Gene
[note: open the plots in a new tab/window to see higher resoltuion]
After some investigation, I found that the global T0 for the TPC was not valid for this data using the new alignment. Here are plots showing the z distribution of TPC hits using the old alignment (black) and new alignment (red). The plots are:
- Top left: full z distribution
- Top right: zoom-in near z=0 (central membrane)
- Bottom left: zoom-in near z=-210 cm (east-side prompt hits)
- Bottom right: zoom-in near z=+210 cm (west-side prompt hits)
The shift in z due to erroneous TPC T0 is very apparent. For the new alignment, the database table for Calibrations/tpc/tpcElectronicsB had a tZero value of -0.119 μs. In essence, the primary vertex positions appear to be generally defined by the east-side tracks, so the east-side tracks still form primaries well, but the west-side tracks do not (an interesting finding on its own)!
I first tried to correct this by matching the west-side prompt hits (fitting the peaks with a Gaussian), and obtained this result by adding 0.426 μs to the tZero:
The west-side prompt hits look very good, but the east-side hits still show a difference from the old alignment, and there seems to be a gap in hits near the central membrane, indicating that the T0 has not been shifted enough.
Matching the east-side prompt hits gave a tZero shift of 0.496 μs:
As expected, this offsets the west-side prompt hits. Further, it now appears that there is an excess of hits across the central membrane. This means the T0 has been shifted too much.
So, for a preliminary calibration of the T0, I used a value half-way between the two: -0.119+0.5*(0.426+0.496) = 0.342 μs, leaving neither prompt hit peak matching their positions from the old alignment, but making the distribution of hits across the central membrane considerably smoother:
The prompt hit peaks are fit as follows: gaussian to the entire range of the below histograms, then restricting the range to the peak position ±2σ. The old and new prompt hit peak positions are tabulated and plotted here:
| Positions & Widths [cm] | East Inner |
West Inner |
East Outer |
West Outer |
|---|---|---|---|---|
| Old Alignment | ||||
| New Alignment |
We see prompt hit peaks that were at pretty much the same |z| with the old alignment, but the new alignment separates them by ~0.4 cm. Yuri notes that his new alignment shifts the east side overall by 0.0156 cm, but the observed shift is significantly larger than this.
...Anyhow, the η distributions with this calibration now look like this (much better than before):
-Gene
Groups:
- genevb's blog
- Login or register to post comments