In search of nightly test slowness
As shown in previous blog posts, some of the nightly tests show very interesting behavior in the ratio of CPU time per event from one test job to another on the same dataset. Here, for example, are 500 events of 2016 AuAu200 in optimized 64-bit vs. optimized 32-bit builds from the morning of Sunday, February 23, 2020:

This of course convolutes what may be happening for the two jobs that are being compared. To see what's happening individually of CPU time per event results in a very messy graph because each event can vary significantly in how much time is needed to reconstruct the tracks. To counter this, I made some plots of CPU time per track per event, which has much less (but still far from zero) spread, and I profiled groups of 25 events together to reduce the point-to-point variation as well. Here are the 32-bit (left) and 64-bit (right) jobs separately:

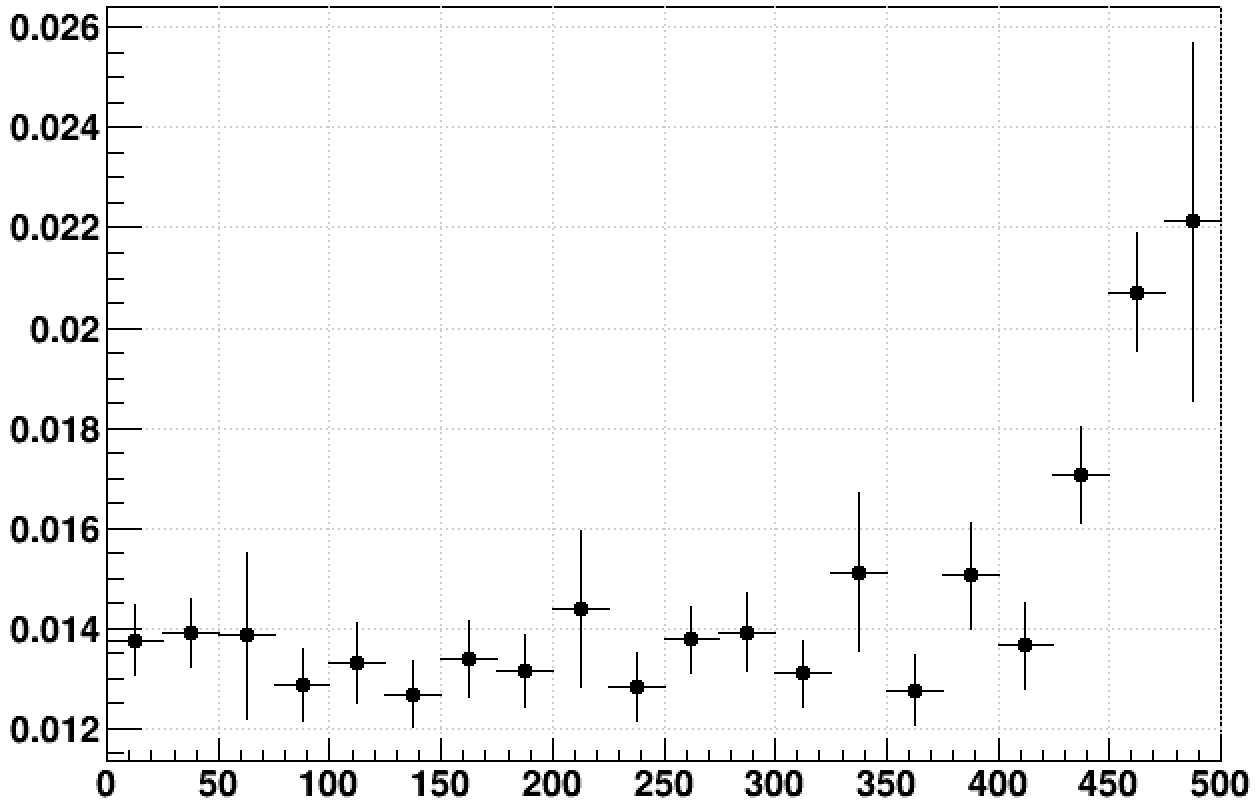
This helps clarify that the dip in the ratio plot was due to the 32-bit job slowing down, followed by that job speeding up again later at around the same events for which the 64-bit job slowed down, making the ratio shoot way up.
As it turns out, for these two tests, they were both run on the same node, rcas6187. The 32-bit job ran from 05:00 to 13:14, while the 64-bit job ran from 03:11 to 10:17. This gave me the idea to plot these overlaid as a function of time. As a proxy for time, I multiplied the event number from the file (0,1,2...,500) by the average CPU time per event from the first 250 events where things looked steady. This becomes inaccurate when the time per event changes late in the file (as seen in the above plots), but works to first order.
It turns out that these were not the only two nightly tests that used that node that night. In fact, 46 of the nightlies did! So I decided to add two more, similarly time-adjusted, to my plot comparing CPU time per track per event vs. time [seconds], where time=0 is 03:11. In this plot, black is 32-bit optimized 2016 AuAu200, red is 64-bit optimized 2016 AuAu200, blue is 32-bit 2014 AuAu200, and green is 32-bit 2015 pAu200. I have placed a vertical line at approximately 08:50, at which time all the jobs appear to slow down!

This demonstrates that the entire node slows down for well over an hour starting around 08:50 that morning.
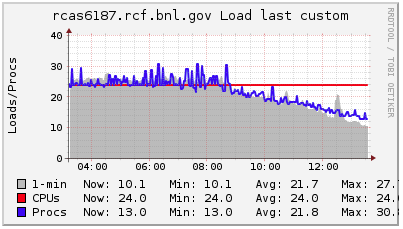
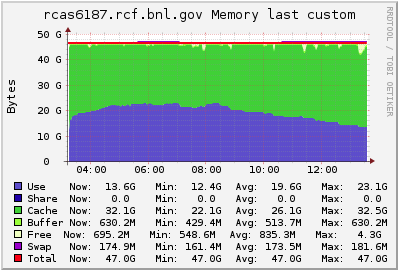
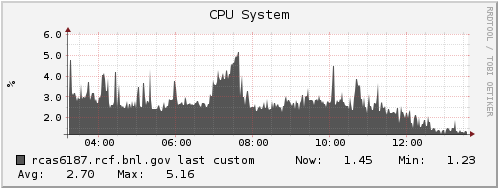
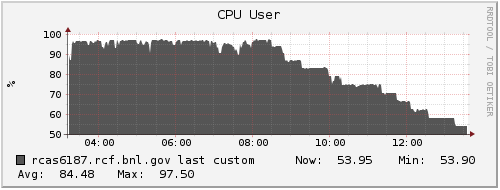
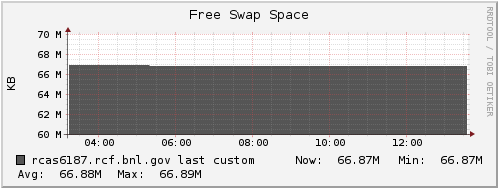
I looked at Ganglia plots for rcas6187 from that morning to see if there were other symptoms that would correlate with the period of being slow, but I did not see any obvious candidates. The only coincidental occurrence I see is that the load began ramping down from being saturated on all CPUs starting right around that time (just before 09:00 that morning). I'm attaching a zipped webarchive of the Ganglia page to this blog post, and also including some of the plots here for a quick scan:



______________
One other thought has been that what we're reporting as CPU time isn't exactly what we think it is. Could page swapping be counted in CPU time? The tool used in our StMaker framework has been TStopwatch, which reports the sum of tms_utime + tms_stime coming from the C standard times() function. So I modified StChain to report separately on tms_utime and tms_stime to find out if the slowness is specific to one or the other. What I found is that both tms_utime and tms_stime show the slowing!
Here is the ratio for the 2016 AuAu200 optimized 64-bit to 32-bit from both Wednesday & Thursday, February 26th & 27th, 2020, versus event number in the file. Here, the sum of tms_utime + tms_stime is shown in black, and is mostly obscured by the very similar results from just tms_utime shown in red:
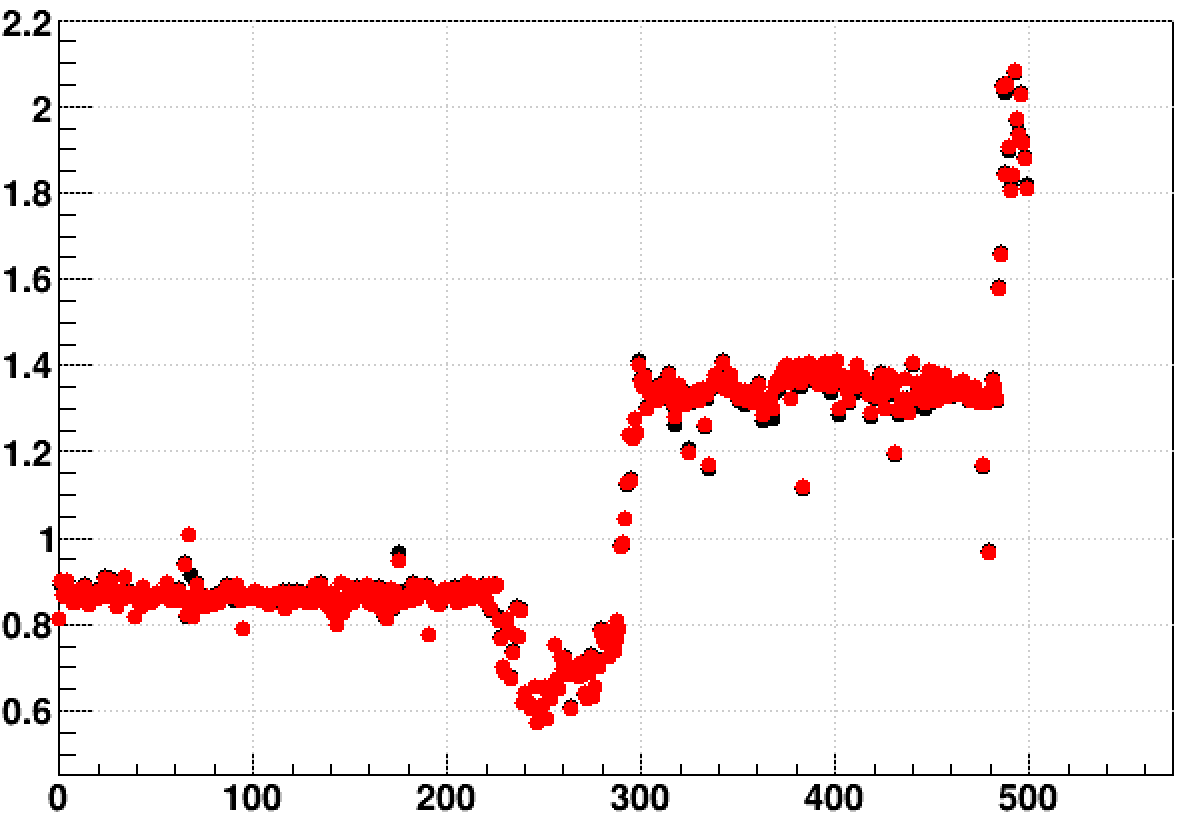
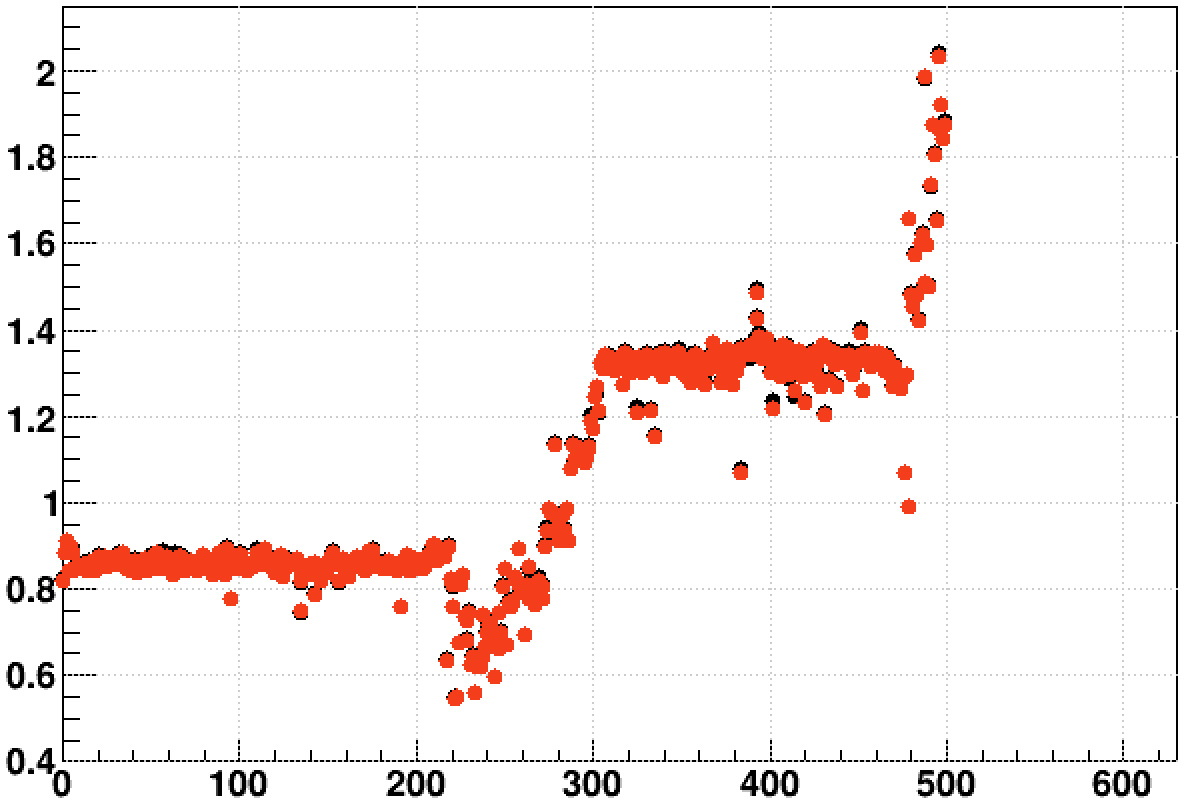
So it is apparent that the slowing down occurred to both jobs during these two days. Below are the fractions tms_stime / tms_utime for the optimized 32-bit (red) and 64-bit (black) versus event (profiled in 25-event bins):
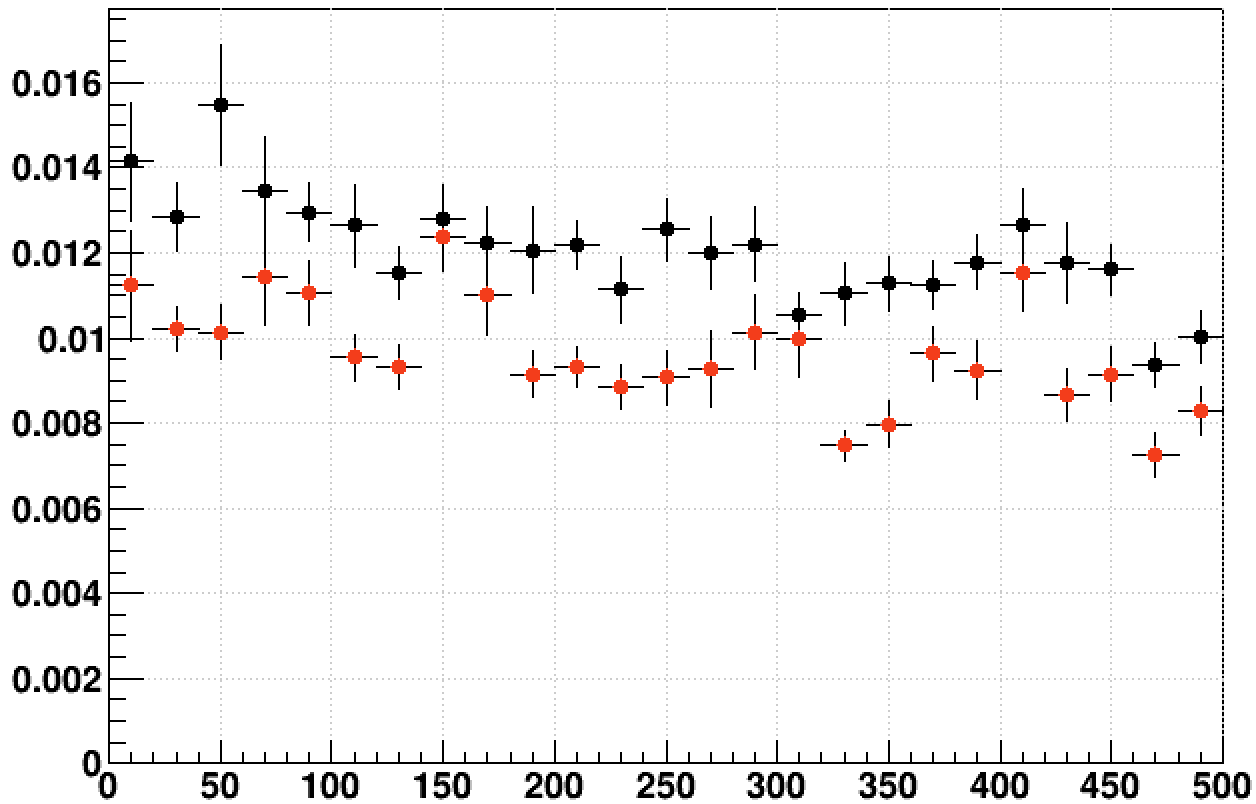
We can see that in both cases, the fraction of CPU time that is "user" CPU time varies somewhat, but doesn't show any big steps that match the big steps in the original ratio.
That still leaves us with no clear explanation for the dramatic slow-downs.
-Gene

This of course convolutes what may be happening for the two jobs that are being compared. To see what's happening individually of CPU time per event results in a very messy graph because each event can vary significantly in how much time is needed to reconstruct the tracks. To counter this, I made some plots of CPU time per track per event, which has much less (but still far from zero) spread, and I profiled groups of 25 events together to reduce the point-to-point variation as well. Here are the 32-bit (left) and 64-bit (right) jobs separately:


This helps clarify that the dip in the ratio plot was due to the 32-bit job slowing down, followed by that job speeding up again later at around the same events for which the 64-bit job slowed down, making the ratio shoot way up.
As it turns out, for these two tests, they were both run on the same node, rcas6187. The 32-bit job ran from 05:00 to 13:14, while the 64-bit job ran from 03:11 to 10:17. This gave me the idea to plot these overlaid as a function of time. As a proxy for time, I multiplied the event number from the file (0,1,2...,500) by the average CPU time per event from the first 250 events where things looked steady. This becomes inaccurate when the time per event changes late in the file (as seen in the above plots), but works to first order.
It turns out that these were not the only two nightly tests that used that node that night. In fact, 46 of the nightlies did! So I decided to add two more, similarly time-adjusted, to my plot comparing CPU time per track per event vs. time [seconds], where time=0 is 03:11. In this plot, black is 32-bit optimized 2016 AuAu200, red is 64-bit optimized 2016 AuAu200, blue is 32-bit 2014 AuAu200, and green is 32-bit 2015 pAu200. I have placed a vertical line at approximately 08:50, at which time all the jobs appear to slow down!

This demonstrates that the entire node slows down for well over an hour starting around 08:50 that morning.
I looked at Ganglia plots for rcas6187 from that morning to see if there were other symptoms that would correlate with the period of being slow, but I did not see any obvious candidates. The only coincidental occurrence I see is that the load began ramping down from being saturated on all CPUs starting right around that time (just before 09:00 that morning). I'm attaching a zipped webarchive of the Ganglia page to this blog post, and also including some of the plots here for a quick scan:


______________
One other thought has been that what we're reporting as CPU time isn't exactly what we think it is. Could page swapping be counted in CPU time? The tool used in our StMaker framework has been TStopwatch, which reports the sum of tms_utime + tms_stime coming from the C standard times() function. So I modified StChain to report separately on tms_utime and tms_stime to find out if the slowness is specific to one or the other. What I found is that both tms_utime and tms_stime show the slowing!
Here is the ratio for the 2016 AuAu200 optimized 64-bit to 32-bit from both Wednesday & Thursday, February 26th & 27th, 2020, versus event number in the file. Here, the sum of tms_utime + tms_stime is shown in black, and is mostly obscured by the very similar results from just tms_utime shown in red:


So it is apparent that the slowing down occurred to both jobs during these two days. Below are the fractions tms_stime / tms_utime for the optimized 32-bit (red) and 64-bit (black) versus event (profiled in 25-event bins):

We can see that in both cases, the fraction of CPU time that is "user" CPU time varies somewhat, but doesn't show any big steps that match the big steps in the original ratio.
That still leaves us with no clear explanation for the dramatic slow-downs.
-Gene
Groups:
- genevb's blog
- Login or register to post comments
