- genevb's home page
- Posts
- 2025
- 2024
- 2023
- 2022
- September (1)
- 2021
- 2020
- 2019
- 2018
- 2017
- December (1)
- October (3)
- September (1)
- August (1)
- July (2)
- June (2)
- April (2)
- March (2)
- February (1)
- 2016
- November (2)
- September (1)
- August (2)
- July (1)
- June (2)
- May (2)
- April (1)
- March (5)
- February (2)
- January (1)
- 2015
- December (1)
- October (1)
- September (2)
- June (1)
- May (2)
- April (2)
- March (3)
- February (1)
- January (3)
- 2014
- 2013
- 2012
- 2011
- January (3)
- 2010
- February (4)
- 2009
- 2008
- 2005
- October (1)
- My blog
- Post new blog entry
- All blogs
Sti improvements for unseen non-overlapping volumes
Changes enacted:
To convince myself of this, I wrote a small simulation (I will put the code in a comment below this blog post) where I could take rectangular volumes, and generate straight tracks which possibly intersected the volume, to get an average over an ensemble of tracks of the amount of that volume (area, really) "seen".
The simulation takes as input the dimensions of the volume (in 2D: thickness T [~radial] and width W [~azimuthal]) and the maximum crossing angle of tracks to be considered. It then creates tracks at all possible distances of passing through the center of the volume that could have a track traverse the volume given the maximum crossing angle to be considered.
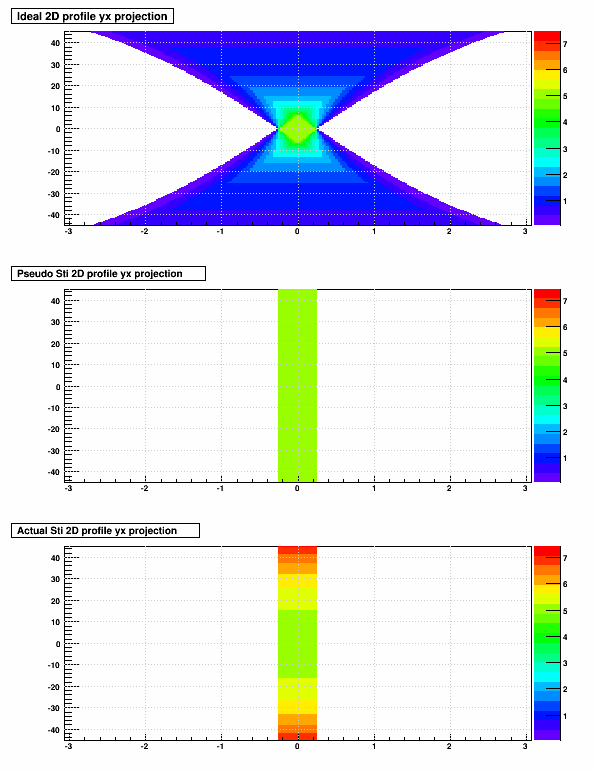
As a first example, I use a volume with width W=0.5 cm and thickness T=5 cm, and consider tracks whose maximum crossing angle is 45°. The largest distance a track may come from crossing the center of this volume for which is might intersect the volume with a crossing angle of 45° is just under 3 cm. So the next set of three plots show the average amount of material traversed [cm] (expressed as colors) as a function of this distance-from-center and crossing angle for 3 descriptions:
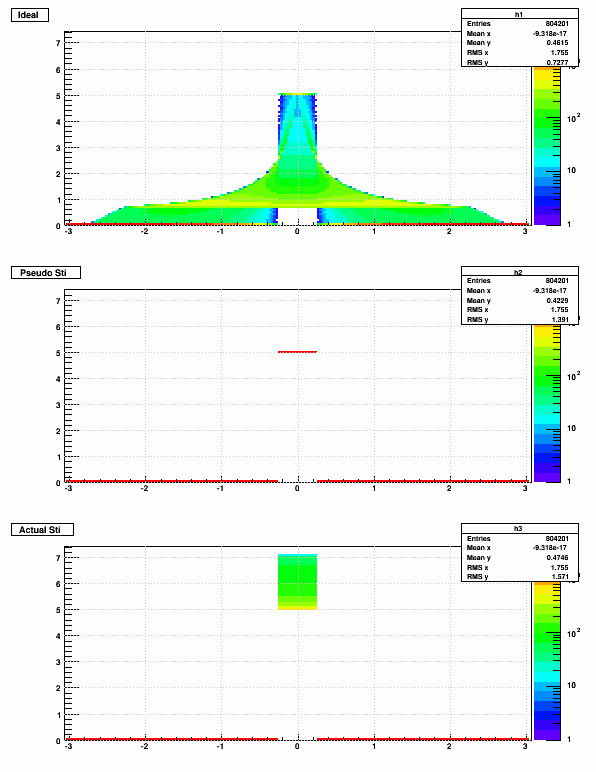
The next set of 3 plots are similar, simply showing the distribution of material traversed vs. distance-from-center (colors show number of tracks).
This demonstrates very well that Sti gets the amount of material seen incorrect for pretty much all tracks that should see a volume. How wrong? Here is a table from running my macro with different maximum crossing angles:
The table makes it clear that when tracks are nearly all radial, Sti is doing very well. Even when crossing angles are diverse, Sti is still getting the numbers right within a few percent.
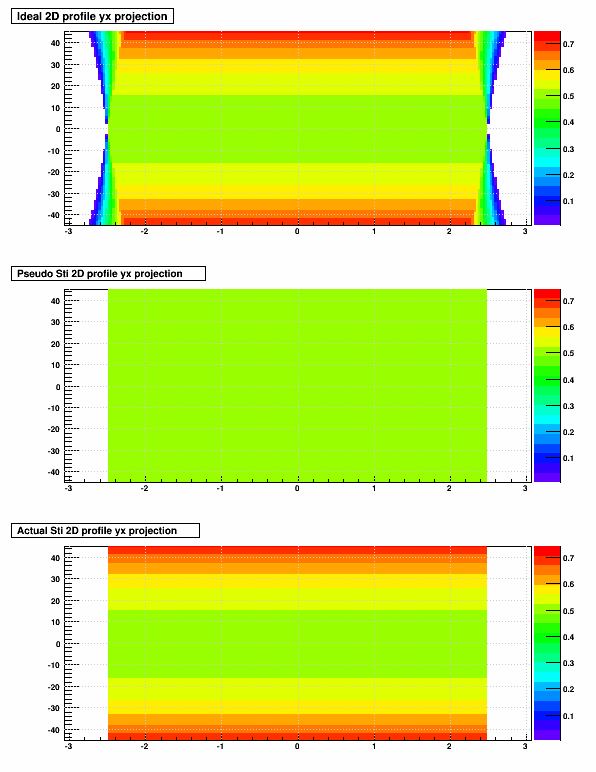
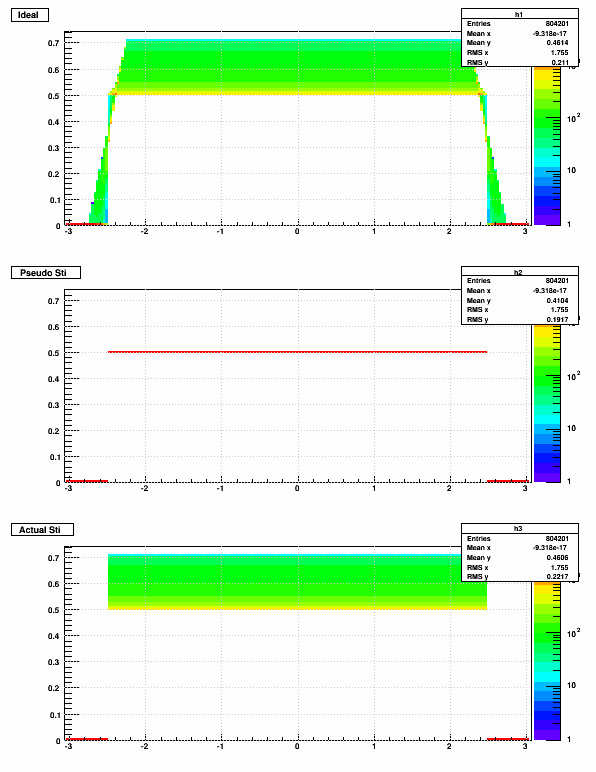
Also, when materials are oriented more azimuthally than radially, Sti does well for nearly any crossing angle. I will place the same plots as shown above now using a material with width = 5.0 cm, and thicknes 0.5 cm, but with the images shrunk down here (open them in a separate tab or window to see full scale).
-Gene
- Zero sigma for projections to inactive material
- More explicit check on undefined hit errors
- Removed truncation of volume names
To convince myself of this, I wrote a small simulation (I will put the code in a comment below this blog post) where I could take rectangular volumes, and generate straight tracks which possibly intersected the volume, to get an average over an ensemble of tracks of the amount of that volume (area, really) "seen".
The simulation takes as input the dimensions of the volume (in 2D: thickness T [~radial] and width W [~azimuthal]) and the maximum crossing angle of tracks to be considered. It then creates tracks at all possible distances of passing through the center of the volume that could have a track traverse the volume given the maximum crossing angle to be considered.
As a first example, I use a volume with width W=0.5 cm and thickness T=5 cm, and consider tracks whose maximum crossing angle is 45°. The largest distance a track may come from crossing the center of this volume for which is might intersect the volume with a crossing angle of 45° is just under 3 cm. So the next set of three plots show the average amount of material traversed [cm] (expressed as colors) as a function of this distance-from-center and crossing angle for 3 descriptions:
- Ideal: the real amount of material
- Pseudo Sti: Sti's treatment of which tracks see the material, but always assuming any track that see the material sees the thickness T
- Actual Sti: Sti's treatment of which tracks see the material, and assuming the track see the thickness divided by the cosine of the crossing angle, such that tracks typically see even more material than is possible in reality
The next set of 3 plots are similar, simply showing the distribution of material traversed vs. distance-from-center (colors show number of tracks).
This demonstrates very well that Sti gets the amount of material seen incorrect for pretty much all tracks that should see a volume. How wrong? Here is a table from running my macro with different maximum crossing angles:
| width [cm] | thickness [cm] | max. crossing angle [deg] | |||
|---|---|---|---|---|---|
| Ideal | Pseudo Sti | Actual Sti | |||
| 0.5 | 5.0 | 45° | 0.461496 | 0.422886 (0.916) | 0.474593 (1.028) |
| 0.5 | 5.0 | 40° | 0.526286 | 0.472637 (0.898) | 0.516517 (0.981) |
| 0.5 | 5.0 | 35° | 0.604097 | 0.572139 (0.947) | 0.611472 (1.012) |
| 0.5 | 5.0 | 30° | 0.700546 | 0.671642 (0.959) | 0.704635 (1.006) |
| 0.5 | 5.0 | 25° | 0.825327 | 0.820896 (0.995) | 0.848270 (1.028) |
| 0.5 | 5.0 | 20° | 0.995222 | 0.970149 (0.975) | 0.990484 (0.995) |
| 0.5 | 5.0 | 15° | 1.243447 | 1.218905 (0.980) | 1.233080 (0.992) |
| 0.5 | 5.0 | 10° | 1.645085 | 1.616915 (0.983) | 1.625192 (0.988) |
| 0.5 | 5.0 | 5° | 2.415402 | 2.412935 (0.999) | 2.416005 (1.000) |
| 5.0 | 0.5 | 45° | 0.461405 | 0.410448 (0.886) | 0.460634 (0.998) |
| 5.0 | 0.5 | 5° | 0.449428 | 0.450249 (1.002) | 0.450822 (1.003) |
The table makes it clear that when tracks are nearly all radial, Sti is doing very well. Even when crossing angles are diverse, Sti is still getting the numbers right within a few percent.
Also, when materials are oriented more azimuthally than radially, Sti does well for nearly any crossing angle. I will place the same plots as shown above now using a material with width = 5.0 cm, and thicknes 0.5 cm, but with the images shrunk down here (open them in a separate tab or window to see full scale).
-Gene
Groups:
- genevb's blog
- Login or register to post comments