- genevb's home page
- Posts
- 2025
- 2024
- 2023
- 2022
- September (1)
- 2021
- 2020
- 2019
- 2018
- 2017
- December (1)
- October (3)
- September (1)
- August (1)
- July (2)
- June (2)
- April (2)
- March (2)
- February (1)
- 2016
- November (2)
- September (1)
- August (2)
- July (1)
- June (2)
- May (2)
- April (1)
- March (5)
- February (2)
- January (1)
- 2015
- December (1)
- October (1)
- September (2)
- June (1)
- May (2)
- April (2)
- March (3)
- February (1)
- January (3)
- 2014
- 2013
- 2012
- 2011
- January (3)
- 2010
- February (4)
- 2009
- 2008
- 2005
- October (1)
- My blog
- Post new blog entry
- All blogs
Sti, StiCA, Sti+Hit-ReUse comparisons
Updated on Thu, 2016-11-17 18:05. Originally created by genevb on 2016-11-17 15:39.
This is a repeat of the study I did last April: Sti comparison between SL16b for HitReUseOn. This time I am testing in DEV as of 2016-11-16, and comparing Sti, StiCA, and Sti+Hit-ReUse in their current states, but still using the same 500 events from Run 13 pp510 run 14079008.
First, some track counts. In this table, I quote a fractional increase in TPC tracks relative to standard Sti: a fractional increase of 0.50 means that there are 50% more tracks, e.g. 100 standard Sti tracks and 150 tracks when re-using TPC hits.
Documentation on what are "my cuts" is available here.
I made three track-by-track comparisons, using the sample of globals passing my cuts from the table above, and I include the April results as a comparison point:
We see that there were far fewer unmatched standard Sti tracks in April. Also, while StiCA finds more tracks that pass my cuts than Sti+ReUse, fewer of the StiCA tracks match with standard Sti tracks. StiCA and Sti+ReUse do show a rather large increase in matched tracks between each other, and it is particularly worth noting that the 126680 matched tracks between these two is a larger number than the 118311 tracks found by standard Sti (implying that StiCA and Sti+ReUse are similarly finding lots of tracks that standard Sti has missed).
Here are some detailed plots comparing quantities track-by-track...
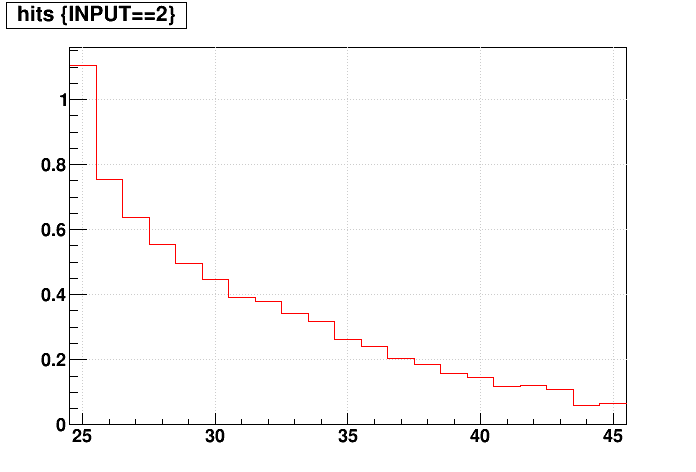
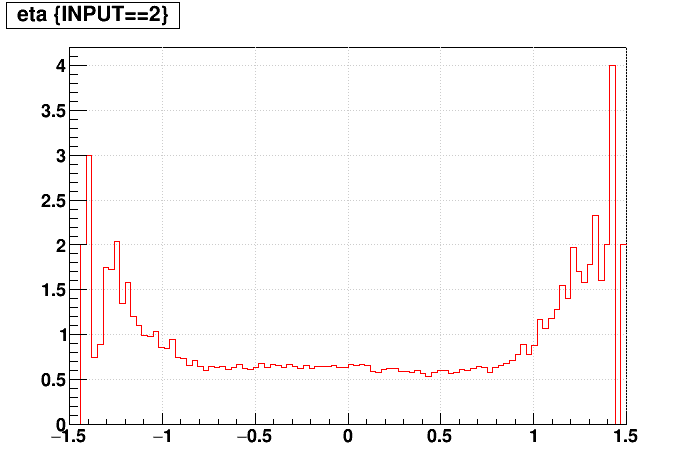
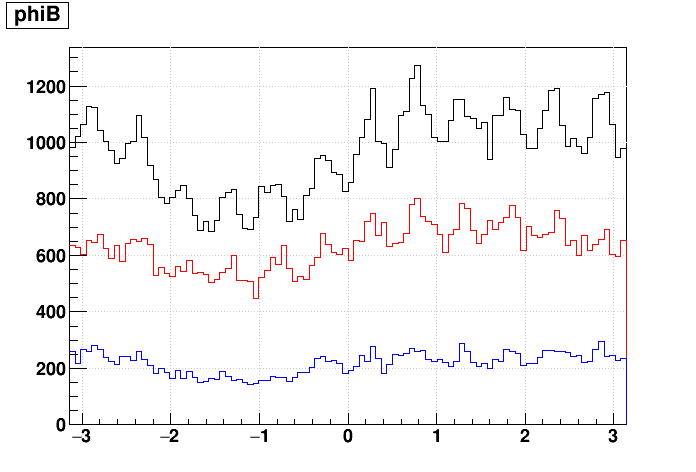
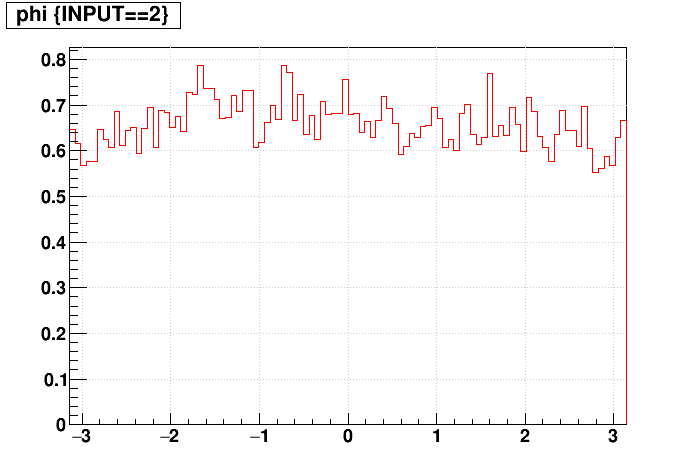
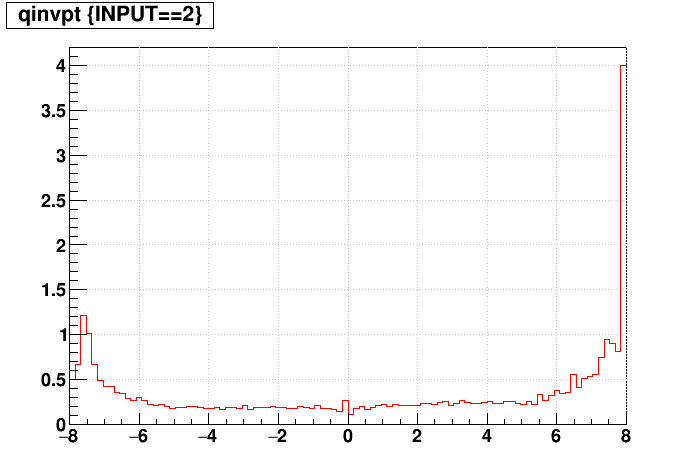
1) Sti vs. Sti+ReUse
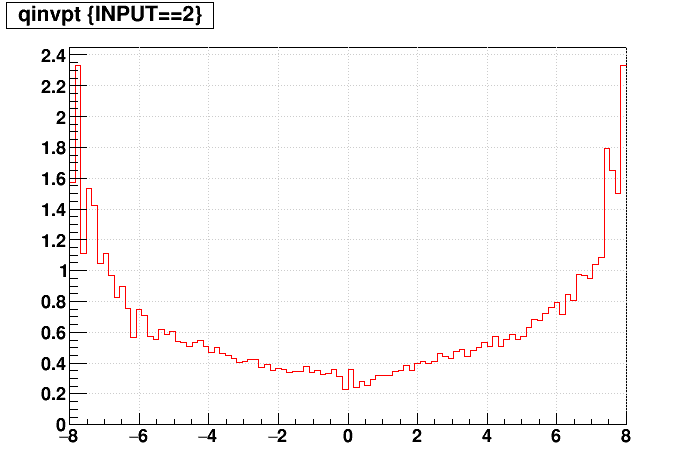
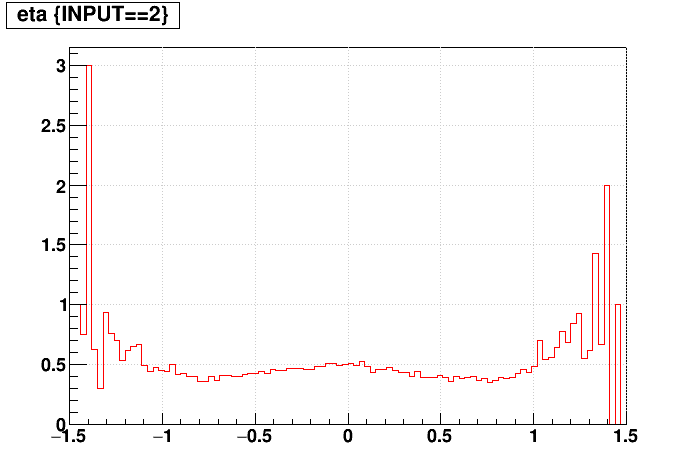
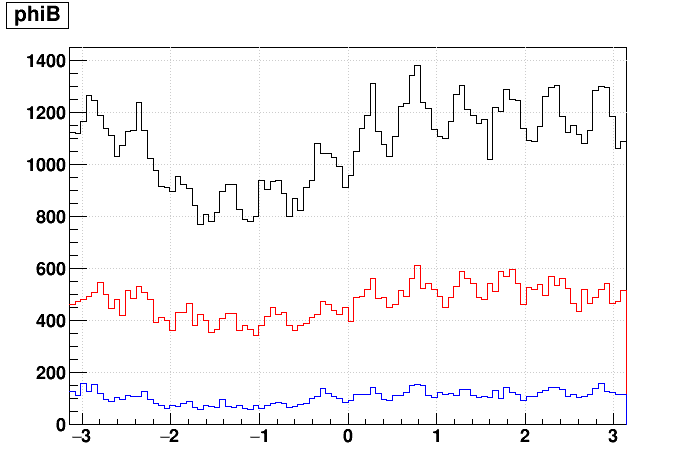
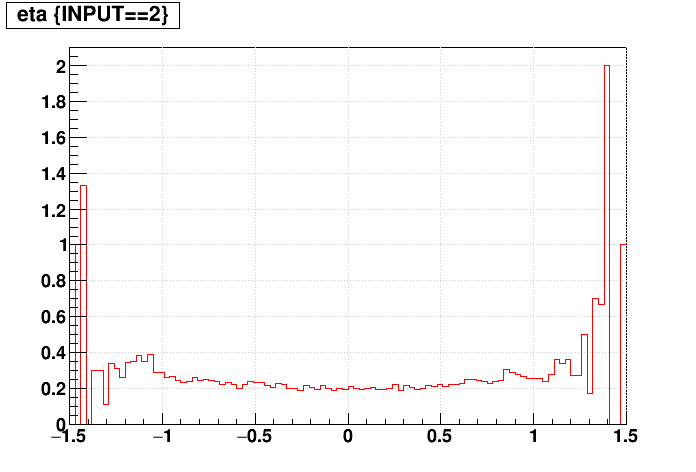
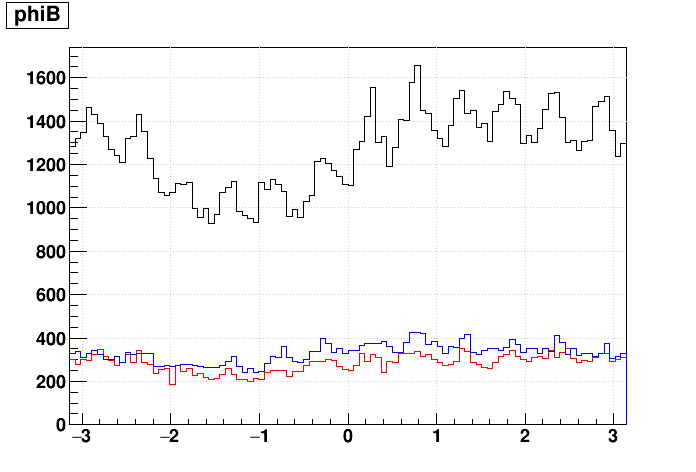
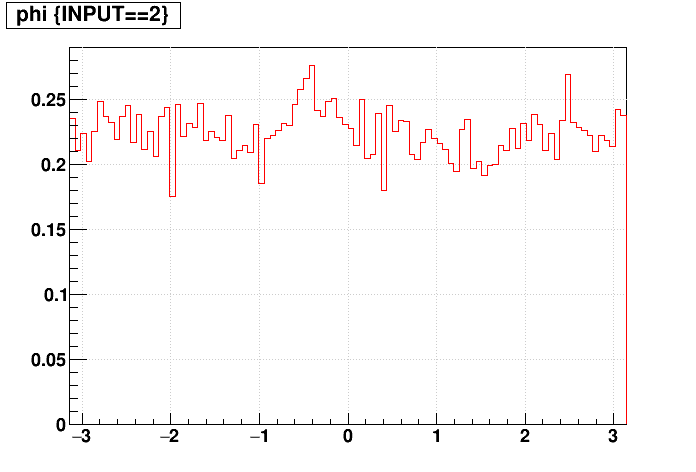
The first plot shows three distributions: matched tracks (black), unmatched tracks from Sti+ReUse (red), unmatched tracks from Sti (blue); the second plot shows the ratio of red/black, i.e. the fractional increase of tracks due to turning on re-use.
2) Sti vs. StiCA
The first plot shows three distributions: matched tracks (black), unmatched tracks from StiCA (red), unmatched tracks from Sti (blue); the second plot shows the ratio of red/black, i.e. the fractional increase of tracks due to turning on StiCA.
2) StiCA vs. Sti+ReUse
The first plot shows three distributions: matched tracks (black), unmatched tracks from Sti+ReUse (red), unmatched tracks from StiCA (blue); the second plot shows the ratio of red/black, i.e. the fractional increase of tracks due to Sti+ReUse over StiCA.
One final note on reconstruction time (same node): 32.9 CPU-sec/event with Sti+ReUse vs. 22.0 CPU-sec/event for standard Sti, and 22.1 CPU-sec/event for StiCA.
-Gene
First, some track counts. In this table, I quote a fractional increase in TPC tracks relative to standard Sti: a fractional increase of 0.50 means that there are 50% more tracks, e.g. 100 standard Sti tracks and 150 tracks when re-using TPC hits.
| Sti | Sti+ReUse | fractional increase | StiCA | fractional increase | distributions for Sti (black), Sti+ReUse (red), and StiCA (blue) | |
| total global tracks | 2339469 | 1820840 | -0.22 | 2135956 | -0.09 | 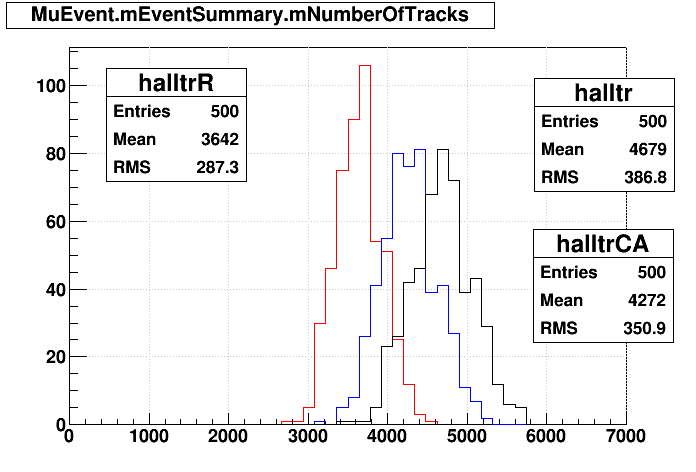 |
| "good" global tracks | 1085507 | 1055555 | -0.03 | 1175753 | 0.08 | 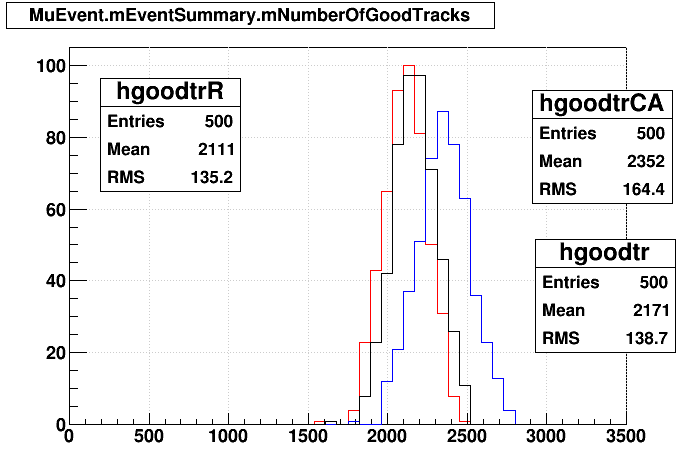 |
| "good" primary tracks | 77077 | 76687 | -0.01 | 97162 | 0.26 | 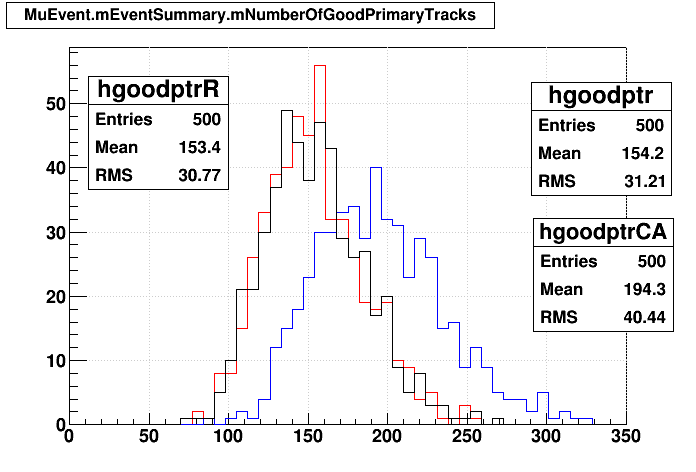 |
| globals passing my cuts | 118311 | 155032 | 0.31 | 159665 | 0.35 | (not available) |
Documentation on what are "my cuts" is available here.
I made three track-by-track comparisons, using the sample of globals passing my cuts from the table above, and I include the April results as a comparison point:
| A=Sti, B=Sti+ReUse | A=Sti, B=StiCA | A=StiCA, B=Sti+ReUse | A=Sti, B=Sti+ReUse (April) | |
|---|---|---|---|---|
| Matches | 107696 | 96549 | 126680 | 129040 |
| Unmatched from A | 10615 | 21762 | 32985 | 2572 |
| Unmatched from B | 47336 | 63116 | 28352 | 89699 |
We see that there were far fewer unmatched standard Sti tracks in April. Also, while StiCA finds more tracks that pass my cuts than Sti+ReUse, fewer of the StiCA tracks match with standard Sti tracks. StiCA and Sti+ReUse do show a rather large increase in matched tracks between each other, and it is particularly worth noting that the 126680 matched tracks between these two is a larger number than the 118311 tracks found by standard Sti (implying that StiCA and Sti+ReUse are similarly finding lots of tracks that standard Sti has missed).
Here are some detailed plots comparing quantities track-by-track...
1) Sti vs. Sti+ReUse
The first plot shows three distributions: matched tracks (black), unmatched tracks from Sti+ReUse (red), unmatched tracks from Sti (blue); the second plot shows the ratio of red/black, i.e. the fractional increase of tracks due to turning on re-use.
| q/pT | 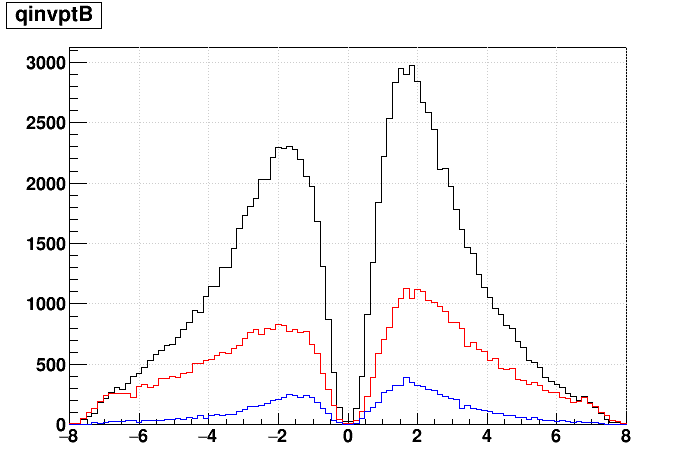 |
 |
|---|---|---|
| η | 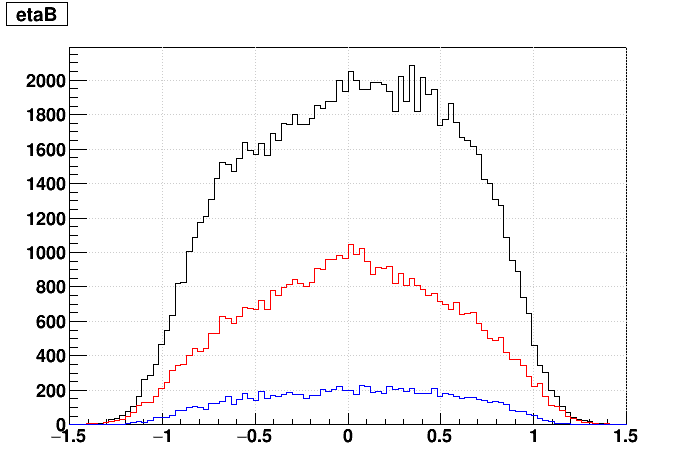 |
 |
| φ (defined here as azimuthal angle of pointing [or momentum] vector near primary vertex) |
 |
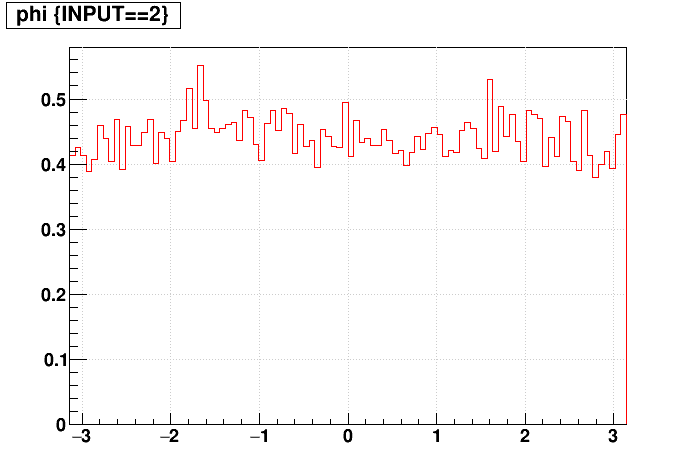 |
| zvertex |  |
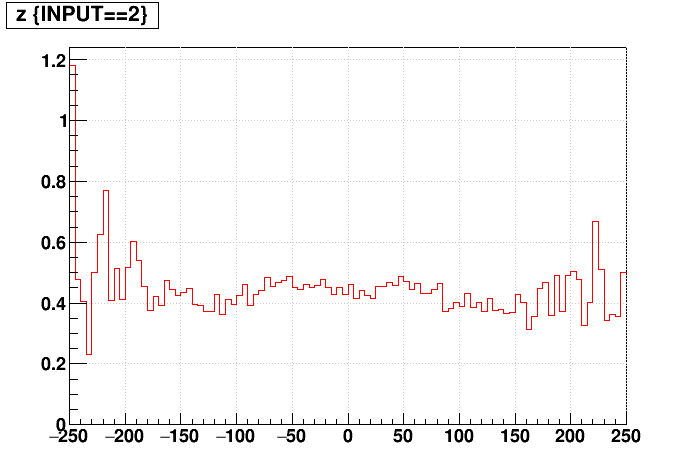 |
| signed DCA | 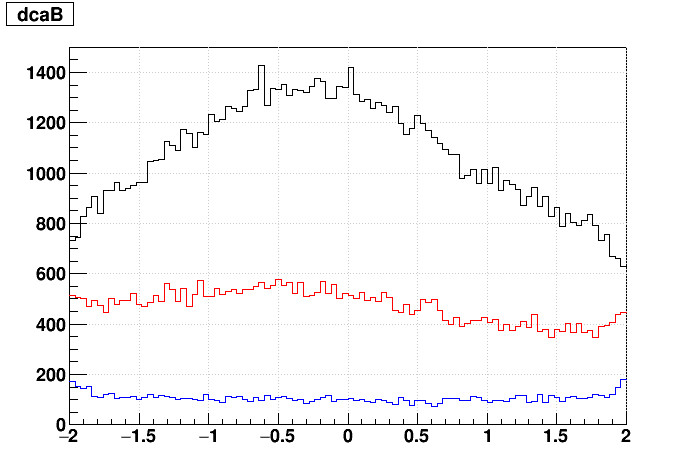 |
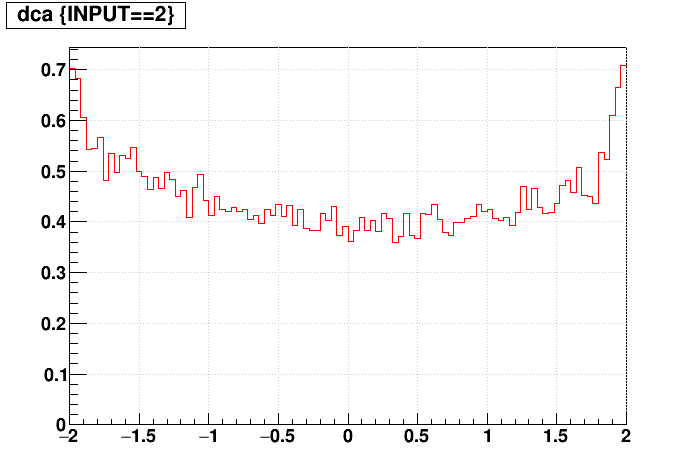 |
| Nhits | 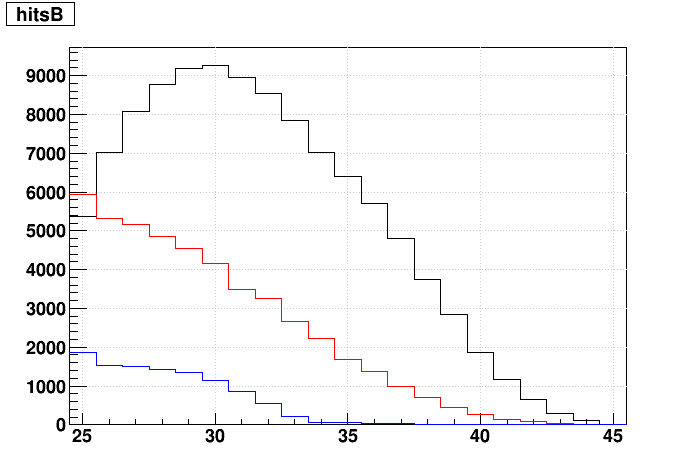 |
 |
2) Sti vs. StiCA
The first plot shows three distributions: matched tracks (black), unmatched tracks from StiCA (red), unmatched tracks from Sti (blue); the second plot shows the ratio of red/black, i.e. the fractional increase of tracks due to turning on StiCA.
| q/pT | 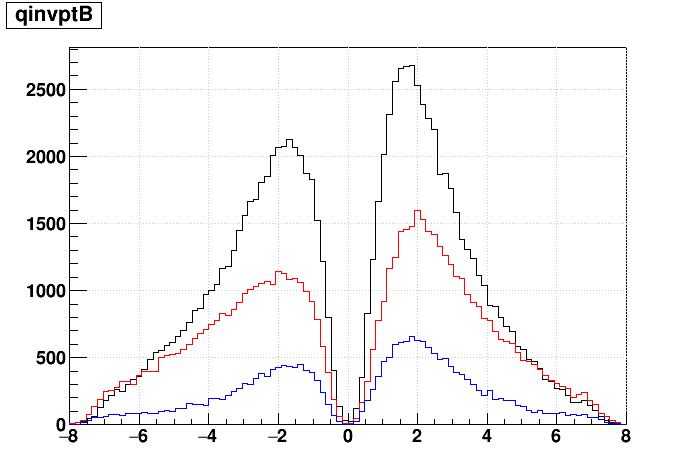 |
 |
|---|---|---|
| η | 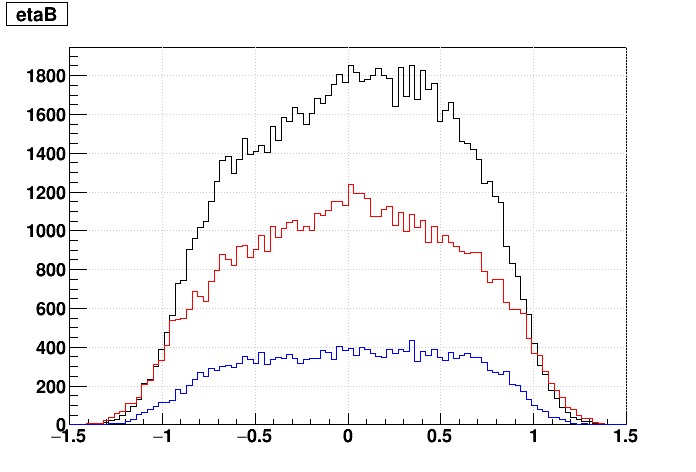 |
 |
| φ (defined here as azimuthal angle of pointing [or momentum] vector near primary vertex) |
 |
 |
| zvertex | 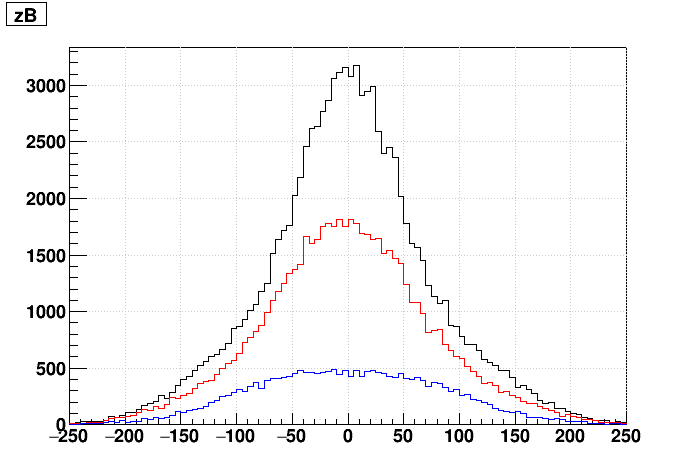 |
 |
| signed DCA | 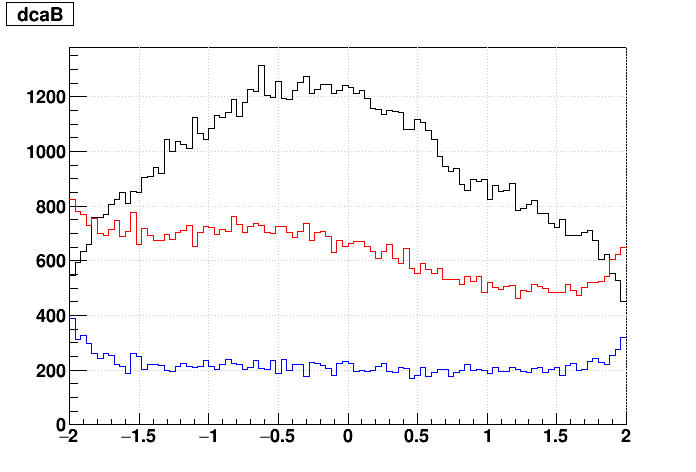 |
 |
| Nhits | 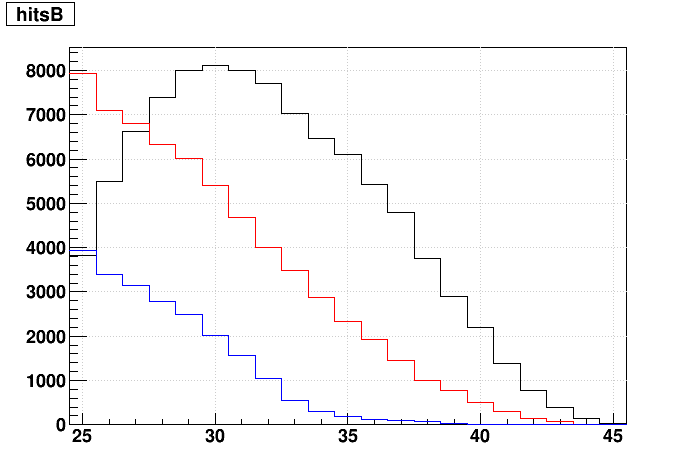 |
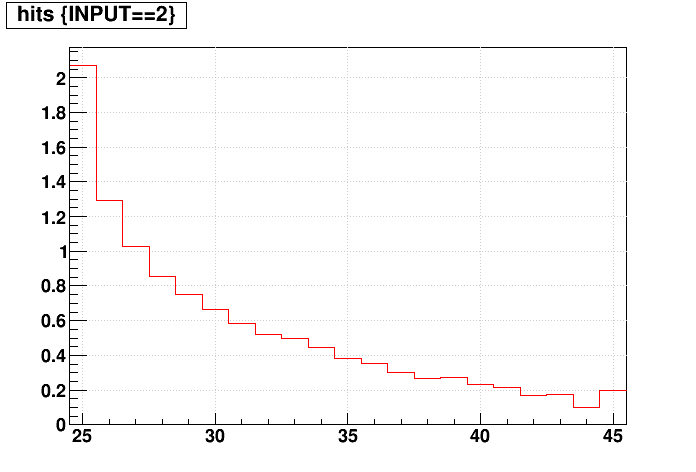 |
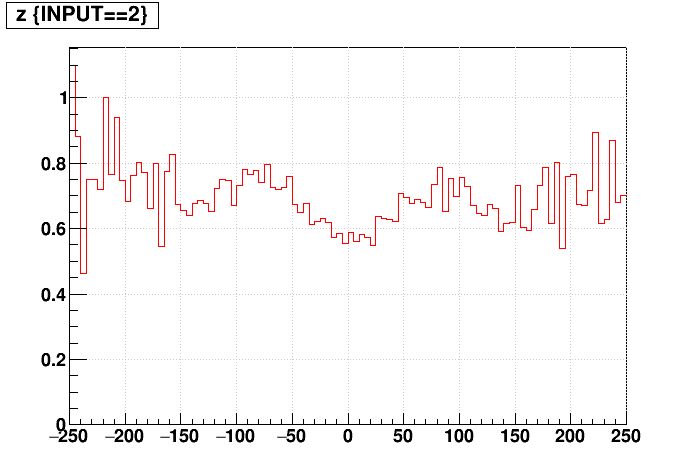
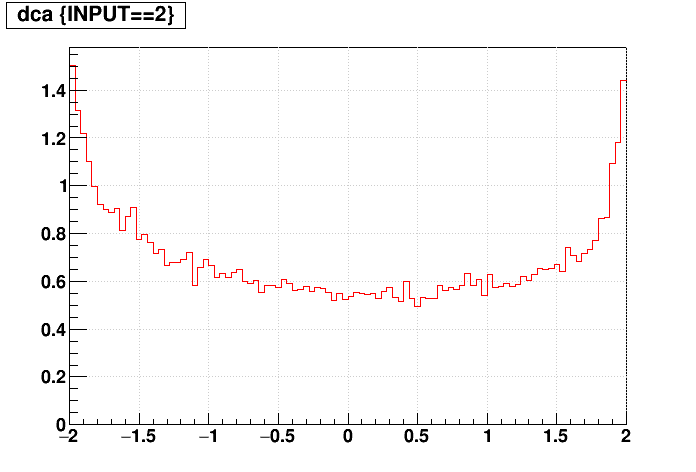
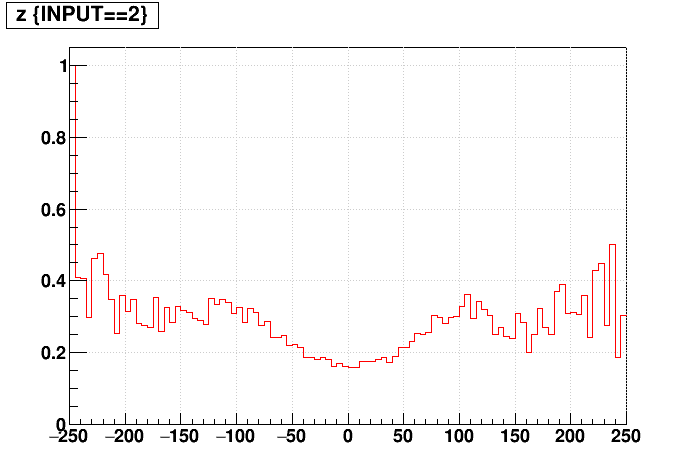
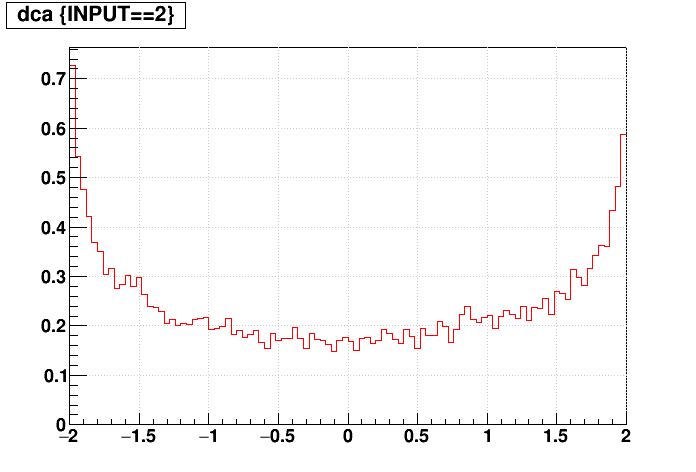
2) StiCA vs. Sti+ReUse
The first plot shows three distributions: matched tracks (black), unmatched tracks from Sti+ReUse (red), unmatched tracks from StiCA (blue); the second plot shows the ratio of red/black, i.e. the fractional increase of tracks due to Sti+ReUse over StiCA.
| q/pT | 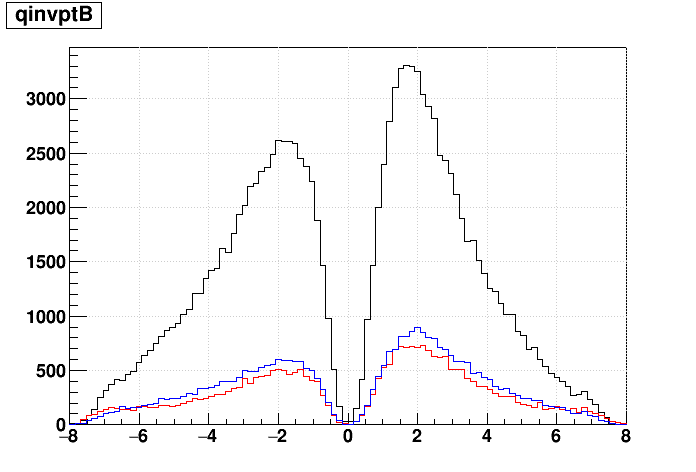 |
 |
|---|---|---|
| η | 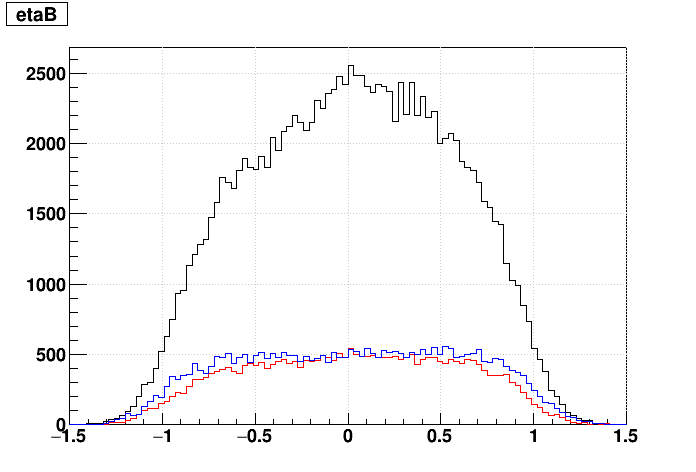 |
 |
| φ (defined here as azimuthal angle of pointing [or momentum] vector near primary vertex) |
 |
 |
| zvertex | 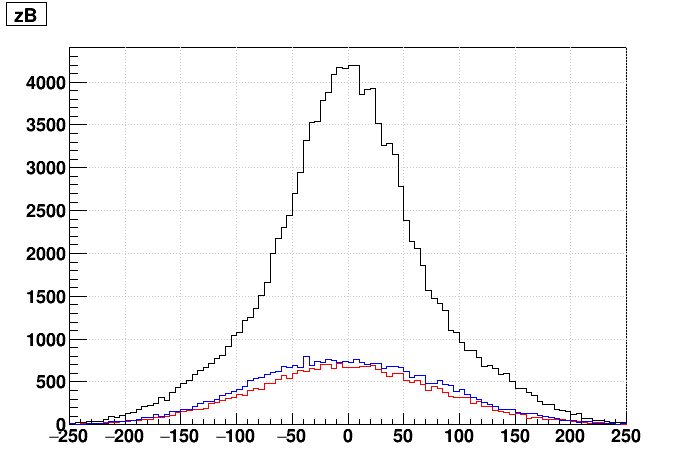 |
 |
| signed DCA | 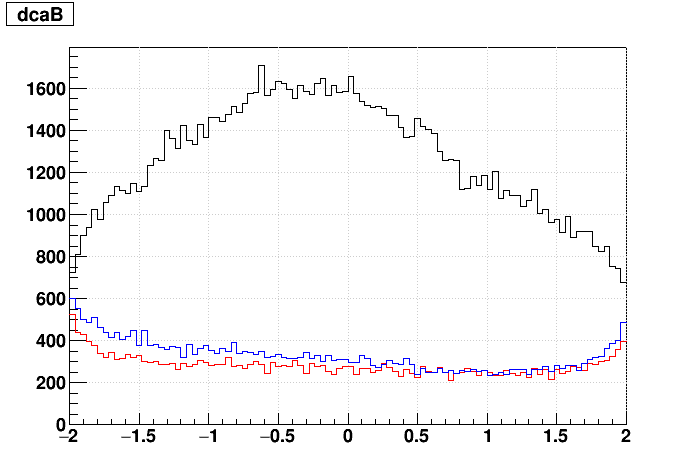 |
 |
| Nhits | 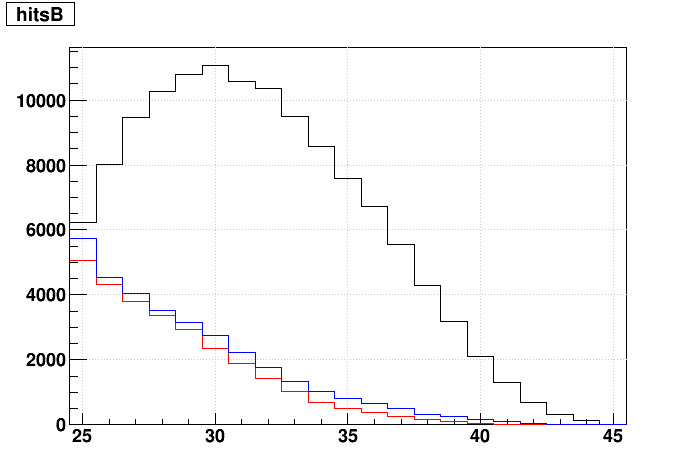 |
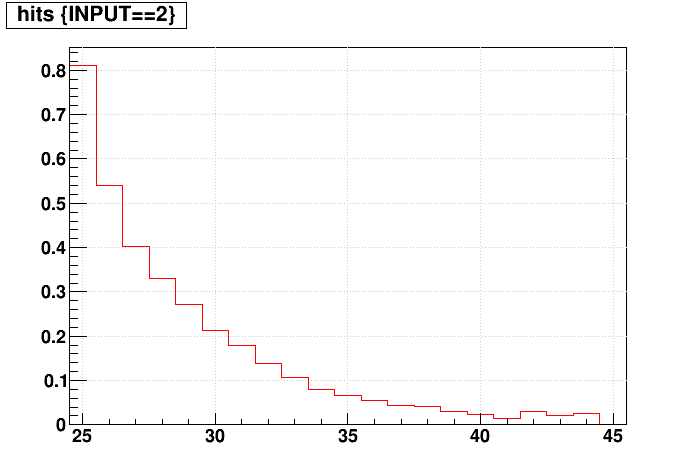 |
One final note on reconstruction time (same node): 32.9 CPU-sec/event with Sti+ReUse vs. 22.0 CPU-sec/event for standard Sti, and 22.1 CPU-sec/event for StiCA.
-Gene
»
- genevb's blog
- Login or register to post comments