- genevb's home page
- Posts
- 2025
- 2024
- 2023
- 2022
- September (1)
- 2021
- 2020
- 2019
- December (1)
- October (4)
- September (2)
- August (6)
- July (1)
- June (2)
- May (4)
- April (2)
- March (3)
- February (3)
- 2018
- 2017
- December (1)
- October (3)
- September (1)
- August (1)
- July (2)
- June (2)
- April (2)
- March (2)
- February (1)
- 2016
- November (2)
- September (1)
- August (2)
- July (1)
- June (2)
- May (2)
- April (1)
- March (5)
- February (2)
- January (1)
- 2015
- December (1)
- October (1)
- September (2)
- June (1)
- May (2)
- April (2)
- March (3)
- February (1)
- January (3)
- 2014
- December (2)
- October (2)
- September (2)
- August (3)
- July (2)
- June (2)
- May (2)
- April (9)
- March (2)
- February (2)
- January (1)
- 2013
- December (5)
- October (3)
- September (3)
- August (1)
- July (1)
- May (4)
- April (4)
- March (7)
- February (1)
- January (2)
- 2012
- December (2)
- November (6)
- October (2)
- September (3)
- August (7)
- July (2)
- June (1)
- May (3)
- April (1)
- March (2)
- February (1)
- 2011
- November (1)
- October (1)
- September (4)
- August (2)
- July (4)
- June (3)
- May (4)
- April (9)
- March (5)
- February (6)
- January (3)
- 2010
- December (3)
- November (6)
- October (3)
- September (1)
- August (5)
- July (1)
- June (4)
- May (1)
- April (2)
- March (2)
- February (4)
- January (2)
- 2009
- November (1)
- October (2)
- September (6)
- August (4)
- July (4)
- June (3)
- May (5)
- April (5)
- March (3)
- February (1)
- 2008
- 2005
- October (1)
- My blog
- Post new blog entry
- All blogs
TPC FCS: location determination methods
Updated on Fri, 2021-11-12 20:30. Originally created by genevb on 2021-11-12 17:57.
NB: Important earlier work on this subject can be found here: Modeled distortions
For Run 22, it appears we have a new field cage short (FCS) in the inner west TPC field cage. Three ways to identify the location of the short using lasers are discussed here:
Option 1 is best done when data exists a short time before and after the FCS begins/ends. Without the reference without the FCS, the method suffers from whatever uncertainty there may be in guessing the undistorted position.
Option 2 is the easiest to implement, but is it sensitive enough? Let's find out...
First, here are some plots of the distortion in r-φ at a radius of 60 cm due to a short in the IFC west as a function of z for a short located at ring 90.5 (black), 100.5 (red), and 140.5 (blue). Solid lines are for no additional external resistance, short-dashed lines for 2 MΩ, and the dash-dot-dot lines are for 10 MΩ of external resistance.
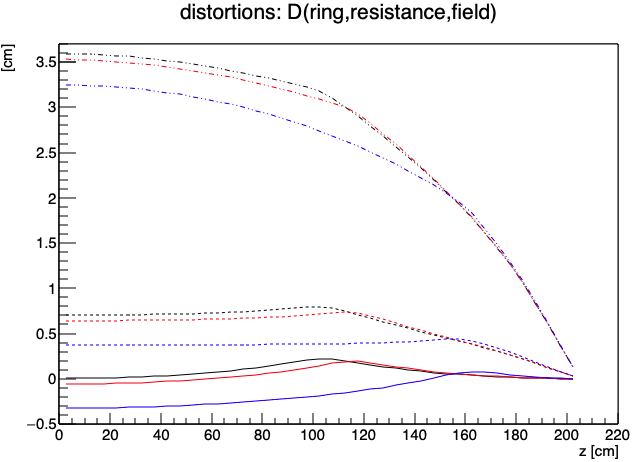
The above plot does not show the effect of changing the magnetic field direction, but it should be sufficient to understand that it simply inverts the sign of the distortion.
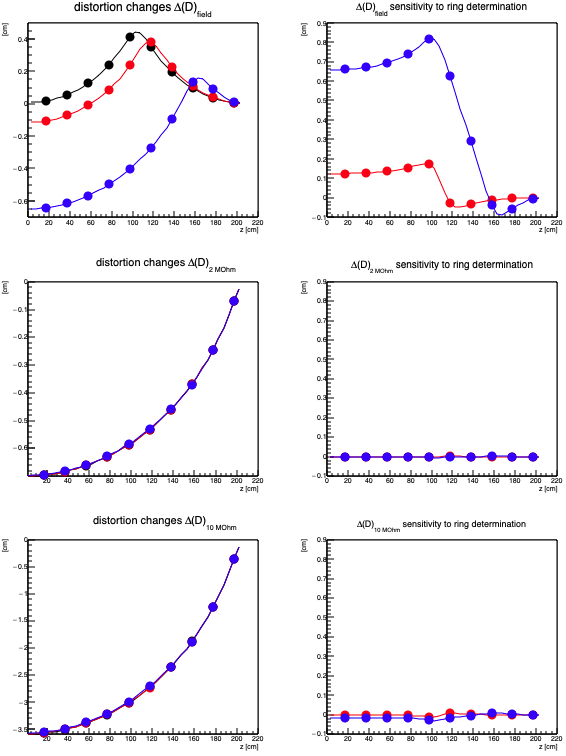
Below are some plots to show the impacts of changing either the magnetic field, or the external resistance, in order to determine the location of the FCS. The left plots show the change in the distortion, Δ(D), caused by changing either the direction of the magnetic field (top row), the external resistance by 2 MΩ (middle row), or the external resistance by 10 MΩ (bottom row), with colors indicating the location of the short as above. In other words, as an example, the left middle plot below is the three solid curves above minus the three short-dashed curves above. This is essentially what can be done easily with TPC laser data: look at the change in hit positions due to changing the conditions.
The fact that the bottom two plots on the left show almost no difference due to the location of the short (i.e. all colors lie almost on top of each other), already indicates that the ability to locate a short using the method of changing the external resistance is much worse than the ability provided by changing the magnetic field direction.
A little more detail can be understood by taking the difference of differences, shown on the right-side plots below. This is the same data as shown on the left, but with black minus red from the left shown in red on the right, and black minus blue from the left shown in blue on the right. These right three plots all use the same vertical scale, and indicate what hit location shift sensitivity is needed to determine the FCS location with some level of accuracy. In other words, the top right plot shows that the blue curve reaches a magnitude of a little less than 1 cm, and the blue curve represents sensitivity to knowing the FCS location to within 50 rings (ring 90.5 vs. 140.5) when flipping the magnetic field direction. So if one can measure the hit location shift to an accuracy of 1 cm, one can measure the FCS location to within 50 rings just fine. Alternatively, the red curve is for a 10 ring sensitivity (90.5 vs. 100.5), and for that level of ring location determination, the red curve shows that ~2 mm of hit location shift measurement is needed.
Going down to the middle and bottom rows, one needs to measure the hit location shift to sub-100 μm level to determine the ring location even to within 50 rings when adding 2 MΩ of external resistance. Using 10 MΩ of external resistance (bottom right) makes it only a little bit easier: maybe ~200 μm to know the ring location to within 50 rings (blue), and perhaps ~100 μm to know within 10 rings (red). Again, this doesn't mean measuring a shift of only ~100 μm, but measuring the amount of shift to within ~100 μm to indicate the position of the FCS. It is evident that much less accuracy of measuring the shifts is needed when flipping the magnetic field than when changing the external resistance, and systematics in the hit measurements may already contribute at the level of up to 1 mm!
Further, when measuring the shifts with lasers in the TPC, measurements cannot be made along all z positions, so the curves in the plots are a bit generous in terms of the amount of information. Instead, the lasers are only going to be at a few z positions, which I've tried to represent below as the markers, which will be more like the data that will be maximally available. I say maximally because it's certain that we will have even fewer reconstructable laser positions than shown by these every-20 cm markers.
-Gene
TPC Field Cage Shorts: different methods for determining their location
NB: Important earlier work on this subject can be found here: Modeled distortions
For Run 22, it appears we have a new field cage short (FCS) in the inner west TPC field cage. Three ways to identify the location of the short using lasers are discussed here:
- Try to estimate the distortion by guessing where the undistorted location of the TPC hits from lasers should be
- Measure the distortion change due to adding resistance to the end of the resistor chain, external to the TPC
- Measure the distortion change due to flipping the magnetic field
Option 1 is best done when data exists a short time before and after the FCS begins/ends. Without the reference without the FCS, the method suffers from whatever uncertainty there may be in guessing the undistorted position.
Option 2 is the easiest to implement, but is it sensitive enough? Let's find out...
First, here are some plots of the distortion in r-φ at a radius of 60 cm due to a short in the IFC west as a function of z for a short located at ring 90.5 (black), 100.5 (red), and 140.5 (blue). Solid lines are for no additional external resistance, short-dashed lines for 2 MΩ, and the dash-dot-dot lines are for 10 MΩ of external resistance.
The above plot does not show the effect of changing the magnetic field direction, but it should be sufficient to understand that it simply inverts the sign of the distortion.
Below are some plots to show the impacts of changing either the magnetic field, or the external resistance, in order to determine the location of the FCS. The left plots show the change in the distortion, Δ(D), caused by changing either the direction of the magnetic field (top row), the external resistance by 2 MΩ (middle row), or the external resistance by 10 MΩ (bottom row), with colors indicating the location of the short as above. In other words, as an example, the left middle plot below is the three solid curves above minus the three short-dashed curves above. This is essentially what can be done easily with TPC laser data: look at the change in hit positions due to changing the conditions.
The fact that the bottom two plots on the left show almost no difference due to the location of the short (i.e. all colors lie almost on top of each other), already indicates that the ability to locate a short using the method of changing the external resistance is much worse than the ability provided by changing the magnetic field direction.
A little more detail can be understood by taking the difference of differences, shown on the right-side plots below. This is the same data as shown on the left, but with black minus red from the left shown in red on the right, and black minus blue from the left shown in blue on the right. These right three plots all use the same vertical scale, and indicate what hit location shift sensitivity is needed to determine the FCS location with some level of accuracy. In other words, the top right plot shows that the blue curve reaches a magnitude of a little less than 1 cm, and the blue curve represents sensitivity to knowing the FCS location to within 50 rings (ring 90.5 vs. 140.5) when flipping the magnetic field direction. So if one can measure the hit location shift to an accuracy of 1 cm, one can measure the FCS location to within 50 rings just fine. Alternatively, the red curve is for a 10 ring sensitivity (90.5 vs. 100.5), and for that level of ring location determination, the red curve shows that ~2 mm of hit location shift measurement is needed.
Going down to the middle and bottom rows, one needs to measure the hit location shift to sub-100 μm level to determine the ring location even to within 50 rings when adding 2 MΩ of external resistance. Using 10 MΩ of external resistance (bottom right) makes it only a little bit easier: maybe ~200 μm to know the ring location to within 50 rings (blue), and perhaps ~100 μm to know within 10 rings (red). Again, this doesn't mean measuring a shift of only ~100 μm, but measuring the amount of shift to within ~100 μm to indicate the position of the FCS. It is evident that much less accuracy of measuring the shifts is needed when flipping the magnetic field than when changing the external resistance, and systematics in the hit measurements may already contribute at the level of up to 1 mm!
Further, when measuring the shifts with lasers in the TPC, measurements cannot be made along all z positions, so the curves in the plots are a bit generous in terms of the amount of information. Instead, the lasers are only going to be at a few z positions, which I've tried to represent below as the markers, which will be more like the data that will be maximally available. I say maximally because it's certain that we will have even fewer reconstructable laser positions than shown by these every-20 cm markers.
-Gene
»
- genevb's blog
- Login or register to post comments