- BEMC
- BTOF
- DAQ
- Detector Upgrades
- EEMC
- EPD
- ETOF
- FCS
- FGT
- FPD & FMS & FPS
- FTPC
- FTT
- HFT
- HLT
- L3
- MTD
- MTD NPS Maps
- PMD
- PP2PP
- RICH
- Roman Pot Phase II*
- Run-18 calibrations
- SSD
- SVT
- Slow Controls
- TPC
- TRG
- Trigger Detectors
- VPD
- test
Modeled distortions
Updated on Fri, 2006-03-24 20:35. Originally created by genevb on 2006-03-21 02:09.
Under:
Modeling the Distortion
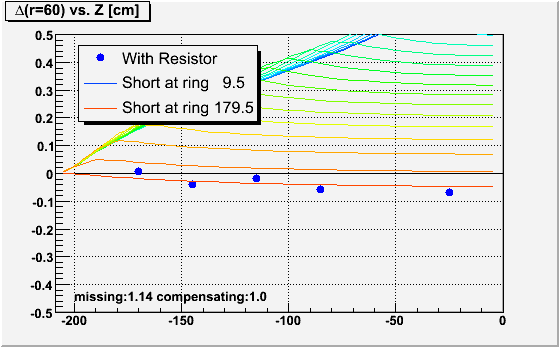
Using StMagUtilities, Jim Thomas and I were able to compare models of the distortions caused by shorts at specific rings in the IFC with the laser data. First, I'll have to say that I was wrong from my Observed laser distortions: the distortion to laser tracks does not have the largest slope at the point where the short is. Instead, it has a maximum at that point! The reason is that the z-component of the electric field due to the distortion (withouth compensating resistor) changes signs at the location of the short. So ExB also changes directions, and the TPC hits are distorted in one rPhi direction on the endcap side of the short, and in the opposite rPhi direction closer to the central membrane.This can be seen in the following plot, where I again show the distortion to laser tracks at a radius of 60cm (approximately the first TPC padrow) versus Z in the east TPC using distored run 7076029 minus undistorted run 7061100 as red data points. Overlayed are curves for the same measure from models of a half-resistor short (actually, 1.14 MOhm short as determined by the excess current of ~240+/-10nA [a full 2MOhm short equates to 420nA difference]) located at rings 9.5, 10.5, ..., 169.5, 179.5 (there are only 182 rings).
[note: earlier plots I have shown included laser data at Z = -55cm, but I've found that the laser tracks there weren't of sufficient quality to use; I've also tried to mask off places where lasers cross over each other]
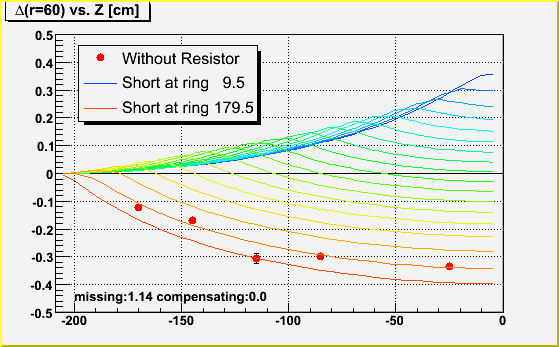
The above plot points towards a short which is located somewhere among rings 165-180 (Z < -190cm). As the previous years' shorted rings were rings 169 and 170 ( = short at ring 169.5), it seems highly likely that the present short is in the same place. More detail can be seen by looking at the actual laser hits. The first listed attached file shows the laser hits as a function of radius for lasers at several locations in Z. The dark blue line is a simple second order polynomial fit I used to obtain the magnitude of the distortion at radius 60cm, which I used in the above plot. The magenta line is the model of the half-resistor short at ring 169.5, and the light blue line is the same for ring 179.5 (the bottom two curves on the above plot). Either curve seems to match the radial dependence fairly well.
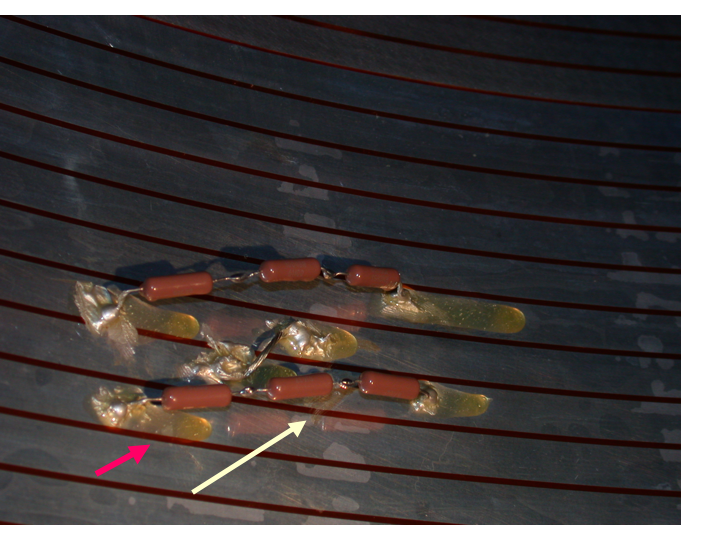
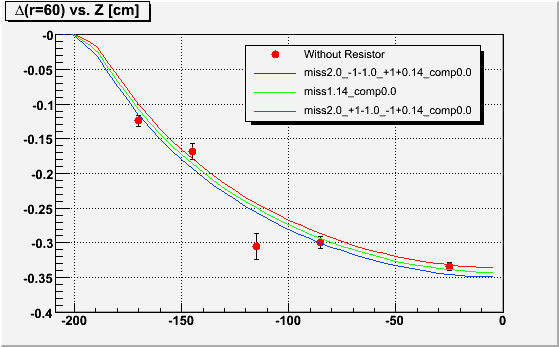
Further refinement can be achieved by modeling the exact resistor chain. We have a permanent short at ring 169.5 (rings 169 and 170 have been tied together), and have replaced the two 2MOhm resistors between 168-169 and 170-171 with two 3MOhm resistors (see the attached photo of the repair, with arrows pointing to candidate locations for shorts via drops of silver epoxy). So it is more likely that we have a 1.14MOhm short on one of these two 3 MOhm resistors. The three curves in this next plot are:
- red: 1.14MOhm short on a 3MOhm resistor at 168.5, full short at 169.5, 3MOhm resistor at 170.5
- green: 1.14MOhm short on a 2MOhm resistor at 169.5, normal 2.0MOhm resistors at 168.5 and 170.5
- blue: 3MOhm resistor at 168.5, full short at 169.5, 1.14MOhm short on a3MOhm resistor at 170.5
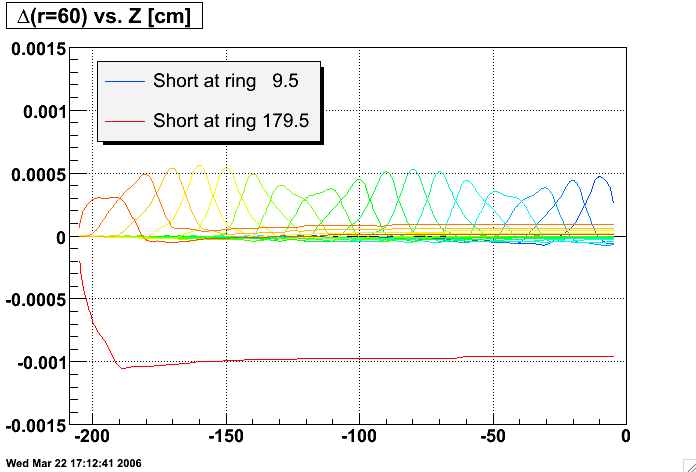
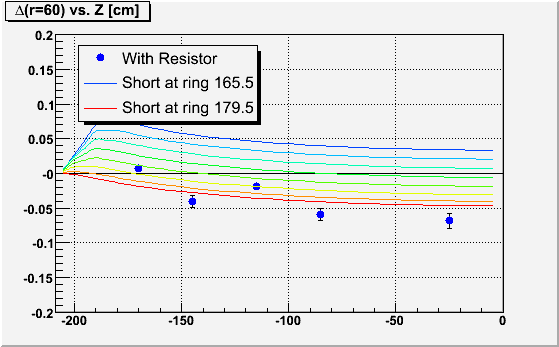
We can also take a look at the data with the resistor in. Here is the same plot as before with a 1.14MOhm short at the same locations, but with an additional compensating resistor of 1.0MOhm. The fact that all the data points are below zero points again towards a short near the very end of the resistor chain, preferring a location of perhaps 177.5 over shorts near ring 170. These plots do not include the use of the 3MOhm resistors, but that difference is below the resolution presented here.
Zoom in with finer granularity between rings (every other ring short shown):
The second listed attached file shows the laser hits as a function of radius for lasers at several locations in Z for the case of the resistor in, again with magenta and blue curves for the model with shorts at ring 169.5 and 179.5 respectively.
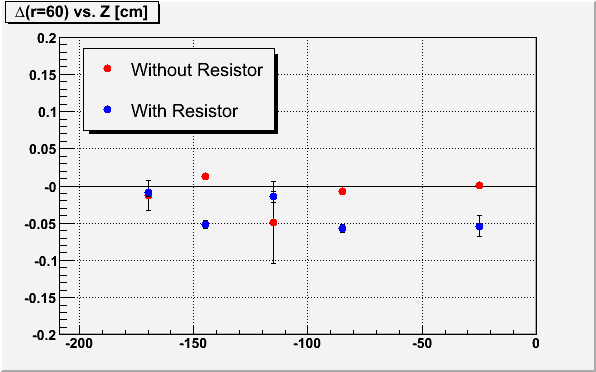
Applying the Correction
I tried running reconstruction on the lasers using the distortion corrections for the 1.14MOhm short at three locations: 170.5 and 171.5 (two possible spots indicated in Alexei's repair photo), and 175.5 (closer to what the with-resistor data pointed to). The results are in the following plots. The conclusion is that the 175.5 location seems to do pretty well at correcting the data, slightly better than the 170.5 and 171.5 locations, for both with and without compensating resistor. For this reason (the laser data), we will proceed with FastOffline using a short at 175.5, even though we have no strong reasons outside the laser data to suspect that the short is anywhere other than the rings 168-172 area where the fix was made.
| 170.5 | 171.5 | 175.5 |
|---|---|---|

|
|

|
Gene Van Buren
gene@bnl.gov
»
- Printer-friendly version
- Login or register to post comments